DOI:
10.1039/D0RA00290A
(Paper)
RSC Adv., 2020,
10, 14218-14224
Simultaneous electrochemical detection of levodapa, paracetamol and L-tyrosine based on multi-walled carbon nanotubes
Received
10th January 2020
, Accepted 31st March 2020
First published on 7th April 2020
Abstract
Herein multi-walled carbon nanotubes (MWCNTs) were processed by ultrasonication and freeze-drying method. The morphology of the processed MWCNTs was examined by scanning electron microscopy. An original electrochemical sensor for the simultaneous detection of levodapa (LD), paracetamol (PA) and L-tyrosine (Tyr) was developed by dropcasting a mixture of processed MWCNTs and Nafion on a glassy carbon electrode. The as-prepared sensor was studied by cyclic voltammetry and differential pulse voltammetry. The peak currents of LD, PA and Tyr significantly increased compared to those obtained at bare glassy carbon electrodes or unprocessed MWCNTs modified electrodes. The peaks of LD, PA and Tyr were well-defined and obviously separated from each other. The linear ranges for detection of LD, PA and Tyr were 2.0–300.0, 2.0–180.0, and 2.0–120.0 μM, with a detection limit of 0.6, 0.5 and 0.8 μM (S/N = 3), respectively. Finally, the sensor was applied to detect LD, PA and Tyr in serum samples, and the results were satisfactory.
Introduction
Parkinson's disease (PD) is the second most common neurodegenerative disease, and causes the progressive deterioration of the motor system. Levodopa (LD) is the most potent medicine in PD treatment.1,2 Along with its effectiveness, LD might cause a series of side effects.3 Hence, the detection of LD is essential for controlling its dose. Several methods for the detection of LD in medicines or biological samples have been reported, including chromatography,4 spectroscopy5 and electrical analysis.6–10
Pain is a common problem in PD patients. Non-steroidal anti-inflammatory drugs, such as paracetamol (PA) and aspirin, are commonly used to relieve PD-related pain.11–13 When administered in a suitable dose, PA has excellent safety. Excessive PA may cause the accumulation of toxic metabolites, resulting in severe time-dependent hepatotoxicity and nephrotoxicity.11 At present, various methods have been introduced for the detection of PA, such as capillary electrophoresis,14 high-performance liquid chromatography (HPLC),15 spectroscopy16 and electrochemical techniques.17,18
L-tyrosine (Tyr) is an amino acid found in the diet that is involved in producing catecholamines such as dopamine and adrenaline. The synthesis of catecholamines is highly regulated in the body and tyrosine hydroxylase converts Tyr into LD. After administration of LD in PD, the levels of Tyr would reduce.19 Orthostatic hypotension (OH) is a common and disabling symptom affecting PD patients.20 Studies have demonstrated that supplementing Tyr may increase norepinephrine and minimize OH in PD.21,22 Different kinds of methods have been developed for the detection of Tyr such as HPLC,23 capillary electrophoresis24 and others.25–27
All of LD, PA and Tyr are commonly used drugs in PD treatment. Especially, Tyr and LD have quite similar chemical structures and physiological functions. Both of them are essential for synthesizing dopamine and some other important biological compounds in human body. So it is very interesting and significant to establish a simple and sensitive method for simultaneous determination of LD, PA and Tyr. The electrochemical approach is a promising choice to realize this goal, due to its prompt response, high sensitivity and selectivity, simple operation, and low cost. Moreover, it is assumed that the redox reactions occurring in the biological systems and at the electrode surfaces have similar principles.28 However, the literature survey shows that there is only one electrochemical sensing platform for simultaneous determination of LD, PA and Tyr has been reported.29 In that paper, a graphene and ethyl 2-(4-ferrocenyl-[1,2,3]triazol-1-yl)acetate modified carbon paste electrode was applied to detect LD in the presence of PA and Tyr using square wave voltammetry.
The carbon nanotubes (CNTs) have been extensively used to develop electrochemical sensors due to their high surface area, excellent electrical conductivity and catalytic properties,30 since their discovery in 1991.31 Herein, the multi-walled carbon nanotubes (MWCNTs) were processed using ultrasonication and freeze-drying method. The processed MWCNTs interconnected and formed a 3D porous framework, which is propitious for electrochemical determination with rapid electron transfer and mass transfer. Then we fabricated a novel electrochemical sensor for simultaneous determination of LD, PA and Tyr based on the processed MWCNTs. In the end, we evaluated the analytical performance of the proposed sensors.
Experimental
Materials and apparatus
All chemicals used in this study were of analytical reagent grade. MWCNTs were purchased from Chengdu Organic Chemicals Co. Ltd., Chinese Academy of Sciences (China). Levodopa was purchased from Hefei Bomei Biological Technology Co., Ltd. (China). Paracetamol and L-Tyrosine were purchased from Aladdin reagent Co., Ltd. (Shanghai, China). Nafion (5 wt%) solution was obtained from Sigma-Aldrich. All solutions in the experiments were prepared in deionized water. Phosphate buffer solutions with different pH values (PBS, 0.1 M) were prepared by mixing stock standard solutions of 0.1 M NaH2PO4 and 0.1 M Na2HPO4.
All electrochemical experiments were conducted on a CHI 760E workstation (CH Instruments, Shanghai, China) with a three-electrode cell, which composed of a working electrode (glassy carbon electrode (GCE), Φ = 3 mm), an Ag/AgCl reference electrode and a platinum wire counter electrode. Error bars represent one standard deviation of the means (n = 3). The morphology of the processed MWCNTs was characterized via scanning electron microscopy (SEM, Hitachi S3400N, Japan).
Pretreatment of MWCNTs
To obtain carboxyl functionalized MWCNTs and remove the impurities, the MWCNTs were oxidized in the mixture of concentrated H2SO4/HNO3 (3![[thin space (1/6-em)]](https://www.rsc.org/images/entities/char_2009.gif) :1 v/v, 98% and 70%, respectively). The mixture was subjected to ultrasonic treatment at 40 °C for 4 h, followed by centrifugation and extensive rinsing with distilled water until the pH of filtrate was neutral. The obtained products were dried at 60 °C for 12 h under vacuum.32
:1 v/v, 98% and 70%, respectively). The mixture was subjected to ultrasonic treatment at 40 °C for 4 h, followed by centrifugation and extensive rinsing with distilled water until the pH of filtrate was neutral. The obtained products were dried at 60 °C for 12 h under vacuum.32
Processing of MWCNTs used for sensor fabrication
Prior to sensor fabrication, the carboxyl functionalized MWCNTs were processed by ultrasonication and freeze-drying methods.33 18 mg of carboxylated multi-walled carbon nanotubes were placed in 18 mL of deionized water, sonicated at 40 °C for 2 h, stirred at room temperature for 3 h, frozen overnight, and freeze-dried for 48 h for collection.
Fabrication of sensor
The GCE was first polished with 1.0 and 0.3 μm alumina powders on the polishing cloth. After each polishing step, it was ultrasonically cleaned with deionized water for 3 min. The processed GCE was dried with nitrogen for the following usage. 1.0 mg MWCNTs processed by ultrasonication and freeze-drying was dispersed in 1 mL 1% Nafion solution and sonicated to obtain a stable MWCNTs-Nafion suspension. Then 8 μL of MWCNTs-Nafion suspension was dropcasted on the surface of a cleaned GCE and dried in the air to obtain MWCNTs-Nafion/GCE. The carboxyl functionalized MWCNTs, which weren't processed by ultrasonication and freeze-drying, were also used to modify GCE using the same procedure for control experiments (marked as MWCNTs (unprocessed)-Nafion/GCE). All electrodes were stored in fridge at 4 °C when not in use.
Results and discussion
SEM of the processed MWCNTs
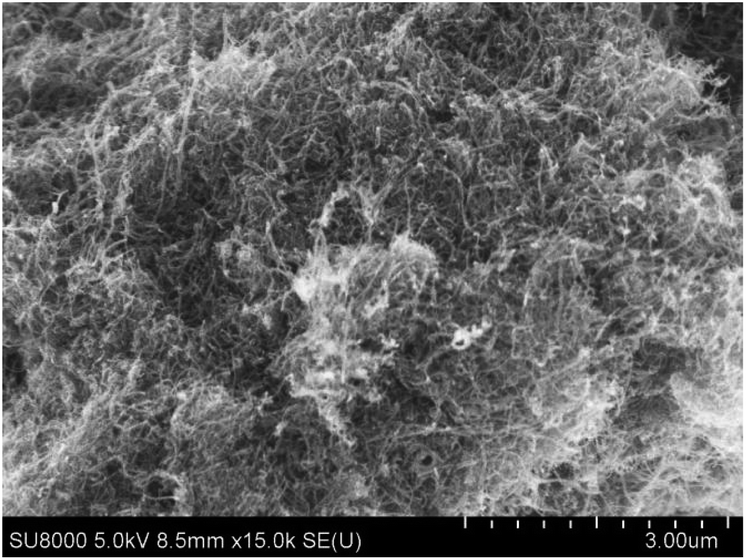
The morphology of MWCNTs after the ultrasonication and freeze-drying treatment was characterized by SEM. The porous and interconnected integrated framework of multi-walled carbon nanotubes can be clearly seen from Fig. 1, which exhibits a higher specific surface area and contributes to strong adsorption and rapid diffusion of analyte. Most of the carbon nanotubes are in fluffy and homogeneous single state, indicating that the dispersion of MWCNTs is improved after the ultrasonication and freeze-drying processing.
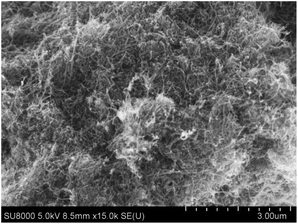 |
| | Fig. 1 SEM image of MWCNTs after the ultrasonication and freeze-drying treatment. | |
Electrochemical response of LD, PA and Tyr
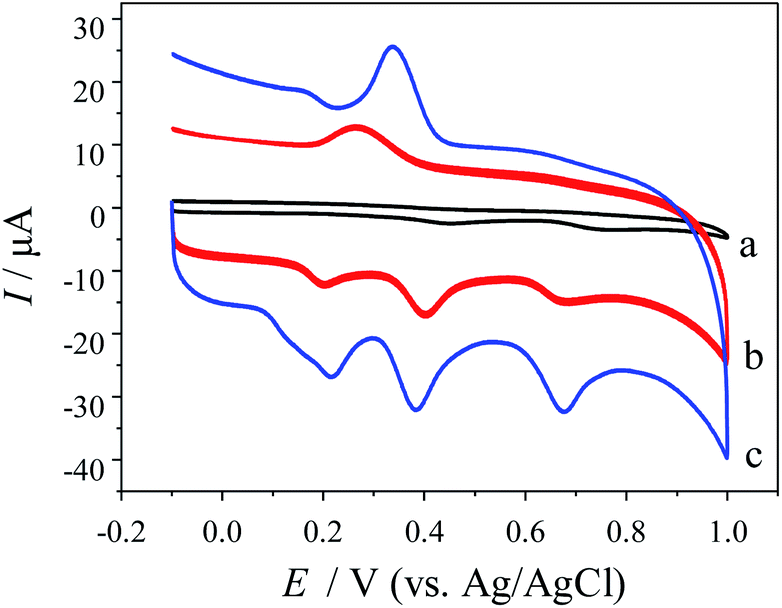
The electrochemical responses of LD, PA and Tyr were characterized by cyclic voltammetry (CV) at different electrodes. Fig. 2 shows the CVs of 0.05 mM LD, 0.03 mM PA and 0.10 mM Tyr at (a) GCE, (b) MWCNTs (unprocessed)-Nafion/GCE and (c) MWCNTs-Nafion/GCE. Three tiny oxidation peaks of LD, PA and Tyr were observed at GCE (curve a). The resolution and intensity of these oxidation peaks were too low to realize the simultaneous detection of LD, PA and Tyr. At MWCNTs (unprocessed)-Nafion/GCE (curve b), the oxidation peaks of LD, PA and Tyr increased obviously. And the electrochemical reversibility of PA was improved, since the corresponding reduction peak of PA appeared. This indicated that MWCNTs were benefit to the electrochemical reactions of LD, PA and Tyr. At MWCNTs-Nafion/GCE (curve c), all the redox peaks of LD, PA and Tyr were significantly larger than those at MWCNTs (unprocessed)-Nafion/GCE. And the reduction peak potential of PA shifted positively. This was because ultrasonication and freeze-drying made the MWCNTs fluffy and easily dispersed, thereby greatly enhancing their processability and circumventing the decline of excellent electrochemical properties induced by the aggregation. The well-defined oxidation peaks of LD, PA and Tyr were located at 212 mV, 393 mV and 683 mV, respectively. It was clearly indicated that MWCNTs-Nafion/GCE had an efficient catalysis towards the electrochemical reactions of LD, PA and Tyr. Both the separations of oxidation peaks and current responses at MWCNTs-Nafion/GCE were large enough for simultaneous determination of the above three analytes in mixture.
 |
| | Fig. 2 Cyclic voltammograms of 0.05 mM LD, 0.03 mM PA and 0.10 mM Tyr in 0.1 M PBS (pH 7.0) at different electrodes: (a) GCE, (b) MWCNTs (unprocessed)-Nafion/GCE, (c) MWCNTs-Nafion/GCE. Scan rate: 100 mV s−1. | |
Optimization of MWCNTs-Nafion dosage
The influence of MWCNTs-Nafion film thickness on the oxidation peak currents of LD, PA and Tyr was examined. The thickness of MWCNTs-Nafion film was restricted by the volume of MWCNTs-Nafion suspension dropped on the GCE surface. Fig. 3 shows that all the oxidation peak currents of LD, PA and Tyr increased at first with suspension volume in the cause of the expansion of effective area of MWCNTs-Nafion/GCE, and then decreased indicating that a thicker MWCNTs-Nafion film results in a more difficult electrode response. The oxidation peak currents of LD, PA and Tyr peaked at 8 μL. Accordingly, the optimum volume of MWCNTs-Nafion suspension was 8 μL.
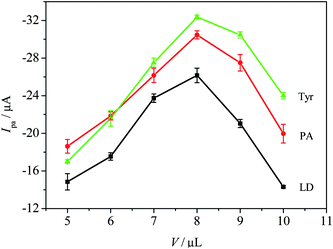 |
| | Fig. 3 The dependences of the oxidation currents of LD, PA and Tyr on the volume of MWCNTs-Nafion suspension in the presence of 0.05 mM LD, 0.03 mM PA and 0.10 mM Tyr in 0.1 M PBS (pH 7.0). | |
Effect of pH
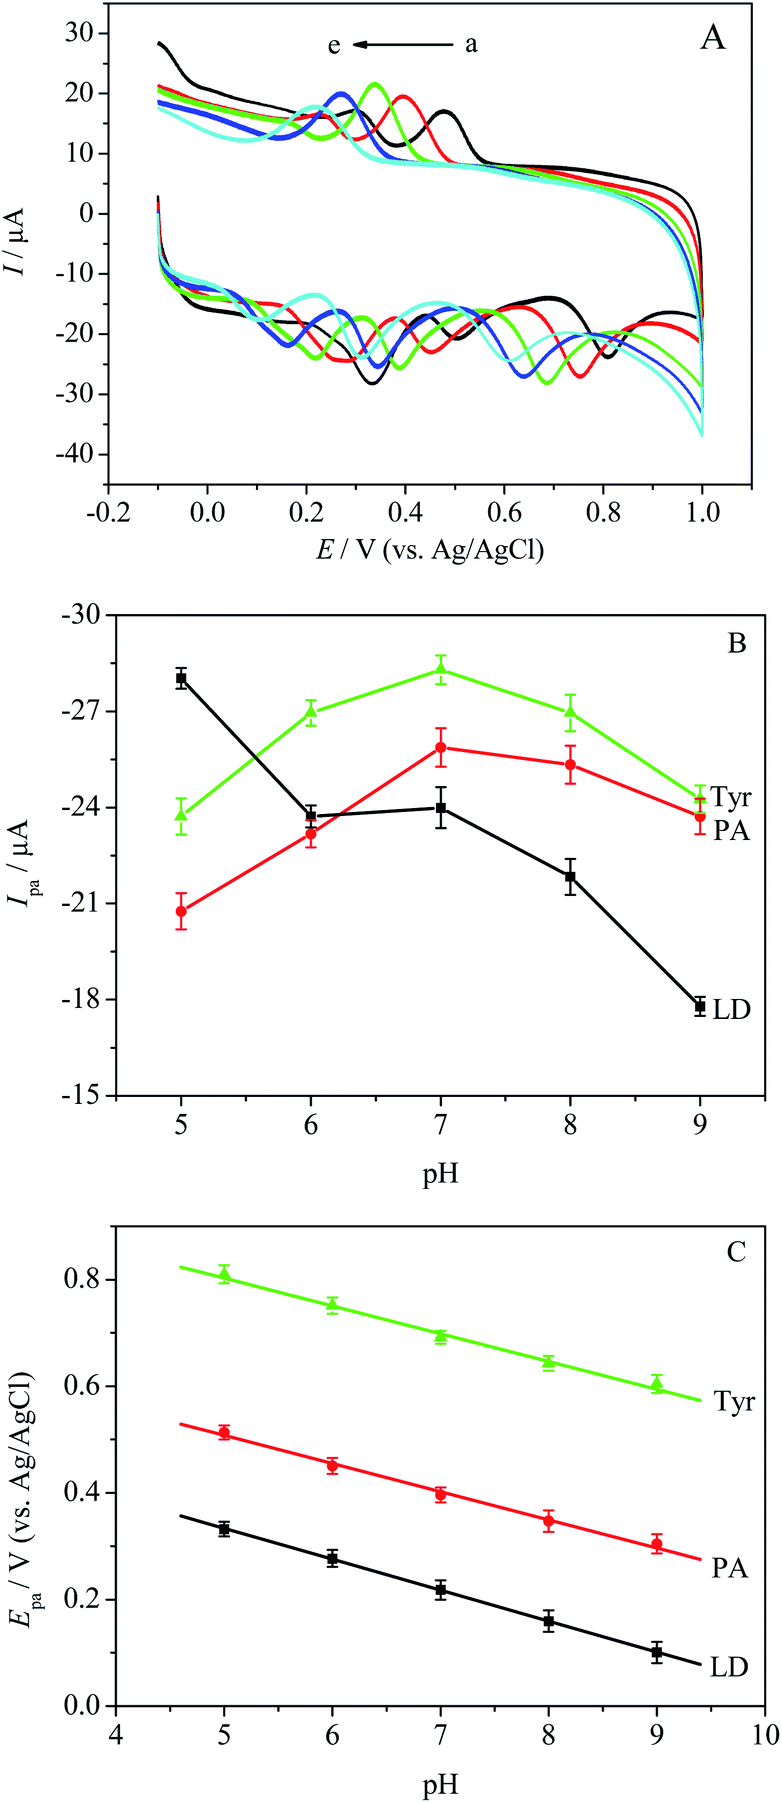
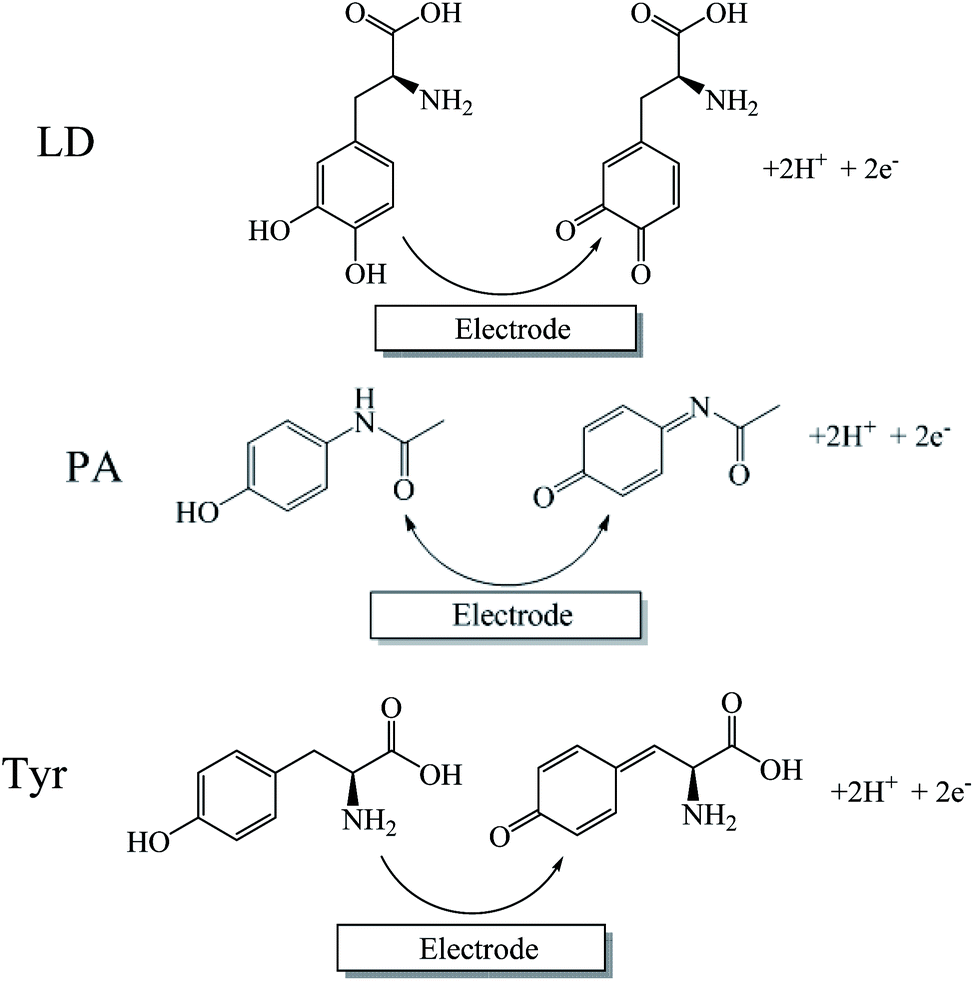
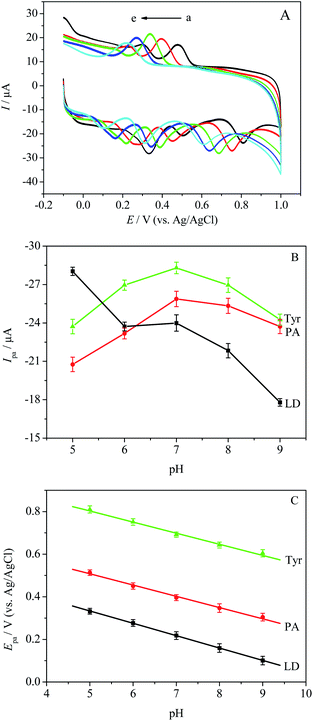
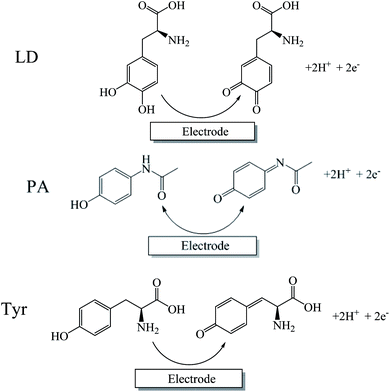
The influence of pH on the redox reactions of LD, PA and Tyr was studied by CV in 0.1 M PBS with different pH value, at a scan rate of 100 mV s−1. Fig. 4B reveals the variations of the oxidation currents with respect to pH. It is clearly shown that the oxidation currents of PA and Tyr peaked at pH 7.0, while the oxidation peak current of LD reduced gradually with pH from 5.0 to 9.0. Therefore, 0.1 M PBS (pH 7.0) was used in follow-up experiments. As shown in Fig. 4A, the increase of solution pH caused the negative shifts of the redox peak potentials of LD, PA and Tyr, which indicated the protons participating directly in the electrochemical reactions of LD, PA and Tyr. Fig. 4C shows the effect of pH on the oxidation peak potentials of LD, PA and Tyr. All the oxidation peak potentials of LD, PA and Tyr have the linear relationships with pH from 5.0 to 9.0 with the slopes of −58.0, −52.1 and −51.9 mV pH−1, respectively. All the slopes approach the theoretical value given by the Nernst equation (−59.2 mV pH−1) for equal number of electrons and protons involved reaction. With the reference of relevant literature,34,35 the electrochemical reactions of LD, PA and Tyr can be expressed as Scheme 1.
 |
| | Fig. 4 (A) Cyclic voltammograms of MWCNTs-Nafion/GCE in 0.1 M PBS containing 0.05 mM LD, 0.03 mM PA and 0.10 mM Tyr at different pHs: from a to e was 5.0, 6.0, 7.0, 8.0 and 9.0. Scan rate: 100 mV s−1. (B) Variations of the oxidation peak currents vs. pH. (C) Plot of oxidation peak potentials vs. pH. | |
 |
| | Scheme 1 The proposed electrochemical reaction mechanisms of LD, PA and Tyr. | |
Effect of scan rate
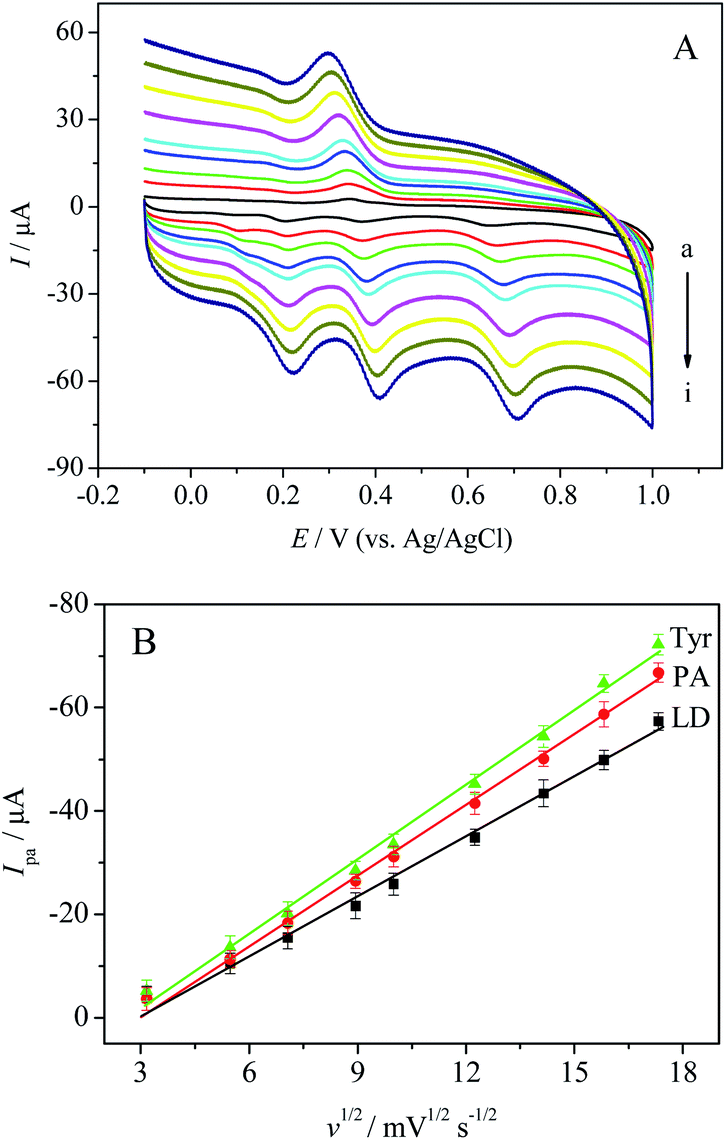
Furthermore, the influence of scan rate on the CVs of LD, PA and Tyr at MWCNTs-Nafion/GCE was explored in 0.1 M PBS. Fig. 5A shows the CVs in the mixture of 0.05 mM LD, 0.03 mM PA and 0.10 mM Tyr at different scan rates in the ranges of 10–300 mV s−1. It is obviously observed that all the oxidation peak currents of LD, PA and Tyr increased linearly with the square root of scan rate. The linear regression equations of LD, PA and Tyr are Ipa (μA) = 3.818v1/2 (mV s−1) – 10.735 (R = 0.9968), Ipa (μA) = 3.777 v1/2 (mV s−1) – 10.849 (R = 0.9984) and Ipa (μA) = 4.816v1/2 (mV s−1) – 12.884 (R = 0.9975), respectively. The results indicated that all the electrochemical reactions of LD, PA and Tyr were diffusion control processes.
 |
| | Fig. 5 (A) Cyclic voltammograms of MWCNTs-Nafion/GCE in 0.1 M PBS (pH 7.0) containing 0.05 mM LD, 0.03 mM PA and 0.10 mM Tyr at different scan rates (a–i: 10, 30, 50, 80, 100, 150, 200, 250, 300 mV s−1). (B) Plots of oxidation peak currents vs. the square root of scan rates for LD, PA and Tyr. | |
Individual detection of LD, PA and Tyr in ternary mixed solution
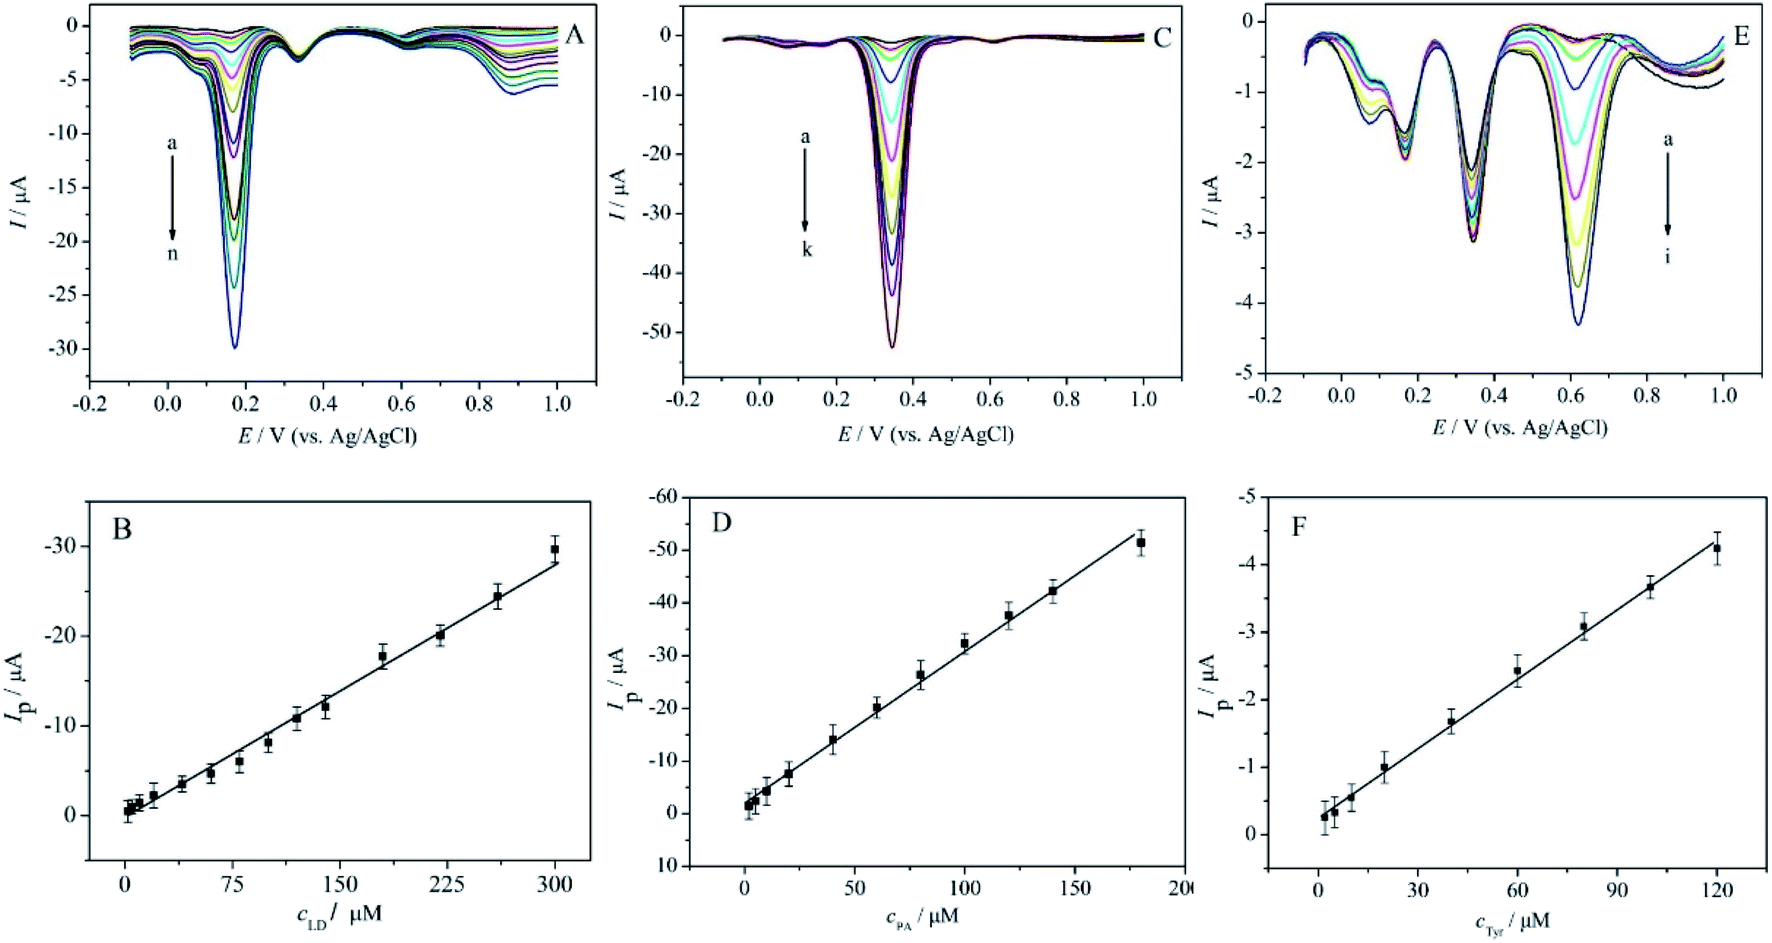
The individual detection of LD, PA or Tyr in their ternary mixed solution was investigated by differential pulse voltammetry (DPV) under optimized conditions. The DPV curves were recorded at MWCNTs-Nafion/GCE by changing one analyte's concentration, while those of other two analytes kept constant. Fig. 6A depicted that the oxidation peak currents of LD enhanced with its concentration in the range of 2.0 to 300.0 μM, while the oxidation peak currents of 0.01 mM PA and 0.01 mM Tyr kept nearly unchanged. The corresponding linear regression equation of LD was shown as Ipa (μA) = 0.0955cLD (μM) − 0.327 (R = 0.9959), and the detection limit was estimated to be 0.6 μM at a signal-to-noise of 3. As shown in Fig. 6C, fixing the concentrations of LD and Tyr constant (0.01 mM), the oxidation peak currents of PA increased linearly with its concentration. The linear relationship for determination of PA is from 2.0 to 180.0 μM, and the linear regression equation was Ipa (μA) = 0.2723cPA (μM) + 2.711 (R = 0.9976), with the detection limit of 0.5 μM. Similarly, Fig. 6E depicted the DPV responses of Tyr in the presence of 0.01 mM LD and 0.01 mM PA, which exhibited a linear relationship in concentration range of 2.0–120.0 μM, and its linear regression equation could be expressed as Ipa (μA) = 0.0344cTyr (μM) + 0.2456 (R = 0.9983), with the detection limit of 0.8 μM.
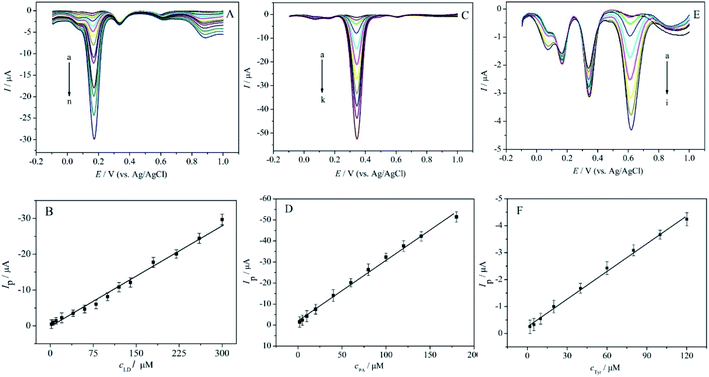 |
| | Fig. 6 Differential pulse voltammograms of MWCNTs-Nafion/GCE in 0.1 M PBS (pH 7.0) (A) in presence of 0.01 mM PA and 0.01 mM Tyr and different concentrations of LD (from a to n: 2.0–300.0 μM). (C) In presence of 0.01 mM LD and 0.01 mM Tyr and different concentrations of PA (from a to k: 2.0–180.0 μM). (E) In presence of 0.01 mM LD and 0.01 mM PA and different concentrations of Tyr (from a to k: 2.0–120.0 μM). (B, D and F) The calibration plots of the peak currents vs. concentrations of LD, PA and Tyr, respectively. | |
Table 1 showed the analytical performance comparison of MWCNTs-Nafion/GCE with some previous literatures for the determination of LD, PA and Tyr. As can be obtained from Table 1, the sensor fabricated in this work has better or comparable linear range and detection limit. Most important of all, MWCNTs-Nafion/GCE is a suitable sensor for the simultaneous determination of LD, PA and Tyr.
Table 1 Comparisons of major characteristics at the various modified electrodes for the determination of LD, PA and Tyr
| Modified electrode |
Analyst |
Linear range (μM) |
Detection limit (μM) |
Reference |
| Q/fMWCNT/MGCE |
LD |
0.9–85 |
0.38 |
34 |
| fMWCNT/GCE |
LD |
0.7–100 |
0.25 |
35 |
| AuNP-CMC-xGnP/GCE |
LD |
5–50 |
0.5 |
36 |
| MWCNTs-Nafion/GCE |
LD |
2–300 |
0.6 |
This work |
| fMWCNT/GCE |
PA |
1–90 |
0.52 |
35 |
| Lt/fMWCNT/MGCE |
PA |
0.9–80 |
0.78 |
37 |
| CNTPE |
PA |
5–92.6 |
0.57 |
38 |
| EFTA/CPE |
PA |
1–150 |
0.5 |
29 |
| MWCNTs-Nafion/GCE |
PA |
2–80 |
0.5 |
This work |
| TiO2-GR/GCE |
Tyr |
10–160 |
2.3 |
39 |
| AuNPs/poly (trisamine)/GCE |
Tyr |
3.9–61.8 |
0.9 |
40 |
| EFTA/CPE |
Tyr |
5–180 |
2 |
29 |
| AuNPs/MWCNT/GCE |
Tyr |
0.4–80 |
0.21 |
41 |
| MWCNTs-Nafion/GCE |
Tyr |
2–120 |
0.8 |
This work |
Simultaneous electrochemical determination of LD, PA and Tyr
The feasibility of MWCNTs-Nafion/GCE for the simultaneous determination of LD, PA and Tyr in ternary mixed solution was demonstrated by DPV. As can been seen in Fig. 7, when the concentration of LD, PA and Tyr increased simultaneously, their oxidation peak currents increased linearly with their concentrations. When the concentration was increased from 2.0 to 80.0 μM for LD, 2.0 to 18.0 μM for PA, and 2.0 to 140.0 μM for Tyr, the linear regression equations for LD, PA and Tyr are Ipa (μA) = 0.05394cLD (μM)+ 0.4845 (R = 0.9990), Ipa (μA) = 0.4200cPA (μM) − 0.1875 (R = 0.9995) and Ipa (μA) = 0.03643cTyr (μM) + 0.2788 (R = 0.9978), respectively. The results indicated that simultaneous determination of LD, PA and Tyr was feasible at MWCNTs-Nafion/GCE.
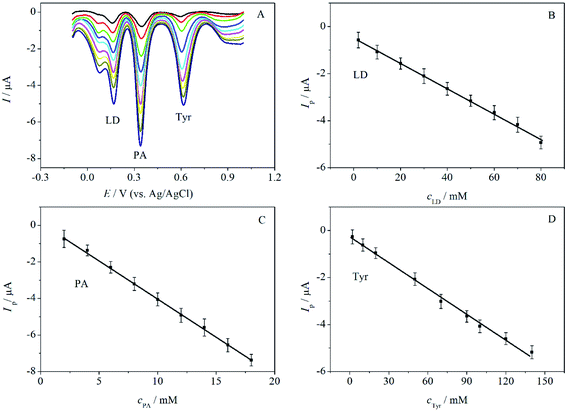 |
| | Fig. 7 (A) Differential pulse voltammograms of MWCNTs-Nafion/GCE in 0.1 M PBS (pH 7.0) containing different concentrations of LD (2.0–80.0 μM), PA (2.0–18.0 μM) and Tyr (2.0–140.0 μM). (B, C and D) The calibration plots of the peak currents vs. concentrations of LD, PA and Tyr, respectively. | |
Reproducibility, stability and interference studies
The reproducibility and stability of MWCNTs-Nafion/GCE were investigated by measuring the current responses in 0.1 M PBS containing 0.05 mM LD, 0.03 mM PA and 0.10 mM Tyr. The relative standard deviations of 10 successive measurements using the same modified electrode were 3.5% for LD, 3.0% for PA and 3.8% for Tyr. This indicated that the reproducibility of MWCNTs-Nafion/GCE was excellent. Meanwhile, five different glassy carbon electrodes modified by the proposed method were independently applied for simultaneous determination of LD, PA and Tyr. The relative standard deviations were 4.0%, 3.7% and 4.3% for LD, PA and Tyr, respectively. The results also indicated that the electrode-to-electrode reproducibility of MWCNTs-Nafion/GCE was good. In addition, when MWCNTs-Nafion/GCE was stored in a fridge at 4 °C for two weeks, it retained about 95.4%, 96.5% and 95.3% of the initial current of LD, PA and Tyr, respectively, indicating a relatively robust stability.
The ability to discriminate the analytes and interferents is a crucial indicator to evaluate the performance of sensor. In this work, the selectivity of MWCNTs-Nafion/GCE towards other species was investigated by DPV in 0.1 M PBS (pH 7.0) containing 0.01 mM LD, 0.005 mM PA and 0.03 mM Tyr. It was found that common inorganic ions such as 0.5 mM K+, Na+, Ca2+, Zn2+, Mg2+, NO3−, Cl−, SO42− and CO32− almost did not affect the responses of LD, PA and Tyr. The potential interferences existing in biological samples such as 0.3 mM glucose, lysine, histidine or arginine did not interfere significantly. Thus, the modified electrode has good selectivity for simultaneous determination of LD, PA and Tyr.
Real sample analysis
To prove the utility of MWCNTs-Nafion/GCE, the detection of LD, PA and Tyr were examined in human serum (diluted 50 times with 0.1 M pH 7.0 PBS) by the standard addition method. As shown in Table 2, the recoveries are 98.2% to 102.0%, 95.0% to 103.8%, and 95.3% to 104.6% for LD, PA and Tyr, respectively. These results demonstrate the feasibility of MWCNTs-Nafion/GCE in real sample analysis.
Table 2 Determination of LD, PA and Tyr in human serum by MWCNTs-Nafion/GCE (n = 5)
| |
Added (μM) |
Founded (μM) |
Recovery (%) |
RSD (%) |
| LD |
10.0 |
10.2 |
102.0 |
3.5 |
| 30.0 |
30.1 |
100.3 |
3.0 |
| 50.0 |
49.1 |
98.2 |
2.6 |
| PA |
10.0 |
9.5 |
95.0 |
3.0 |
| 30.0 |
29.5 |
98.3 |
2.7 |
| 50.0 |
51.9 |
103.8 |
3.2 |
| Tyr |
10.0 |
9.6 |
96.0 |
3.8 |
| 30.0 |
28.6 |
95.3 |
2.8 |
| 50.0 |
52.3 |
104.6 |
3.2 |
Conclusion
In summary, a novel electrochemical sensor was fabricated by drop casting multi-walled carbon nanotubes processed by ultrasonication and freeze-drying on the surface of glassy carbon electrode with Nafion as matrix. The modified electrode was used for simultaneous determination of LD, PA and Tyr. The preparation method is simple and low-cost. The fluffy and interconnected integrated structure of multi-walled carbon nanotubes provided an appropriate microenvironment for the electrochemical reaction of LD, PA and Tyr. The experimental results showed that the proposed modified electrode exhibited wide linear concentration range, high stability, good selectivity and reproducibility. The results of real sample analysis are satisfactory.
Conflicts of interest
There are no conflicts to declare.
Acknowledgements
This work was supported by the National Natural Science Foundation of China (No. 51909031), the Science and Technology Projects of Liaoning Province and the China Scholarship Council (201706085005).
Notes and references
- J. Hardy and K. Gwinn-Hardy, Science, 1998, 282, 1075 CrossRef CAS PubMed
 .
. - R. Katzenschlager and W. Poewe, Nat. Rev. Neurol., 2014, 10, 128 CrossRef CAS PubMed .
- M. Sadikovic, B. Nigovic, S. Juric and A. Mornar, J. Electroanal. Chem., 2014, 733, 60 CrossRef CAS .
- J. D. Chi, Y. H. Ling, R. Jenkins and F. M. Li, J. Chromatogr. B: Anal. Technol. Biomed. Life Sci., 2017, 1054, 1 CrossRef CAS PubMed .
- M. F. Abdel-Ghany, L. A. Hussein, M. F. Ayad and M. M. Youssef, Spectrochim. Acta, Part A, 2017, 171, 236 CrossRef CAS PubMed .
- S. Tajik, M. A. Taher and H. Beitollahi, Electroanalysis, 2014, 26, 796 CrossRef CAS .
- Y. Shoja, A. A. Rafati and J. Ghodsi, Mater. Sci. Eng. C, 2016, 58, 835 CrossRef CAS PubMed .
- H. Beitollahi and F. G. Nejad, Electroanalysis, 2016, 28, 2237 CrossRef CAS .
- J. Ghodsi, A. A. Rafati and Y. S. Ghodsi, Anal. Bioanal. Chem., 2016, 408, 3899 CrossRef CAS PubMed .
- M. G. Hosseini, M. Faraji, M. M. Momeni and S. Ershad, Microchim. Acta, 2011, 172, 103 CrossRef CAS .
- D. N. Bateman and A. Vale, Medicine, 2016, 44, 190 CrossRef .
- O. Skogar and J. Lokk, J. Multidiscip. Healthc., 2016, 9, 469 CrossRef PubMed .
- C. J. Locke, S. A. Fox, G. A. Caldwell and K. A. Caldwell, Neurosci. Lett., 2008, 439, 129 CrossRef CAS PubMed .
- T. Hložek, T. Křížek, P. Tůma, M. Bursová, P. Coufal and R. Čabala, J. Pharm. Biomed. Anal., 2017, 145, 616 CrossRef PubMed .
- V. Ohriac, D. Cimpoesu, A. F. Spac, P. Nedelea, V. Lazureanu, O. Suciu, T. O. Popa and E. Butnaru, Rev. Chim., 2018, 69, 627 CrossRef CAS .
- F. F. A. Aziz, A. A. Jalil, S. Triwahyono and M. Mohamed, Appl. Surf. Sci., 2018, 455, 84 CrossRef CAS .
- H. Beitollahi and S. Nekooei, Electroanalysis, 2016, 28, 645 CrossRef CAS .
- M. S. Ahmad, I. M. Isa, N. Hashim, S. M. Si and M. I. Saidin, J. Solid State Electrochem., 2018, 22, 2691 CrossRef CAS .
- P. Riederer, Nutr. Metab., 1980, 24, 417 CrossRef CAS PubMed .
- Á. Sánchez-Ferro, J. Benito-León and J. C. Gómez-Esteban, Front. Neurol., 2013, 4, 64 Search PubMed .
- L. A. Conlay, T. J. Maher and R. J. Wurtman, Brain Res., 1985, 333, 81 CrossRef CAS .
- M. Hinz, A. Stein and T. Uncini, Int. J. Gen. Med., 2011, 4, 165 CrossRef CAS PubMed .
- M. Miura and N. Takahashi, Drug Metab. Pharmacokinet., 2016, 31, 12 CrossRef CAS PubMed .
- T. Lapainis, C. Scanlan, S. S. Rubakhin and J. V. Sweedler, Anal. Bioanal. Chem., 2007, 387, 97 CrossRef CAS PubMed .
- Y. D. Lu, D. C. Lu, R. Y. You, J. L. Liu, L. Q. Huang, J. Q. Su and S. Y. Feng, Nanomaterials, 2018, 8, 400 CrossRef PubMed .
- R. Ramya, P. Muthukumaran and J. Wilson, Biosens. Bioelectron., 2018, 108, 53 CrossRef CAS PubMed .
- K. Varmira, G. Mohammadi, M. Mahmoudi, R. Khodarahmi, K. Rashidi, M. Hedayati, H. C. Goicoechea and A. R. Jalalvand, Talanta, 2018, 183, 1 CrossRef CAS PubMed .
- E. Molaakbari, A. Mostafavi, H. Beitollahi and R. Alizadeh, Analyst, 2014, 139, 4356 RSC .
- K. Movlaee, H. Beitollahi, M. Reza and P. Norouzi, Microchim. Acta, 2017, 184, 3281 CrossRef CAS .
- S. Iijima, Nature, 1991, 354, 56 CrossRef CAS .
- Z. Zhu, Nano-Micro Lett., 2017, 9, 25 CrossRef PubMed .
- Y. Y. Sun, Q. X. Ren, X. Liu, S. Zhao and Y. Qin, Biosens. Bioelectron., 2013, 39, 289 CrossRef CAS PubMed .
- H. Y. Sun, Z. Xu and C. Gao, Adv. Mater., 2013, 25, 2554 CrossRef CAS PubMed .
- J. B. Raoof, R. Ojani, M. Amiri-Aref and M. Baghayeri, Sens. Actuators, B, 2012, 166–167, 508 CrossRef CAS .
- M. Baghayeri and M. Namadchian, Electrochim. Acta, 2013, 108, 22 CrossRef CAS .
- T. R. Silva, A. Smaniotto and I. C. Vieira, J. Solid State Electrochem., 2018, 22, 1277 CrossRef CAS .
- M. Amiri-Aref, J. B. Raoof and R. Ojani, Sens. Actuators, B, 2014, 192, 634 CrossRef CAS .
- F. F. Hudari, E. H. Duarte, A. C. Pereira, L. H. D. Antonia, L. T. Kubota and C. R. T. Tarley, J. Electroanal. Chem., 2013, 696, 52 CrossRef CAS .
- Y. Fan, J. Liu, H. Lu and Q. Zhang, Microchim. Acta, 2011, 173, 241 CrossRef CAS .
- M. Taei and G. Ramazani, Colloids and Surfaces B: Biointerfaces, 2014, 123, 23 CrossRef CAS PubMed .
- T. Madrakian, E. Haghshenas and A. Afkhami, Sens. Actuators, B, 2014, 193, 451 CrossRef CAS .
|
| This journal is © The Royal Society of Chemistry 2020 |
Click here to see how this site uses Cookies. View our privacy policy here. 
 Open Access Article
 This Open Access Article is licensed under a Creative Commons Attribution-Non Commercial 3.0 Unported Licence
 *b and
Shuang Zhao
*b and
Shuang Zhao