 Open Access Article
Aggregation-induced enhanced emission-type cruciform luminophore constructed by carbazole exhibiting mechanical force-induced luminescent enhancement and chromism†
Defang Xu‡
a,
Ying Wang‡b,
Li Lic,
Hongke Zhoub and
Xingliang Liu *b
*b
aState Key Laboratory of Plateau Ecology and Agriculture, Qinghai University, Xining 810016, Qinghai, China
bSchool of Chemical Engineering, Qinghai University, Xining 810016, Qinghai, China. E-mail: liuxl1219@163.com
cState Key Laboratory of Inorganic Synthesis and Preparative Chemistry, Department of Chemistry, Jilin University, Changchun 130012, Jilin, China
First published on 24th March 2020
Abstract
One D–A type cruciform luminophore MDCS-BC based on carbazole has been prepared. We observed that this compound exhibits unique intramolecular charge-transfer (ICT) and typical aggregation-induced enhanced emission (AIEE) properties with the solid-state luminescence efficiency of 0.184. Moreover, this luminophore shows a significant stimuli-induced emission enhancement and chromism effect with good reversibility. Upon grinding, the fluorescence color of the as-prepared samples can change from blue (454 nm) to green (504 nm). What is unexpected is that the fluorescence efficiency of the initial powder is dramatically increased from 0.184 to 0.424 upon grinding. The results of PXRD, DSC and spectral properties studies show that the mechanical force-induced luminescence enhancement and chromism behavior of MDCS-BC originates from the transition between crystal and amorphous morphology, and the large red-shift and the emission enhancement inducing by grinding may be attributed to the planarization of the molecular conformation and subsequent planar ICT process.
Introduction
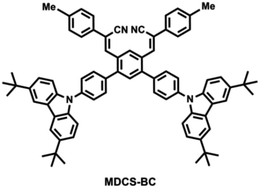
Recently, stimuli-responsive luminescent materials,1 which change their solid-state emission in color or in intensity in response to external stimuli, including light irradiation,2 heat treatment,3 acid/alkali vapor,4 and mechanical force,5 have been extensively investigated by researchers from both a fundamental and applied research perspective. Among them, mechanofluorochromic (MFC) materials are especially attractive because of their potential applications in the field of memory devices,6 sensors,7 safety ink5b,8 and optoelectronic devices.9 Generally, the evident MFC activity can be achieved in two ways. That is, solid-state chemical reaction and physical structural change. The former has some disadvantages, such as insufficient conversion, irreversible reaction, and loss of luminescence of reactants. The latter only involves the change of the morphology of aggregates, not the changes in molecular structures, and thus it is considered to be an effective way to obtain reversible solid-state emission. At present, many MFC materials, such as organic boron complexes,10,11 triphenylacrylonitrile,12 tetraphenylethene,13 3,6-bis(aryl)-1,4-diketo-pyrrolo[3,4-c]pyrroles (DPPs)14 and 9,10-divinylanthracene,15 have been designed and prepared. However, upon external force stimulation, most MFC materials show only significant changes in fluorescent color, while little change is observed in their fluorescence intensity. But for high-contrast luminescence recording, not only the obvious two-color luminescence switching, but also the dramatic switching in the luminescence intensity is required. Recently, a few MFC materials exhibiting dark–bright or bright–dark luminescence behavior have been reported.16 For example, Xu and co-workers reported a D–A type molecule acridonyl-tetraphenylethene with remarkable turn-on and color-tuned piezochromic luminescence.17 Tang and co-workers designed some diphenyldibenzofulvenes materials displaying crystallization-induced emission enhancement (CIEE) behavior and on–off emission under grinding.16d In addition, Tang reported a diaminomaleonitrile-functionalized Schiff base, which can form the defect-sensitive crystals with the mechanical force induced off–on emission.18 Although a lot of efforts have been made to the design and synthesis of MFC luminophores with excellent dark–bright or bright–dark luminescence, especially those with remarkable dark–bright switching, organic MFC materials that can be used for high-contrast luminescence recording are still extremely limited.Due to their unique molecule structures and fascinating optical properties, cruciform fluorophores are widely applied in organic light-emitting diodes (OLED),19 chemical sensors,4a,20 organic photovoltaic battery (OPV).21 For one cruciform, the frontier molecular orbitals (FMOs) can be distributed in different portions of the molecule through appropriate substitution in different axes, and thus it provides an opportunity to develop the novel compounds with evident intramolecular charge-transfer (ICT) effect. Meanwhile, the crowding in the central core forces the surrounding substituents to distort from the ring plane, which would result in effective depression of close packing and enhancement of solid-state luminescence efficiency. Many studies have shown that the fluorophores that possess ICT characteristics and twisted spatial conformation may exhibit AIE or AIEE and MFC properties.22 Recently, our group has reported some cruciform fluorophores that exhibited significant AIE characteristics and high contrast MFC behavior.23 In the current work, we design and prepare a novel twisted D–A cross-conjugated π-system MDCS-BC (Scheme 1), which contains two identical π-conjugated arms intersecting at the central benzene ring. The results indicate that MDCS-BC exhibits unique ICT properties and significant AIEE characteristics. Interestingly, under the stimulation of external force, this compound shows a significant change in fluorescence color accompanying by a significant enhancement in fluorescent intensity.
Results and discussion
Synthesis and characterizations
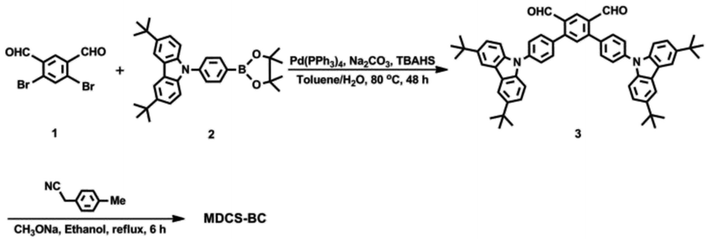
Scheme 2 shows the synthetic route for the target compound MDCS-BC. A typical Suzuki–Miyaura coupling reaction was carried out between compounds 1 and 2 in a mixture of toluene/H2O by using Pd(PPh3)4 as catalysis to obtain intermediate 3 in a yield of 72%. Then the cruciform luminophore MDCS-BC was gained via Knoevenagel condensation reaction in the presence of sodium methoxide with a high yield of up to 85%. Both the prepared intermediate and the target molecule were characterized by 1H and 13C NMR spectroscopy, HRMS and element analyses (C, H and N).Optical properties in solutions
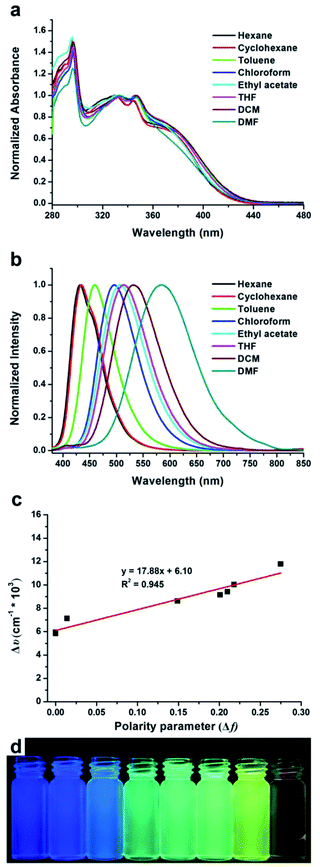
It is known that a conjugated system involving electron donating and withdrawing groups might facilitate the occurrence of intramolecular charge transfer (ICT). For MDCS-BC, carbazole and cyano groups are typical electron donor and electron acceptor, respectively, and thus it should show obvious ICT behavior. This intriguing performance could be investigated by UV-vis absorption and PL spectra in solvents with different polarities. Fig. 1 shows the UV-vis absorption and PL spectra, and the obtained data are presented in Table 1. As shown in Fig. 1a, we can observe that MDCS-BC has four absorption bands. The ones at about 295 nm, 330 nm and 345 nm are attributed to the π–π* transition, while the absorption bands near 375 nm, which are weaker than the π–π* transition ones, come from the charge-transfer (CT) transitions due to the presence of the strong donor (the carbazole unit) and the strong acceptor (the cyano-containing dicyanodistyrylbenzene moiety) in the molecule.22a,23c In general, the modification of electron donor and/or acceptor groups to a fluorogen can not only endow it with ICT properties, but also make it have significant solvatochromic effect. PL spectra test results illustrate that MDCS-BC displays pronounced solvatochromic performance. As shown in Fig. 1b, MDCS-BC reveals significant bathochromic shift of emission profiles when the solvents are changed from low polarity hexane and cyclohexane to moderate polarity THF and then to high polarity DMF. For example, in non-polar hexane, the maximum emission peak centers at 432 nm, then it red-shifts to 584 nm in highly polar DMF. Accordingly, the Stokes shifts increase from 5837 cm−1 in hexane to 11![[thin space (1/6-em)]](https://www.rsc.org/images/entities/char_2009.gif) 778 cm−1 in DMF (Table 1), accompanying by the broadening of emission band. Those results portray MDCS-BC exhibiting strong ICT process after photo-excitation.23 In addition, we can notice the presence of the structured peak in non-polar solvents, such as hexane and cyclohexane, which indicates two separated close-lying excited states. We believe that the excited state contributing to the emissions in hexane and cyclohexane are the LE (locally excited) ones.24 When the polarity of the solvent increases, the emission band becomes structureless and exhibits a solvatochromic red-shift because of the dipole–dipole interactions between the solute and solvents. In order to further understand the capability of ICT of MDCS-BC, we can use Lippert–Mataga equation25 to further quantitatively describe its solvatochromic behavior. The Stokes shifts (Δν) of MDCS-BC in varying solvents are calculated and listed in Table 1. Fig. 1c showed the plots of Δυ–Δf, we can find that the slope of the fitting line for MDCS-BC reached 17
778 cm−1 in DMF (Table 1), accompanying by the broadening of emission band. Those results portray MDCS-BC exhibiting strong ICT process after photo-excitation.23 In addition, we can notice the presence of the structured peak in non-polar solvents, such as hexane and cyclohexane, which indicates two separated close-lying excited states. We believe that the excited state contributing to the emissions in hexane and cyclohexane are the LE (locally excited) ones.24 When the polarity of the solvent increases, the emission band becomes structureless and exhibits a solvatochromic red-shift because of the dipole–dipole interactions between the solute and solvents. In order to further understand the capability of ICT of MDCS-BC, we can use Lippert–Mataga equation25 to further quantitatively describe its solvatochromic behavior. The Stokes shifts (Δν) of MDCS-BC in varying solvents are calculated and listed in Table 1. Fig. 1c showed the plots of Δυ–Δf, we can find that the slope of the fitting line for MDCS-BC reached 17![[thin space (1/6-em)]](https://www.rsc.org/images/entities/char_2009.gif) 880 cm−1, which exhibits its significant solvatochromism effect. Fig. 1d displays the fluorescence color of MDCS-BC in different solvents. In the non-polar solvents hexane and cyclohexane, MDCS-BC emits blue fluorescence, then it gradually changes to green and yellow in moderately polar ethyl acetate and THF, respectively, and finally orange emission is observed in highly polar DMF. By using quinine sulfate (Φf = 0.546, 0.5 mol L−1 H2SO4) as a standard, we measured the photoluminescence quantum yield (ΦPL) of MDCS-BC in different solvents (Table 1). From hexane, cyclohexane, toluene, chloroform, ethyl acetate to THF, the ΦPL increases from 0.06 to 0.099, indicating a negative solvent kinetic effect.24b Then it decreases to 0.018 in DMF, a positive solvent kinetic effect is observed.26 We believe that the much smaller ΦPL in more polar solvents may be due to the non-radiative decay. This because the strong ICT process and active intramolecular rotation of multiple benzene rings just facilitate the nonradiative pathways.
880 cm−1, which exhibits its significant solvatochromism effect. Fig. 1d displays the fluorescence color of MDCS-BC in different solvents. In the non-polar solvents hexane and cyclohexane, MDCS-BC emits blue fluorescence, then it gradually changes to green and yellow in moderately polar ethyl acetate and THF, respectively, and finally orange emission is observed in highly polar DMF. By using quinine sulfate (Φf = 0.546, 0.5 mol L−1 H2SO4) as a standard, we measured the photoluminescence quantum yield (ΦPL) of MDCS-BC in different solvents (Table 1). From hexane, cyclohexane, toluene, chloroform, ethyl acetate to THF, the ΦPL increases from 0.06 to 0.099, indicating a negative solvent kinetic effect.24b Then it decreases to 0.018 in DMF, a positive solvent kinetic effect is observed.26 We believe that the much smaller ΦPL in more polar solvents may be due to the non-radiative decay. This because the strong ICT process and active intramolecular rotation of multiple benzene rings just facilitate the nonradiative pathways.
| Solvent | Δf | λabs/nm (ε/M−1 cm−1) | λem/nm | Δνsta/cm−1 | Φfb |
|---|---|---|---|---|---|
| a Δνst = νabs − νem.b The fluorescence quantum yield (Φf) was measured using quinine sulfate as a standard (Φf = 0.546 in 0.5 mol L−1 H2SO4). | |||||
| Hexane | ∼0 | 296 (71![[thin space (1/6-em)]](https://www.rsc.org/images/entities/char_2009.gif) 800), 330 (48 800), 330 (48![[thin space (1/6-em)]](https://www.rsc.org/images/entities/char_2009.gif) 200), 345 (45 200), 345 (45![[thin space (1/6-em)]](https://www.rsc.org/images/entities/char_2009.gif) 800) 800) |
432 | 5837 | 0.060 |
| Cyclohexane | ∼0 | 296 (67![[thin space (1/6-em)]](https://www.rsc.org/images/entities/char_2009.gif) 400), 330 (44 400), 330 (44![[thin space (1/6-em)]](https://www.rsc.org/images/entities/char_2009.gif) 600), 345 (42 600), 345 (42![[thin space (1/6-em)]](https://www.rsc.org/images/entities/char_2009.gif) 500) 500) |
434 | 5944 | 0.072 |
| Toluene | 0.014 | 297 (62![[thin space (1/6-em)]](https://www.rsc.org/images/entities/char_2009.gif) 000), 333 (43 000), 333 (43![[thin space (1/6-em)]](https://www.rsc.org/images/entities/char_2009.gif) 200), 346 (42 200), 346 (42![[thin space (1/6-em)]](https://www.rsc.org/images/entities/char_2009.gif) 500) 500) |
459 | 7115 | 0.077 |
| Chloroform | 0.149 | 297 (61![[thin space (1/6-em)]](https://www.rsc.org/images/entities/char_2009.gif) 800), 333 (43 800), 333 (43![[thin space (1/6-em)]](https://www.rsc.org/images/entities/char_2009.gif) 800), 347 (43 800), 347 (43![[thin space (1/6-em)]](https://www.rsc.org/images/entities/char_2009.gif) 100) 100) |
495 | 8616 | 0.077 |
| Ethyl acetate | 0.201 | 296 (70![[thin space (1/6-em)]](https://www.rsc.org/images/entities/char_2009.gif) 100), 332 (45 100), 332 (45![[thin space (1/6-em)]](https://www.rsc.org/images/entities/char_2009.gif) 600), 346 (45 600), 346 (45![[thin space (1/6-em)]](https://www.rsc.org/images/entities/char_2009.gif) 400) 400) |
506 | 9139 | 0.090 |
| THF | 0.210 | 296 (60![[thin space (1/6-em)]](https://www.rsc.org/images/entities/char_2009.gif) 000), 334 (41 000), 334 (41![[thin space (1/6-em)]](https://www.rsc.org/images/entities/char_2009.gif) 000), 346 (41 000), 346 (41![[thin space (1/6-em)]](https://www.rsc.org/images/entities/char_2009.gif) 800) 800) |
513 | 9409 | 0.099 |
| DCM | 0.218 | 297 (65![[thin space (1/6-em)]](https://www.rsc.org/images/entities/char_2009.gif) 400), 333 (43 400), 333 (43![[thin space (1/6-em)]](https://www.rsc.org/images/entities/char_2009.gif) 500), 347 (43 500), 347 (43![[thin space (1/6-em)]](https://www.rsc.org/images/entities/char_2009.gif) 700) 700) |
532 | 10![[thin space (1/6-em)]](https://www.rsc.org/images/entities/char_2009.gif) 021 021 |
0.083 |
| DMF | 0.275 | 296 (64![[thin space (1/6-em)]](https://www.rsc.org/images/entities/char_2009.gif) 700), 333 (51 700), 333 (51![[thin space (1/6-em)]](https://www.rsc.org/images/entities/char_2009.gif) 800), 346 (51 800), 346 (51![[thin space (1/6-em)]](https://www.rsc.org/images/entities/char_2009.gif) 200) 200) |
584 | 11![[thin space (1/6-em)]](https://www.rsc.org/images/entities/char_2009.gif) 778 778 |
0.018 |
The electrochemical properties of MDCS-BC were examined using cyclic voltammetry, the results of electrochemical measurements were summarized in Table S1.† As shown in Fig. S1,† MDCS-BC exhibits one reversible oxidation process and the oxidation potentials (Eox) is 1.15 V, its HOMO energy level is extracted through comparison with an external reference (Fc/Fc+). The Eg for the species is estimated from the onset of the absorption spectra in the same solvent with electrochemical experiment, and the results of HOMO energy and Eg provide the estimation of LUMO energy for MDCS-BC. As a result, the HOMO energy level of MDCS-BC is −5.49 eV, and the LUMO energy level is −2.57 eV. For better insight into the observed the photophysical properties of MDCS-BC, the density functional theory (DFT) calculations was performed with the Gaussian 09W package. The geometry of MDCS-BC was optimized at the B3LYP/6-31G(d,p) level. From Fig. 2, we can clearly find that the electron density in the HOMO of cruciform MDCS-BC is mainly distributed over the donor carbazole unit, whereas the electron density in the LUMO is concentrated on the acceptor dicyanodistyrylbenzene moiety. Therefore, the spatially separated frontier molecular orbitals (FMOs) in MDCS-BC are obtained, and thus an effective excited-state ICT from the donor carbazole unit to the acceptor dicyanodistyrylbenzene fragment is suggested. The above conclusion is in accordance with the results of measured photophysical properties. In addition, the calculations reveal that the dihedral angles between the four surrounding substituents and the central core (θ1, θ2, θ3 and θ4) are 33.2°, 47.0°, 48.9° and 32.3°, respectively. We believe that the reason for the large torsional angles in MDCS-BC molecules is below: there are four huge substituents around the central benzene ring. The large steric hindrance between these groups will force them to deviate from the plane of the central benzene ring. Therefore, MDCS-BC possesses a highly distorted spatial conformation, which can effectively inhibit the close packing and strong π–π interaction between molecules, resulting in the relative loose structure arrangement in the crystal state and the enhancement of luminous efficiency in the solid state. The structural characteristics of MDCS-BC described above may endow it with effective solid-state emission, AIE behavior and MFC activity.
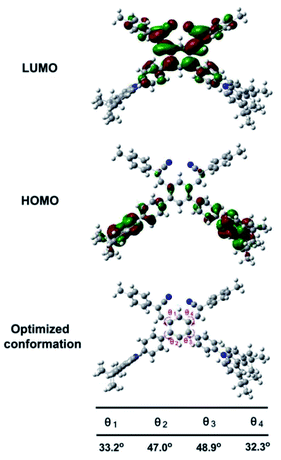 | ||
| Fig. 2 Calculated spatial electron distributions of LUMO and HOMO, and the optimized conformation structures of MDCS-BC calculated by DFT in Gaussian 09 at the B3LYP/6-31G(d,p) level. | ||
Aggregation-induced enhanced emission (AIEE) properties
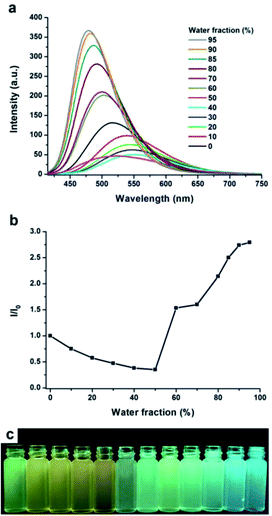
Carbazole is a very famous substituent group and chromophore with planar conjugate structure, which is an important building unit for AIE materials, and thus many AIE or AIEE molecules constructed by carbazole have been reported in previous studies owing to their simple preparation process and excellent AIE or AIEE performance.27 Moreover, we can observe that the as-prepared MDCS-BC powders exhibit intense blue light (ΦPL = 0.184) under the irradiation of 365 nm UV light, which is higher than that in the diluted THF solution (ΦPL = 0.099). Based on the above phenomena, we speculate that MDCS-BC has AIEE behavior. In order to further prove the AIEE nature of MDCS-BC, we measured the absorption and PL spectra in dilution mixtures of THF–water with different water fractions (fw). Water and THF are selected because for MDCS-BC, water is nonsolvent and THF is good solvent. Therefore, increasing the content of water in the mixed system will change the existing form of MDCS-BC from a homogeneous monodisperse solution state in THF to aggregated particles in the mixtures with high water contents, which will lead to the changes of absorption and PL spectra. The absorption spectra of MDCS-BC in THF–water mixtures are shown in Fig. 3. The absorption bands remain unchanged when the fw values below 40% but begin to change significantly afterwards. The entire absorption band starts to increase, indicating the formation of nano-aggregates, which can be characterized by dynamic light scattering (DLS) measurement (Fig. S2, ESI†). The obvious absorbance difference and levelling-off tail in the visible region of the UV absorption spectra along with the increase of water fraction may be because of the light scattering, or Mie effect, of the nanoaggregate suspensions in the solvent mixtures, which could effectively decrease the light transmission of the mixture.13b,23d Fig. 4 shows the PL spectra and the change in fluorescence intensity of MDCS-BC in various THF–water mixtures, the remarkable emission enhancement is observed with the increasing the water content in water–THF mixtures, which directly reveals that this compound possesses typical AIEE properties. In dilute THF solution, MDCS-BC could emit the light green fluorescence and the maximum peak locates at 524 nm. The emission intensities shows not only a continuous decreasing trend but the significant red-shift when the water fraction is in the range 0–40%. We can infer that this phenomenon can be explained in this way: water is a solvent with high polarity, so increasing the content of water in the water–THF mixture will increase its polarity. Therefore, when the mixture contain an appropriate amount of water (fw < 50%), at which the dissolving capacity of the mixtures is enough to dissolve the solute MDCS-BC molecules, the strong ICT effect of MDCS-BC in polar solvent leads to the red shift in PL spectra and the quenching of fluorescence. Then the mixture exhibits a dramatic enhancement in fluorescence intensity when the value of fw rises to 50%. This is because the water content in the mixture is so large that its solubility is too small to dissolve MDCS-BC molecules, leading to the aggregation due to the interaction between molecules. As the water content of the solution further increases sequentially, the emission intensity increases steadily, indicating a large enhancement compared to that in pure THF solution. The above phenomena fully show that MDCS-BC has significant AIEE activity. It should be noted that the emission bands of the mixtures show the blue-shift when the fw ≥ 50%. We infer that in the process of aggregation from homogeneous monodisperse solution, the molecules are separated from the polar environment and locate in the non-polar environment due to being wrapped in nanoparticles, and thus the ICT process is inhibited. In other words, in this process, the radiationless relaxation channel is restricted and the radiative decay pathway is opened, thereby the emission band recovers and the intensity is increasing. When the value of fw reaches 95%, the emission intensity reached the maximum, which is about 2.5 times higher in comparison with that at fw = 0%. In the meantime, the maximum emission peak of MDCS-BC blue-shifts to 479 nm and the bright blue fluorescence could be observed for the aggregates. Fig. 4c displays the fluorescent images of MDCS-BC in the solvent mixtures from fw = 0% to 95%, which presents us a clear view demonstrating the AIEE effect.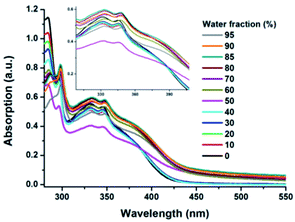 | ||
| Fig. 3 UV-vis absorption spectra of MDCS-BC in THF and THF–water aqueous mixtures with different fw. | ||
Mechanofluorochromic (MFC) properties
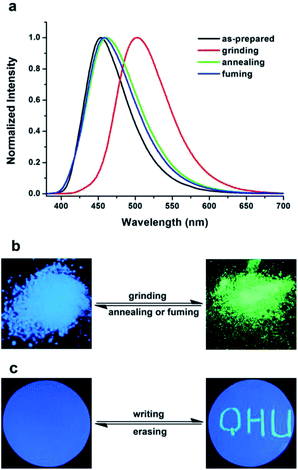
Combined with the highly distorted molecular conformations, the obvious ICT characteristic and AIE or AIEE behavior, we suggest that MDCS-BC may display mechanochromic luminescence. In order to prove above inference, the PL spectrum test was carried out for MDCS-BC solid samples under different conditions (preparation, grinding, annealing and fuming). The fluorescence response of MDCS-BC powder towards to the grinding–fuming or grinding–annealing processes are shown in Fig. 5. Under the excitation of 365 nm UV light, the as-prepared solid powder of MDCS-BC exhibits a blue light peaking at 454 nm with a ΦPL as 0.184. Interestingly, as shown in Fig. 5b, when the as-prepared solid powder is ground by using a mortar and pestle, its fluorescent color turns green with a maximum emission peak at 504 nm accompanied by a significant enhancement in emission intensity with a ΦPL as high as 0.424. This means that the grinding treatment not only causes the red shift of PL spectrum by 50 nm compared to that of the initial powder, but also increases the ΦPL to 2.3 times, thereby indicating that MDCS-BC exhibiting significant mechanical force-induced luminescent enhancement and chromism characteristics. Normally, reversible change of fluorescence color and emission wavelength is an important criterion to evaluate the performance of MFC materials. And thus the reversibility of MFC behavior of MDCS-BC is checked. We first treated the ground MDCS-BC samples by heat treatment. When the ground sample is annealed at 230 °C for 5 min and then naturally cool to room temperature, the fluorescence color and emission band of ground powder could revert to the state that similar to the original sample (Fig. 5a and b), which prove that the MFC process is reversible. Moreover, like most MFC materials reported previously, MDCS-BC shows good reversibility under the fuming treatment by DCM vapor. When the ground solid powder is exposed to DCM vapor for 2 min at room temperature, the fluorescence color and emission band like initial powder can also be obtained. The above color conversion process between blue and green can be repeated many times without obvious fatigue by grinding–fuming or grinding–heating treatment. This result indicates excellent reversibility of MFC behavior of MDCS-BC (Fig. S3 and S4, ESI†).In addition, as shown in Fig. 5c, as writing “QHU” with a metal spatula on the filter paper that covers with the as-prepared powder of MDCS-BC, from which we can see that the written area is bright green while the unwritten part is blue under a UV light. This “dark” to “bright” conversion is very obvious, which can be easily identified by the naked eye, and this change only occurs at the grinding area, further indicating the high-contrast luminescence switching. Moreover, the “QHU” could be erased after the filter paper was exposed to DCM vapor, and then the entire filter paper turned blue, thereby further revealing the reversibility MFC behavior of the MDCS-BC. This result suggests that MDCS-BC has the potential for application as optical recording material.
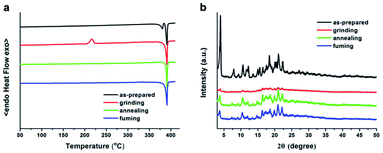
In order to clarify the MFC mechanism of cruciform MDCS-BC, the differential scanning calorimetry (DSC) and powder X-ray diffraction (PXRD) measurements on samples at different solid states (as-prepared, grinding, annealing and fuming) were performed. As shown in Fig. 6a, the results from DSC test show that the as-prepared powder displays an endothermic peak at 390 °C, corresponding to the melting point. Upon grinding, besides the endothermic peak of melting point at 390 °C a new exothermic peak appear at 215 °C that corresponds to the cold crystal transition peak of the amorphized MDCS-BC is observed. Furthermore, when the ground sample is annealed at 230 °C for 5 min or fumed with DCM vapor for 2 min, the cold crystallization peak disappears, and the DSC curve returns to that almost the same shape as the as-prepared sample. The DSC test results showed that in the ground sample there is a metastable aggregation structure that would transfer to the more-stable state existing in the ground sample, and then it can return to the initial stable crystal state through endothermic crystallization process under the heating condition. Fig. 6b shows PXRD patterns of MDCS-BC solid powders under different condition. From the diffraction pattern of the as-prepared MDCS-BC powder, we can observe a number of sharp and intense diffraction peaks, indicating that there is a regular crystal aggregation structure existing in the initial samples. However, when the as-prepared samples are ground, most diffraction peaks disappear, although there are still some resolvable peaks, which are consistent with those of the as-prepared sample, they show weaker intensity and broader shapes. This result shows that the well-ordered crystalline structures of the initial sample are destroyed by grinding treatment and randomized to disordered molecular packing or amorphous states. After being annealed or fumed with DCM vapor, the sharp and intense peaks in the XRD pattern that are similar with those of the as-prepared powder are recovered, manifesting that the ground sample recrystallizes into microcrystalline through molecular repacking during the thermal or fuming process. The DSC and XRD data thus attest that the reversible MFC behavior of MDCS-BC is indeed associated with the morphology transformations between the crystalline and amorphous phases.
To obtain further information on fluorescence behavior of MDCS-BC under different states, time-resolved fluorescence spectra were measured. The time-resolved fluorescence curves were shown in Fig. 7, and the lifetime data were collected in Table 2. From the Table 1, we could find that there are three relaxation pathways for the as-prepared powder and two relaxation pathways for ground powder in the fluorescence decays, and different pathways played different predominant roles. For example, the excited molecules of the as-prepared powder mainly decays through the second pathway (A2 = 0.61), however, for the ground sample, the excited molecules mainly decays through the first pathway (A1 = 0.62), exhibiting an obvious difference. The above results indicate that the time-resolved PL spectra of MDCS-BC samples before and after grinding include independent emissions from the segments with different π-conjugation lengths because multiple lifetimes were detected. The weighted mean lifetimes 〈τ〉 of the as-prepared powder of MDCS-BC is 4.06 ns, after grinding, it increases to 7.31 ns, which indicates that the MDCS-BC molecule in the as-prepared solids possesses the shorter lifetimes than that in the ground solids.22a The change in 〈τ〉 is caused by a change of aggregation structure after grinding.13b
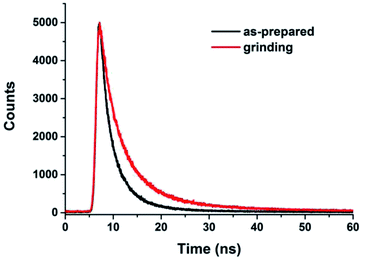 | ||
| Fig. 7 Time-resolved emission-decay curves of MDCS-BC in different solid-states: as-prepared and grinding. | ||
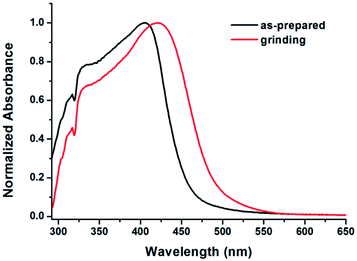
Generally, the destruction of the crystalline structure leads to the planarization of the molecular conformation due to the release of the twist strain, which increases the molecular conjugation, and thus results in the red-shift in the PL spectrum. In the case of MDCS-BC, we believe the reason for the red-shift in emission wavelength and the significant enhancement in emission intensity after grinding is below: in the crystalline state, the luminogens may adopt a more twisted conformation in order to fit into the crystalline lattice. Thus, the as-prepared powder exhibits a weak luminescence. When it is amorphized by mechanical force, the molecular structure slightly turns planar, which increases the effective intramolecular conjugation,22a,23 and thus the ICT process would enhance and the non-radiative deactivation pathways would be significantly blocked. This proposal could be confirmed by the UV-visible absorption spectra of the as-prepared and ground samples of MDCS-BC. As shown in Fig. 8, the maximum absorption peak of the as-prepared sample localizes at 406 nm, after grinding, it red-shifts to 421 nm, indicating the extension of π-conjugation.28 Therefore, the planarization of the molecular conformation and the subsequent planar ICT should be responsible for the red-shift in the PL spectrum and the enhanced fluorescence of MDCS-BC after grinding.
Conclusions
In summary, we have designed and synthesized a cruciform luminophore MDCS-BC with a highly distorted structure and studied its photophysical properties from the perspective of electron and space effects. This D–A type molecule exhibits a unique ICT emission upon excitation. Moreover, MDCS-BC possesses significant AIEE characteristics with solid-state luminescence efficiency of 0.184. Importantly, MDCS-BC displays high contrast MFC behavior. Under external force, the fluorescent color of the samples changes from initial bright blue to final green with a red-shift of 50 nm and its emission intensity increases dramatically with a ΦPL as high as 0.424, which is 2.3 times compared to that of initial powder. Combined with the DSC and PXRD data, the fluorescence “bright” and “dark” states of luminophore MDCS-BC correspond to the amorphous state and the crystalline state, respectively. In the crystalline state, the luminogens adopted a more twisted conformation and exhibits weak emission. While in the amorphous state the dye molecules might relax to a more planar conformation and then emit a strong fluorescence with a large red-shift in emission wavelength. This molecular design strategy would open up a new path for the development of efficient mechanically responsive organic luminescent materials with high contrast.Experimental
Materials and measurements
The NMR spectra were recorded on a Bruker-Avance III (1H: 400 MHz, 13C: 100 MHz) spectrometer, and samples were measured in CDCl3 by using tetramethylsilane (TMS) as an internal standard. HRMS was recorded on a MALDI-TOF MS Performance instrument (Shimadzu, Japan). Elemental analyses (C, H, and N) were performed by using a PerkinElmer 240C elemental analyzer. The UV/vis spectra were recorded on a Shimadzu UV-2550 spectrophotometer. PL spectra were determined on a Cary Eclipse Fluorescence Spectrophotometer. Edinburgh FLS920 steady state spectrometer was used to obtain the absolute solid ΦPL by using the integrating sphere. PXRD patterns were recorded on a Bruker D8 Focus Powder X-ray diffraction instrument with CuKα radiation (λ = 1.5406 Å) in θ/2θ mode. Cyclic voltammetry was performed at room temperature in a three electrode cell by using a Metrohm Autolab PGSTAT204 Electrochemical Workstation with a scan rate at 50 mV s−1. The working electrode was a glassy carbon, the counter electrode was a platinum wire, and Ag/Ag+ was used as reference electrode. Tetrabutylammonium hexafluorophosphate was used as the supporting electrolyte in dry DCM (0.1 mol L−1). DLS measurements were conducted on the BI-200SM Laser Light Scattering System (Brookhaven).For the AIEE measurement, first, a stock solution of MDCS-BC sample in THF (1.0 × 10⁻³ M) was prepared. Then, aliquots of this stock solution were transferred into volumetric flasks (10 mL). Finally, appropriate volumes of THF and water were added into the above volumetric flasks dropwise under vigorous stirring to give 1.0 × 10⁻⁵ M solutions with different water contents. After the solutions were prepared, UV and PL spectra were measured immediately.
MFC and recovering experiments. Grinding experiment: the as-prepared MDCS-BC powders were put in a mortar and then ground by using a metal spatula. Annealing experiment: the ground MDCS-BC sample was placed into a hot-stage with an automatic temperature-control system and stood for 5 min. DCM-fuming experiment: at room temperature, the ground sample was suspended above the solvent level in a sealed DCM-containing beaker, and then exposed for 2 min.
Synthesis and characterization
Ethanol was distilled under normal pressure from sodium under nitrogen prior to use. All other reagents and chemicals were purchased commercially, and were used without any purification. Compound 2 was synthesized by following a procedure reported in the literature.23c![[thin space (1/6-em)]](https://www.rsc.org/images/entities/char_2009.gif) :
:![[thin space (1/6-em)]](https://www.rsc.org/images/entities/char_2009.gif) 1 by volume) as eluent, affording a light yellow solid (7.24 g, 72% yield). 1H NMR (400 MHz, CDCl3) δ 10.29 (s, 2H), 8.80 (s, 1H), 8.19 (s, 4H), 7.83–7.73 (m, 9H), 7.54–7.47 (m, 8H), 1.50 (s, 36H) (Fig. S5†); 13C NMR (100 MHz, CDCl3) δ 190.81, 148.79, 143.46, 139.28, 138.84, 134.82, 133.64, 133.22, 131.35, 129.06, 126.62, 123.81, 123.74, 116.44, 109.14, 77.33, 77.01, 76.69, 34.79, 32.00 (Fig. S6†); HRMS (MALDI-TOF) m/z: [M]+ calcd for C60H60N2O2 840.4655; found 840.4646 (Fig. S7†). Anal. calcd (%) for C60H60N2O2: C 85.68, H 7.19, N 3.33; found: C 85.51, H 7.31, N 3.41.
1 by volume) as eluent, affording a light yellow solid (7.24 g, 72% yield). 1H NMR (400 MHz, CDCl3) δ 10.29 (s, 2H), 8.80 (s, 1H), 8.19 (s, 4H), 7.83–7.73 (m, 9H), 7.54–7.47 (m, 8H), 1.50 (s, 36H) (Fig. S5†); 13C NMR (100 MHz, CDCl3) δ 190.81, 148.79, 143.46, 139.28, 138.84, 134.82, 133.64, 133.22, 131.35, 129.06, 126.62, 123.81, 123.74, 116.44, 109.14, 77.33, 77.01, 76.69, 34.79, 32.00 (Fig. S6†); HRMS (MALDI-TOF) m/z: [M]+ calcd for C60H60N2O2 840.4655; found 840.4646 (Fig. S7†). Anal. calcd (%) for C60H60N2O2: C 85.68, H 7.19, N 3.33; found: C 85.51, H 7.31, N 3.41.![[thin space (1/6-em)]](https://www.rsc.org/images/entities/char_2009.gif) :
:![[thin space (1/6-em)]](https://www.rsc.org/images/entities/char_2009.gif) 2 by volume) as eluent, giving a light yellow-green solid (1.08 g, 85% yield). 1H NMR (600 MHz, CDCl3) δ 8.83 (s, 1H), 8.17 (s, 4H), 7.70 (s, 1H), 7.71 (s, 8H), 7.66 (s, 2H), 7.56 (d, J = 8.4 Hz, 4H), 7.51 (d, J = 8.4 Hz, 4H), 7.47 (d, J = 8.4 Hz, 4H), 7.27 (s, 2H), 2.41 (s, 6H), 1.49 (s, 36H) (Fig. S8 and S9†); 13C NMR (150 MHz, CDCl3) δ 143.31, 142.96, 139.79, 139.74, 139.01, 138.51, 137.51, 132.29, 131.93, 131.22, 131.11, 129.88, 129.27, 126.46, 126.04, 123.72, 117.59, 116.38, 114.91, 109.24, 77.31, 76.99, 76.68, 34.78, 32.02, 21.26 (Fig. S10†); HRMS (MALDI-TOF) m/z: [M]+ calcd for C78H74N4 1066.5913; found 1066.5923 (Fig. S11 and S12†). Anal. calcd (%) for C78H74N4: C 87.76, H 6.99, N 5.25; found: C 87.89, H 6.78, N 5.14.
2 by volume) as eluent, giving a light yellow-green solid (1.08 g, 85% yield). 1H NMR (600 MHz, CDCl3) δ 8.83 (s, 1H), 8.17 (s, 4H), 7.70 (s, 1H), 7.71 (s, 8H), 7.66 (s, 2H), 7.56 (d, J = 8.4 Hz, 4H), 7.51 (d, J = 8.4 Hz, 4H), 7.47 (d, J = 8.4 Hz, 4H), 7.27 (s, 2H), 2.41 (s, 6H), 1.49 (s, 36H) (Fig. S8 and S9†); 13C NMR (150 MHz, CDCl3) δ 143.31, 142.96, 139.79, 139.74, 139.01, 138.51, 137.51, 132.29, 131.93, 131.22, 131.11, 129.88, 129.27, 126.46, 126.04, 123.72, 117.59, 116.38, 114.91, 109.24, 77.31, 76.99, 76.68, 34.78, 32.02, 21.26 (Fig. S10†); HRMS (MALDI-TOF) m/z: [M]+ calcd for C78H74N4 1066.5913; found 1066.5923 (Fig. S11 and S12†). Anal. calcd (%) for C78H74N4: C 87.76, H 6.99, N 5.25; found: C 87.89, H 6.78, N 5.14.Conflicts of interest
There are no conflicts to declare.Acknowledgements
This work was financially supported by the National Natural Science Foundation of China (NNSFC, No. 21662028 and 21965031), the Project of Qinghai Science & Technology Department (Grant No. 2020-ZJ-923, 2018-HZ-817 and 2016-ZJ-Y01), the Open Project of State Key Laboratory of Plateau Ecology and Agriculture, Qinghai University (Grant No. 2018-ZZ-4), and Qinghai Province “High-end Innovative Thousand Talents Plan” (2017).Notes and references
- (a) X. Zhang, Z. Chi, Y. Zhang, S. Liu and J. Xu, J. Mater. Chem. C, 2013, 1, 3376–3390 RSC; (b) M. K. Beyer and H. Clausen-Schaumann, Chem. Rev., 2005, 105, 2921–2948 CrossRef CAS PubMed; (c) Z. Chi, X. Zhang, B. Xu, X. Zhou, C. Ma, Y. Zhang, S. Liu and J. Xu, Chem. Soc. Rev., 2012, 41, 3878–3896 RSC.
- J. W. Chung, Y. You, H. S. Huh, B.-K. An, S.-J. Yoon, S. H. Kim, S. W. Lee and S. Y. Park, J. Am. Chem. Soc., 2009, 131, 8163–8172 CrossRef CAS PubMed.
- (a) Y. Dong, J. W. Y. Lam, A. Qin, Z. Li, J. Sun, H. H. Y. Sung, I. D. Williams and B. Z. Tang, Chem. Commun., 2007, 40–42 RSC; (b) Y. Zhao, H. Gao, Y. Fan, T. Zhou, Z. Su, Y. Liu and Y. Wang, Adv. Mater., 2009, 21, 3165–3169 CrossRef CAS.
- (a) P. Xue, Z. Yang and P. Chen, J. Mater. Chem. C, 2018, 6, 4994–5000 RSC; (b) Y. Dong, J. Zhang, X. Tan, L. Wang, J. Chen, B. Li, L. Ye, B. Xu, B. Zou and W. Tian, J. Mater. Chem. C, 2013, 1, 7554–7559 RSC; (c) M. S. Kwon, J. Gierschner, J. Seo and S. Y. Park, J. Mater. Chem. C, 2014, 2, 2552–2557 RSC; (d) C. Ma, B. Xu, G. Xie, J. He, X. Zhou, B. Peng, L. Jiang, B. Xu, W. Tian, Z. Chi, S. Liu, Y. Zhang and J. Xu, Chem. Commun., 2014, 50, 7374–7377 RSC.
- (a) P. Xue, J. Ding, P. Wang and R. Lu, J. Mater. Chem. C, 2016, 4, 6688–6706 RSC; (b) H. Sun, S. Liu, W. Lin, K. Y. Zhang, W. Lv, X. Huang, F. Huo, H. Yang, G. Jenkins, Q. Zhao and W. Huang, Nat. Commun., 2014, 5, 3601–3609 CrossRef PubMed; (c) Y. Sagara, T. Mutai, I. Yoshikawa and K. Araki, J. Am. Chem. Soc., 2007, 129, 1520–1521 CrossRef CAS PubMed; (d) J. Yang, J. Qin, P. Geng, J. Wang, M. Fang and Z. Li, Angew. Chem., Int. Ed., 2018, 57, 14174–14178 CrossRef CAS PubMed.
- (a) C. E. Olson, M. J. R. Previte and J. T. Fourkas, Nat. Mater., 2002, 1, 225–228 CrossRef CAS PubMed; (b) S. J. Lim, B. K. An, S. D. Jung, M. A. Chung and S. Y. Park, Angew. Chem., Int. Ed., 2004, 43, 6346–6350 CrossRef CAS PubMed.
- (a) Y. Mu, Z. Yang, J. Chen, Z. Yang, W. Li, X. Tan, Z. Mao, T. Xu, J. Zhao, S. Zheng, S. Liu, Y. Zhang, Z. Chi, J. Xu and M. P. Aldred, Chem. Sci., 2018, 9, 3782–3787 RSC; (b) N. Zhao, Z. Y. Yang, J. W. Y. Lam, H. H. Y. Sung, N. Xie, S. Chen, H. Su, M. Gao, I. D. Williams, K. S. Wong and B. Z. Tang, Chem. Commun., 2012, 48, 8637–8639 RSC; (c) D.-H. Park, J. Hong, I. S. Park, C. W. Lee and J.-M. Kim, Adv. Funct. Mater., 2014, 24, 5186–5193 CrossRef CAS; (d) S. Xu, T. Liu, Y. Mu, Y.-F. Wang, Z. Chi, C.-C. Lo, S. Liu, Y. Zhang, A. Lien and J. Xu, Angew. Chem., Int. Ed., 2015, 54, 874–878 CrossRef CAS PubMed; (e) M. Tanioka, S. Kamino, A. Muranaka, Y. Ooyama, H. Ota, Y. Shirasaki, J. Horigome, M. Ueda, M. Uchiyama, D. Sawada and S. Enomoto, J. Am. Chem. Soc., 2015, 137, 6436–6439 CrossRef CAS PubMed.
- A. Kishimura, T. Yamashita, K. Yamaguchi and T. Aida, Nat. Mater., 2005, 4, 546–549 CrossRef CAS PubMed.
- (a) W. Z. Yuan, Y. Gong, S. Chen, X. Y. Shen, J. W. Y. Lam, P. Lu, Y. Lu, Z. Wang, P. Hu, N. Xie, H. S. Kwok, Y. Zhang, J. Z. Sun and B. Z. Tang, Chem. Mater., 2012, 24, 1518–1528 CrossRef CAS; (b) Y. Gong, Y. Tan, J. Liu, P. Lu, C. Feng, W. Z. Yuan, Y. Lu, J. Z. Sun, G. He and Y. Zhang, Chem. Commun., 2013, 49, 4009–4011 RSC.
- (a) G. Zhang, J. Lu, M. Sabat and C. L. Fraser, J. Am. Chem. Soc., 2010, 132, 2160–2162 CrossRef CAS PubMed; (b) P. Galer, R. C. Korošec, M. Vidmar and B. Šket, J. Am. Chem. Soc., 2014, 136, 7383–7394 CrossRef CAS PubMed; (c) R. Yoshii, K. Suenaga, K. Tanaka and Y. Chujo, Chem.–Eur. J., 2015, 21, 7231–7237 CrossRef CAS PubMed; (d) Z. Zhang, Z. Wu, J. Sun, B. Yao, P. Xue and R. Lu, J. Mater. Chem. C, 2016, 4, 2854–2861 RSC; (e) X. Wang, Q. Liu, H. Yan, Z. Liu, M. Yao, Q. Zhang, S. Gong and W. He, Chem. Commun., 2015, 51, 7497–7500 RSC; (f) T. Butler, W. A. Morris, J. Samonina-Kosicka and C. L. Fraser, ACS Appl. Mater. Interfaces, 2016, 8, 1242–1251 CrossRef CAS PubMed.
- (a) L. Zhou, D. Xu, H. Gao, A. Han, X. Liu, C. Zhang, Z. Li and Y. Yang, Dyes Pigm., 2017, 137, 200–207 CrossRef CAS; (b) L. Zhou, D. Xu, H. Gao, A. Han, Y. Yang, C. Zhang, X. Liu and F. Zhao, RSC Adv., 2016, 6, 69560–69568 RSC; (c) H. Gao, D. Xu, X. Liu, A. Han, L. Zhou, C. Zhang, Z. Li and J. Dang, Dyes Pigm., 2017, 139, 157–165 CrossRef CAS; (d) H. Gao, D. Xu, X. Liu, A. Han, L. Zhou, C. Zhang, Y. Yang and W. Li, RSC Adv., 2017, 7, 1348–1356 RSC; (e) H. Gao, D. Xu, Y. Wang, Y. Wang, X. Liu, A. Han and C. Zhang, Dyes Pigm., 2018, 150, 59–66 CrossRef CAS; (f) H. Gao, D. Xu, Y. Wang, C. Zhang, Y. Yang, X. Liu, A. Han and Y. Wang, Dyes Pigm., 2018, 150, 165–173 CrossRef CAS.
- (a) W. Z. Yuan, Y. Tan, Y. Gong, P. Lu, J. W. Y. Lam, X. Y. Shen, C. Feng, H. H.-Y. Sung, Y. Lu, I. D. Williams, J. Z. Sun, Y. Zhang and B. Z. Tang, Adv. Mater., 2013, 25, 2837–2843 CrossRef CAS PubMed; (b) G. Zhang, J. Sun, P. Xue, Z. Zhang, P. Gong, J. Peng and R. Lu, J. Mater. Chem. C, 2015, 3, 2925–2932 RSC.
- (a) Z. Yang, Z. Chi, Z. Mao, Y. Zhang, S. Liu, J. Zhao, M. P. Aldred and Z. Chi, Mater. Chem. Front., 2018, 2, 861–890 RSC; (b) Q. Lu, X. Li, J. Li, Z. Yang, B. Xu, Z. Chi, J. Xu and Y. Zhang, J. Mater. Chem. C, 2015, 3, 1225–1234 RSC; (c) B. Xu, Z. Chi, J. Zhang, X. Zhang, H. Li, X. Li, S. Liu, Y. Zhang and J. Xu, Chem.–Asian J., 2011, 6, 1470–1478 CrossRef CAS PubMed.
- (a) Q. Sun, K. Zhang, X. Fan, L. Tang, L. Liu, Y. Wang, Q. Ding, M. Zhai, S. Xue and W. Yang, Dyes Pigm., 2019, 165, 193–199 CrossRef CAS; (b) Z. Liu, K. Zhang, Q. Sun, Z. Zhang, L. Tang, S. Xue, D. Chen, H. Zhang and W. Yang, J. Mater. Chem. C, 2018, 6, 1377–1383 RSC; (c) S. Ying, M. Chen, Z. Liu, M. Zheng, H. Zhang, S. Xue and W. Yang, J. Mater. Chem. C, 2017, 5, 5994–5998 RSC.
- (a) J. Zhao, Z. Chi, Z. Yang, Z. Mao, Y. Zhang, E. Ubba and Z. Chi, Mater. Chem. Front., 2018, 2, 1595–1608 RSC; (b) X. Zhang, Z. Chi, J. Zhang, H. Li, B. Xu, X. Li, S. Liu, Y. Zhang and J. Xu, J. Phys. Chem. B, 2011, 115, 7606–7611 CrossRef CAS PubMed; (c) Y. Dong, B. Xu, J. Zhang, X. Tan, L. Wang, J. Chen, H. Lv, S. Wen, B. Li, L. Ye, B. Zou and W. Tian, Angew. Chem., Int. Ed., 2012, 51, 10782–10785 CrossRef CAS PubMed; (d) L. Bu, Y. Li, J. Wang, M. Sun, M. Zheng, W. Liu, S. Xue and W. Yang, Dyes Pigm., 2013, 99, 833–838 CrossRef CAS.
- (a) J. Luo, L.-Y. Li, Y. Song and J. Pei, Chem.–Eur. J., 2011, 17, 10515–10519 CrossRef CAS PubMed; (b) M. S. Kwon, J. Gierschner, S. J. Yoon and S. Y. Park, Adv. Mater., 2012, 24, 5487–5492 CrossRef CAS PubMed; (c) J. W. Chung, Y. You, H. S. Huh, B.-K. An, S.-J. Yoon, S. H. Kim, S. W. Lee and S. Y. Park, J. Am. Chem. Soc., 2009, 131, 8163–8172 CrossRef CAS PubMed; (d) X. Luo, J. Li, C. Li, L. Heng, Y. Q. Dong, Z. Liu, Z. Bo and B. Z. Tang, Adv. Mater., 2011, 23, 3261–3265 CrossRef CAS PubMed.
- Q. Qi, J. Qian, X. Tan, J. Zhang, L. Wang, B. Xu, B. Zou and W. Tian, Adv. Funct. Mater., 2015, 25, 4005–4010 CrossRef CAS.
- T. Han, Y. Hong, N. Xie, S. Chen, N. Zhao, E. Zhao, J. W. Y. Lam, H. H. Y. Sung, Y. Dong, B. Tong and B. Z. Tang, J. Mater. Chem. C, 2013, 1, 7314–7320 RSC.
- Z. Xie, B. Yang, F. Li, G. Cheng, L. Liu, G. Yang, H. Xu, L. Ye, M. Hanif, S. Liu, D. Ma and Y. Ma, J. Am. Chem. Soc., 2005, 127, 14152–14153 CrossRef CAS PubMed.
- W. Liu, J. Wang, Y. Gao, Q. Sun, S. Xue and W. Yang, J. Mater. Chem. C, 2014, 2, 9028–9034 RSC.
- S. Xue, S. Liu, F. He, L. Yao, C. Gu, H. Xu, Z. Xie, H. Wu and Y. Ma, Chem. Commun., 2013, 49, 5730–5732 RSC.
- (a) J. Sun, X. Lv, P. Wang, Y. Zhang, Y. Dai, Q. Wu, M. Ouyang and C. Zhang, J. Mater. Chem. C, 2014, 2, 5365–5371 RSC; (b) J. Sun, Y. Dai, M. Ouyang, Y. Zhang, L. Zhan and C. Zhang, J. Mater. Chem. C, 2015, 3, 3356–3363 RSC.
- (a) D. Xu, J. Hao, H. Gao, Y. Wang, Y. Wang, X. Liu, A. Han and C. Zhang, Dyes Pigm., 2018, 150, 293–300 CrossRef CAS; (b) Y. Wang, D. Xu, H. Gao, Y. Wang, X. Liu, A. Han, C. Zhang and L. Zang, Dyes Pigm., 2018, 156, 291–298 CrossRef CAS; (c) Y. Wang, D. Xu, H. Gao, Y. Wang, X. Liu, A. Han, C. Zhang and L. Zang, J. Phys. Chem. C, 2018, 122, 2297–2306 CrossRef CAS; (d) Y. Wang, J. Liu, W. Yuan, Y. Wang, H. Zhou, X. Liu, J. Cao and C. Zhang, Dyes Pigm., 2019, 167, 135–142 CrossRef CAS.
- (a) F. Loiseau, S. Campagna, A. Hameurlaine and W. Dehaen, J. Am. Chem. Soc., 2005, 127, 11352–11363 CrossRef CAS PubMed; (b) X. Liu, D. Xu, R. Lu, B. Li, C. Qian, P. Xue, X. Zhang and H. Zhou, Chem.–Eur. J., 2011, 17, 1660–1669 CrossRef CAS PubMed.
- N. Mataga, Y. Kaifu and M. Koizumi, Solvent effects upon fluorescence spectra and the dipole moments of excited molecules, Bull. Chem. Soc. Jpn., 1956, 29, 465–470 CrossRef CAS.
- (a) S. K. Wu, Prog. Chem., 2005, 17, 15–39 CAS; (b) Z. Zhang, P. Xue, P. Gong, G. Zhang, J. Peng and R. Lu, J. Mater. Chem. C, 2014, 2, 9543–9551 RSC.
- X. Yang, R. Lu, T. Xu, P. Xue, X. Liu and Y. Zhao, Chem. Commun., 2008, 453–455 RSC.
- X. Zhang, Z. Chi, B. Xu, C. Chen, X. Zhou, Y. Zhang, S. Liu and J. Xu, J. Mater. Chem., 2012, 22, 18505–18513 RSC.
Footnotes |
| † Electronic supplementary information (ESI) available: For MDCS-BC: 1H and 13C NMR, MALDI-TOF MS spectra, DLS data, reversibility of MFC processes. See DOI: 10.1039/d0ra00283f |
| ‡ These authors contributed equally to this work. |
| This journal is © The Royal Society of Chemistry 2020 |

