 Open Access Article
Efficient synthesis of Pt–Co nanowires as cathode catalysts for proton exchange membrane fuel cells
Zhikun Liuab,
Yanhong Yin ab,
Daijun Yangc,
Cunman Zhangc,
Pingwen Mingc,
Bing Li
 *c and
Shuting Yang
 *ab
*ab
aSchool of Chemistry and Chemical Engineering, Henan Normal University, Xinxiang, Henan 453007, China. E-mail: shutingyang@foxmail.com
bCollaborative Innovation Center of Henan Province for Motive Power and Key Materials, Henan Normal University, Xinxiang, Henan 453007, China
cClean Energy Automotive Engineering Center and School of Automotive Studies, Tongji University, Shanghai 201804, China. E-mail: libing210@tongji.edu.cn
First published on 10th February 2020
Abstract
A simple and efficient method was used to prepare highly active and durable carbon-supported ultrathin Pt–Co nanowires (NWs) as oxygen reduction reaction (ORR) catalysts for the cathode in a proton exchange membrane fuel cell (PEMFC). Chromium hexacarbonyl plays a significant role in making Pt and Co form an alloyed NW, which acts as both a reducing agent and a structure directing agent. The nanocrystal exhibits a uniform nanowire morphology with a diameter of 2 nm and a length of 30 nm. In half cell tests, the Pt–Co NWs/C catalyst has a mass activity of 291.4 mA mgPt−1, which is significantly better than commercial Pt/C catalysts with 85.5 mA mgPt−1. And after the accelerated durability test (ADT), Pt–Co NWs/C shows an electrochemically active surface area (ECSA) loss of 19.1% while the loss in the commercial catalyst is 41.8%. Also, the membrane electrode assembly (MEA) was prepared using Pt–Co NWs/C as the cathode catalyst, resulting in a maximum power density of 952 mW cm−2, which is higher than that of Pt/C. These results indicate that the one-dimensional structure of the catalyst prepared herein is favorable to improve the activity and durability, and the application of the catalyst in the MEA is also realized.
1 Introduction
Proton exchange membrane fuel cells (PEMFCs) are deemed to be the most promising fuel cell type in the commercialization stage due to their environmental friendliness, high energy conversion efficiency and static nature.1 Despite this, much effort and development research have been focused on reducing costs, increasing durability, and further optimizing and improving activity. The development of high-efficiency and durable Pt-based catalysts has been a research hotspot. Pt delivers superior performance and great potential in a wide range of catalytic reactions, particularly for the cathodic oxygen reduction reaction (ORR) in fuel cells, but limited by scarce resources and high cost.2 There are two main directions to the study of noble metal catalysts, one is to design different sizes and shapes, the other is to change the components, such as alloying.3–5 Pt-based alloy is beneficial to reducing the amount of precious metal, improving the utilization of precious metal and enhancing activity and durability.6Research has shown that Pt alloyed with 3d transition metal (M, e.g., Fe, Co, and Ni) catalysts have better ORR performance, which is attributed to the lattice shrinkage and the improvement of electronic structure.7 Although PtM alloy catalysts significantly improve kinetic activity,8 poor durability and stability on account of second phase metal degradation, atomic migration, and particle aggregation under corrosive electrochemical conditions have become major limitations.9 Ultrathin PtM alloy nanowires (NWs) not only improve the electrocatalytic performance and utilization efficiency of Pt, but also make alloys difficult to dissolve and agglomerate in the fuel cell operating environment due to the ultrasmall size and the unique one-dimensional morphology, which can improve the durability of the catalyst.10–13
In the last few years, the application of strong coordination capping ligands such as oleylamine (OAm) has generated a great interest. This versatile reagent play a specific role in forming nanostructures using a variety of organic or inorganic compounds as precursors either alone or in combination with other reactants, which is an easy method for preparing alloy NWs and could be amplified for production.14–16 However, most of the previous experimental methods have many deficiencies, such as very complicated operations or high requirements on the reaction system (special gas environment or specific pressure value).17 There have been many studies confirming that carbon monoxide can profoundly affect the growth process of metal nanowires.18 Although the use of gaseous CO is very simple, it is really dangerous. Liquid dimethylformamide (DMF), which can be used as a carbon monoxide source under alkaline conditions, is difficult to control the nanowire diameter.19 In contrast, metal carbonyl compounds are useful as simple and feasible solid carbon monoxide releasing reagent.20 Zeng et al. prepared Rh-doped Pt nanowires in oleylamine with the aid of W(CO)6 and didecyldimethylammonium bromide (DDAB).21 And Du's group successfully prepared ultrathin platinum-cobalt nanowires using Mo(CO)6 to control crystal growth and glucose as a reducing agent to assist in the reduction of transition metal.22
Taking into account the above advantages and disadvantages, we prepared Pt–Co NWs/C with a simple and efficient self-assembly synthesis strategy. The chromium hexacarbonyl in the reaction system not only acts as a reducing agent but also a structure directing agent, and plays a crucial step in the production of nanowires, which determines the kinetics of crystal growth. Therefore, our experimental method can realize large-scale fabrication of alloy nanowires simply, efficiently and innovatively using the minimum of chemicals. The electrochemical evaluation showed that the prepared Pt–Co NWs/C catalyst has enhanced catalytic activity and durability. Under this premise, we used the as-prepared Pt–Co NWs/C in cathode to fabricate MEA, so as to further study the performance of the catalyst at the MEA level. And after we scaled up the chemicals in equal proportions, the experimental results are consistent.
2 Experimental
Chemicals
Platinum(II) acetylacetonate (Pt(acac)2, 97%), cobalt(II) acetylacetonate (Co(acac)2, 99%) and oleylamine (OAm, >70%) were all purchased from Aldrich. Chromium(0) hexacarbonyl (Cr(CO)6, 99%) was purchased from Aladdin and Vulcan XC-72 was used as carbon black. The ultrapure water used herein has a resistivity of 18.2 MΩ cm.Catalyst synthesis
Characterization
Transmission electron microscopy (TEM) and high resolution transmission electron microscopy (HRTEM) images were obtained by JEOL 2010F microscope to observe the morphology of the catalyst and obtain lattice fringe images. The powder X-ray diffraction (XRD) patterns were recorded at a rate of 5° min−1 in a 2θ range from 20° to 90°. Energy-dispersive X-ray spectroscopy (EDS) observation was employed to analyze element composition of the catalysts. X-ray photoelectron spectroscopy (XPS, PHI 5000 VersaProbe) analyses were performed to reveal the elemental composition and chemical state of the Pt–Co NWs/C catalyst. By using inductively coupled plasma mass spectrometry (ICP-MS), the element contents of different catalysts were determined.Electrochemical measurements
The rotating disk electrode (RDE) test was carried out using three-electrode system in 0.1 M HClO4. After preparing 0.5 mL of Nafion/methanol solution (mass ratio of 1![[thin space (1/6-em)]](https://www.rsc.org/images/entities/char_2009.gif) :
:![[thin space (1/6-em)]](https://www.rsc.org/images/entities/char_2009.gif) 30), 1 mg of the catalyst was dispersed therein, followed by sonication for 45 minutes to prepare a catalyst ink. The system was composed of a glassy carbon electrode (0.196 cm2) to which 8 μL of catalyst ink was coated as the working electrode, reversible hydrogen electrode (RHE) as the reference electrode and a platinum plate as the counter electrode. The potential sweep was performed in a N2 saturated electrolyte from 0.05 V to 1.15 V vs. RHE for cyclic voltammetry (CV) curves, of which we can evaluate the electrochemically active surface area (ECSA). To evaluate the mass activity (MA) of catalysts, linear sweep voltammetry (LSV) tests were carried out in an O2-saturated electrolyte at 1600 rpm. The potential was scanned from 0.05 to 1.15 V vs. RHE. The accelerated degradation testing (ADT) was performed in a N2-saturated solution at room temperature between 0.6 V and 1.1 V vs. RHE under a scan rate of 100 mV s−1. And then, CV and LSV curves were immediately tested.
30), 1 mg of the catalyst was dispersed therein, followed by sonication for 45 minutes to prepare a catalyst ink. The system was composed of a glassy carbon electrode (0.196 cm2) to which 8 μL of catalyst ink was coated as the working electrode, reversible hydrogen electrode (RHE) as the reference electrode and a platinum plate as the counter electrode. The potential sweep was performed in a N2 saturated electrolyte from 0.05 V to 1.15 V vs. RHE for cyclic voltammetry (CV) curves, of which we can evaluate the electrochemically active surface area (ECSA). To evaluate the mass activity (MA) of catalysts, linear sweep voltammetry (LSV) tests were carried out in an O2-saturated electrolyte at 1600 rpm. The potential was scanned from 0.05 to 1.15 V vs. RHE. The accelerated degradation testing (ADT) was performed in a N2-saturated solution at room temperature between 0.6 V and 1.1 V vs. RHE under a scan rate of 100 mV s−1. And then, CV and LSV curves were immediately tested.
Fabrication of MEA
The Pt loadings of anode and cathode were 0.2 mg cm−2 and 0.4 mg cm−2 respectively in MEA prepared by different catalysts. After mixing catalysts and Nafion (mass ratio of 3![[thin space (1/6-em)]](https://www.rsc.org/images/entities/char_2009.gif) :
:![[thin space (1/6-em)]](https://www.rsc.org/images/entities/char_2009.gif) 1), the mixture of isopropyl alcohol and ultrapure water (volume ratio 1
1), the mixture of isopropyl alcohol and ultrapure water (volume ratio 1![[thin space (1/6-em)]](https://www.rsc.org/images/entities/char_2009.gif) :
:![[thin space (1/6-em)]](https://www.rsc.org/images/entities/char_2009.gif) 1) was added and dispersed uniformly. The commercial Pt/C catalyst (JM, Johnson Matthey) was sprayed on one side of a membrane (Gore membrane, 15 μm, 50 × 50 mm) as anode catalyst, and the prepared Pt–Co NWs/C catalyst was sprayed on the other side of the membrane as cathode catalyst. To fabricate the final MEA, the membrane was covered by two pieces of gas diffusion layers (GDLs) and sealed with polyimide tape. The greenlight fuel cell testing platform was used to obtain polarization curves at relative humidity (RH) of 50%, stoichiometric ratio of H2 and air of 1.7 and 3.0, cell temperature of 80 °C, and gas pressure of 120 kPa on both sides. At a frequency range from 0.1 Hz to 10
1) was added and dispersed uniformly. The commercial Pt/C catalyst (JM, Johnson Matthey) was sprayed on one side of a membrane (Gore membrane, 15 μm, 50 × 50 mm) as anode catalyst, and the prepared Pt–Co NWs/C catalyst was sprayed on the other side of the membrane as cathode catalyst. To fabricate the final MEA, the membrane was covered by two pieces of gas diffusion layers (GDLs) and sealed with polyimide tape. The greenlight fuel cell testing platform was used to obtain polarization curves at relative humidity (RH) of 50%, stoichiometric ratio of H2 and air of 1.7 and 3.0, cell temperature of 80 °C, and gas pressure of 120 kPa on both sides. At a frequency range from 0.1 Hz to 10![[thin space (1/6-em)]](https://www.rsc.org/images/entities/char_2009.gif) 000 Hz under the operating condition of 400 mA cm2, a disturbing current of 0.25 A was applied and then the electrochemical impedance spectroscopy (EIS) data were collected. The accelerated durability test of the single cell was obtained by maintaining a constant current condition of 1000 mA cm−2 for 100 h. The anode and cathode were connected with H2 and N2 respectively. Then the in situ CV curve was swept at a scan rate of 30 mV s−1 within the potential range from 0.05 V to 1.15 V vs. RHE, wherein the anode serves as a reference electrode and a counter electrode, the cathode serves as a working electrode. And the cathode catalyst was replaced with commercial Pt/C to prepare MEAs for comparison in the same way.
000 Hz under the operating condition of 400 mA cm2, a disturbing current of 0.25 A was applied and then the electrochemical impedance spectroscopy (EIS) data were collected. The accelerated durability test of the single cell was obtained by maintaining a constant current condition of 1000 mA cm−2 for 100 h. The anode and cathode were connected with H2 and N2 respectively. Then the in situ CV curve was swept at a scan rate of 30 mV s−1 within the potential range from 0.05 V to 1.15 V vs. RHE, wherein the anode serves as a reference electrode and a counter electrode, the cathode serves as a working electrode. And the cathode catalyst was replaced with commercial Pt/C to prepare MEAs for comparison in the same way.
3 Results and discussion
Morphology and growth process of the nanowires
Pt–Co NWs were prepared by co-reduction of the precursors of Pt and Co in oleylamine (OAm). TEM image in Fig. 1a exhibits that the ultrathin nanowire structure has a uniform shape and homogeneous dispersive, with an average length of 30 nm (Fig. 1d), and diameter of about 2 nm (Fig. 1c). The nanowires are slightly larger at both ends and are evenly elongated in the middle, which is related to the formation mechanism of the autocatalytic process of the nanowires. Fig. 1b is an HRTEM image from which the lattice fringes of the prepared alloy catalyst can be clearly observed. The lattice distance of 0.221 nm is clearly shown, which is attributable to the (111) plane of the Pt–Co NWs, with a smaller lattice distance than 0.227 nm of the pure Pt phase (111) plane.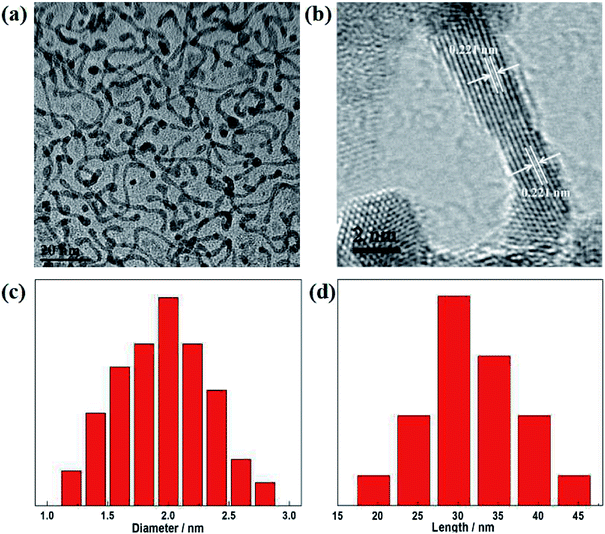 | ||
| Fig. 1 (a) TEM and (b) HRTEM images of the Pt–Co NWs. (c) Length and (d) diameter histograms of Pt–Co NWs. | ||
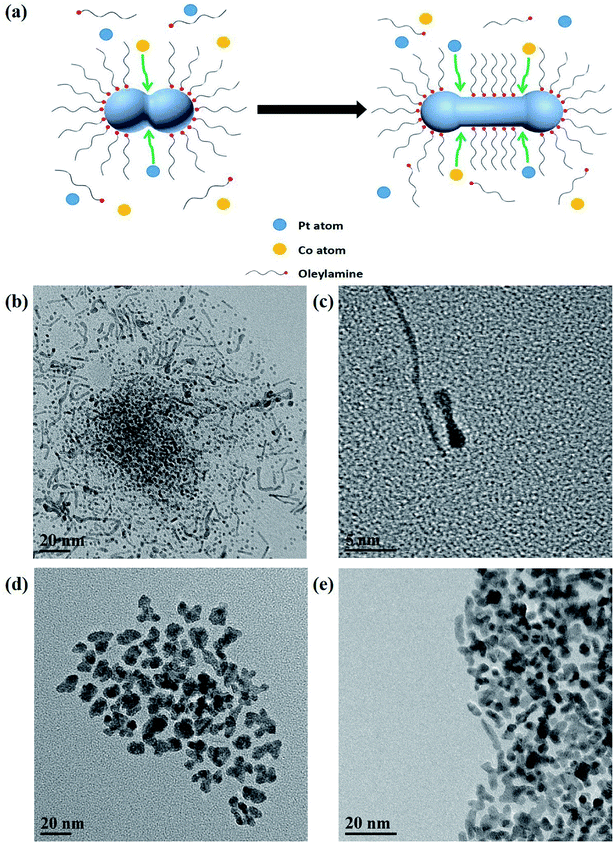
These images show that uniform ultrathin nanowires can be formed in OAm by simply relying on Cr(CO)6. Cr(CO)6 decomposes into Cr0 and CO, which can be used not only as a reducing agent but also as a structure directing agent, and there is no residual Cr element detected in the products, which reflects the convenience and efficiency of this method. In order to explore the effect of Cr(CO)6, the shape of the final product without Cr(CO)6 during the synthesis is also obtained, as shown in Fig. 2d. The resulting nanocrystals show an irregular structure with a diameter of 10–15 nm, and only a few products were found during the collection process.
In order to study the growth mechanism of nanowires, we obtained crystal topography images at different reaction times by TEM. When the reaction time is short (Fig. 2b and c), we observed that the nanoparticles and the short nanorods exist at the same time. They all have the characteristics of larger ends and thinner middle parts, indicating that the two nuclei are fused together after metal nucleation. Subsequently, more nuclei are absorbed at the corners so that the nanoparticles grow into nanorods and are aligned to form the final nanowires structure. In this process, due to the less adhesion of the oleylamine ligand, the corners become autocatalytic sites and they are the key parts of the formation of nanowires.20 The schematic of the nanocrystal growth mechanism by the efficient self-assembly synthesis strategy is illustrated in Fig. 2a. On this basis, increasing the amount of oleylamine is expected to result in less chance of nuclei contact and fusion, and the TEM image in Fig. 2e confirms this conjecture, in which nanoparticles and irregular polypods can be found.
The composition of the nanocrystals collected at different stages was also analyzed to study the formation of Pt–Co NWs. The atomic ratio of Pt to Co investigated at 2.5 hours without acid washing (Pt–Co NWs – 2.5 h), 5 hours without acid washing (Pt–Co NWs – 5 h), and 5 hours with acid washing (Pt–Co NWs-pickling) were tested by EDS. The atomic ratio of Pt/Co is about 64.75/35.25 after 2.5 hours, while the ratio becomes 60.86/39.14 after 5 hours. And EDS of Pt–Co NWs-pickling reveals that the Pt/Co atomic ratio is about 78.77/21.23, which is in accordance with the ICP-MS results. The change in Co content during the synthesis is attributed to the fact that Pt species were reduced first due to the higher redox potential.23 Considering this, the growth process of nanowires depends on the preferential formation of Pt nanowires, and then the Co element is continuously reduced and alloyed with Pt. As for the reduction of Co content after pickling, it is caused by the dissolution with acetic acid.
Phase and composition of carbon-supported Pt–Co NWs
The prepared nanowires were then loaded on carbon black for further use, as shown in Fig. 3a. It's clear that Pt–Co nanowires retain the nanowire structure after mechanical deposition and are uniformly attached to the surface of the carbon black. It shows that the efficient self-assembly synthesis strategy of nanowires can be very simple to transform into a carbon-supported catalyst that can be applied. According to ICP-MS analysis, the loading of Pt is 31.84 wt% which is close to the theoretical value, while the loading of Co is 2.28 wt%. And this contents of Pt and Co are consistent with the test results of EDS. In order to study the effect of the addition of the transition metal Co element, Pt NWs were also prepared for comparison. And the ICP results showed that the Pt loading in Pt NWs/C is 33.2% by weight.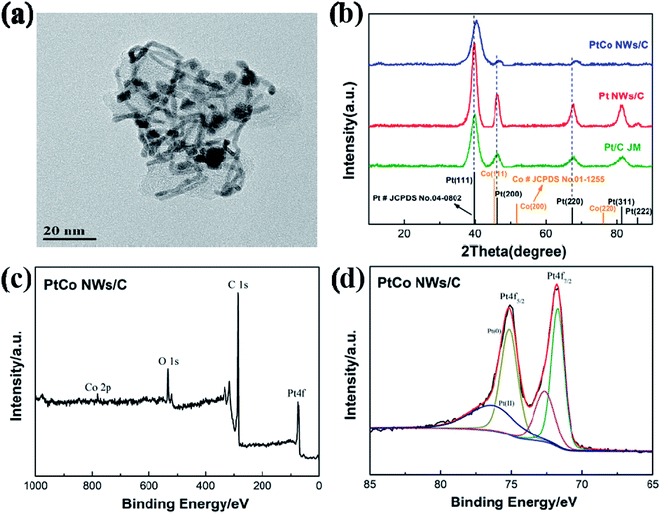 | ||
| Fig. 3 (a) TEM image of carbon-supported Pt–Co NWs. (b) XRD patterns of the Pt–Co NWs/C and Pt NWs/C in comparison with the Pt/C (JM). XPS spectrum of (c) Pt–Co NWs/C and (d) the Pt 4f photoemission. | ||
To further analyze the phase of the catalyst, XRD was used to characterize Pt–Co NWs/C, and the results of Pt NWs/C and commercial Pt/C were also compared. The patterns in Fig. 3b suggest that they possess a face-centered cubic (fcc) structure, and the Joint Committee on Powder Diffraction Standards (JCPDS) data of Pt (No. 04-0802) and Co (No. 01-1255) are also included in Fig. 3b for comparison. For the Pt/C, the XRD pattern matches well with the standard diffraction of Pt (JCPDS No. 04-0802). The characteristic diffraction peaks at 39.8°, 46.2° and 67.5° can be indexed to (111), (200) and (220) lattice planes of Pt. Pt NWs/C is consistent with the commercial Pt/C peak position, but the corresponding diffraction peak intensity increases, indicating better crystallinity. It can be seen that after the introduction of the transition metal element cobalt, the peak positions are shifted to higher 2θ values, which is caused by a decrease of lattice distance produced by smaller cobalt atoms introducing and alloying with Pt, revealing that Pt–Co alloy formation.24,25
Also, the XPS patterns in Fig. 3b show a high content of metallic platinum, which is predominantly in a metallic state. The Pt 4f binding energy of the Pt–Co alloy crystal (71.8 eV for Pt 4f7/2 and 75.1 eV for Pt 4f5/2) is positive shifted compared to 71.2 eV for Pt 4f7/2 and 74.5 eV for Pt 4f5/2 of pure Pt. Studies have shown that the binding energy greatly affects the adsorption/desorption capacity of the active species which are on the surface of the catalyst. This shift in binding energy means a downshift of the d-band center, which results in a weak chemical interaction between the surface Pt and the O species, and the proper adsorption capacity of the oxygen-containing intermediate is critical to the improvement of the ORR kinetics.26 In addition, considering that the energy spectrum signal of Co 2p is very weak, the near-surface element content of the XPS spectrum is analyzed. The results showed that the contents of Pt and Co are 3.18 at% and 0.25 at%, respectively, which means the molar ratio of Pt and Co near the surface is 92.7/7.3, and the ratio is as high as 12.7. Compared with the results of ICP-MS test, the calculated ratio is only 4.2, which indicates that the surface and bulk element distributions in Pt–Co NWs/C catalysts are different, and the nanowires have a Pt-rich surface layer. This structural feature is also one of the reasons for the excellent performance of the catalyst.
Electrochemical testing
The ORR electrochemical properties of the prepared catalyst were evaluated by CV and LSV. The ECSA of Pt–Co NWs/C calculated by the hydrogen adsorption/desorption peak of the CV curve is 44.6 m2 gPt−1, and the corresponding values of Pt NWs/C and Pt/C (JM) are 34.7 and 49.1 m2 gPt−1. The decrease in ECSA of Pt NWs/C is due to the large size and high aspect ratio of the nanowires shape, and the mutual contact when forming the network structure, compared to commercial Pt/C. It should be noted that the ECSA of the nanowires increases when the transition metal is added, which should be attributed to the increased utilization of Pt by the addition of Co, and the loss of surface portion Co after pickling, which resulted in more active sites being exposed. The LSV test results are shown in Fig. 4b, by which the MA of Pt–Co NWs/C, Pt NWs/C, and Pt/C (JM) are calculated to be 291.4, 115.1, and 85.5 mA mgPt−1 at 0.9 V (vs. RHE), respectively. The improvement in ORR performance of Pt NWs is attributed to the surface contraction associated with the ultrathin diameter and more active crystal faces exposed. The MA of Pt–Co NWs/C is 3.4 times that of commercial Pt/C, which is derived from the improvement of ORR kinetics in one-dimensional alloy structures from lattice shrinkage and improved electronic structure, which enhances electron and mass transfer.27Then, the catalyst was subjected to an accelerated durability test. After 5000 cycles, Fig. 5c shows that the ECSA of the commercial catalyst has declined by 41.8%, while the decay of the as-prepared Pt–Co NWs/C is 19.1% (Fig. 5a). In addition, the MA decay rate of Pt–Co NWs/C in Fig. 5b is only 30.9% compared to the apparent decline of commercial Pt/C by 72.3% (Fig. 5d). The results of half-cell durability are consistent with the previous morphology analysis of the one-dimensional structure. In fact, it is worth mentioning that after 10![[thin space (1/6-em)]](https://www.rsc.org/images/entities/char_2009.gif) 000 cycles, the ECSA of as-prepared catalyst decreased by 32.5%, while MA decreased by 45.2%. The ORR activity at this time is still 1.87 times the initial performance of commercial Pt/C, which demonstrates the excellent electrochemical catalytic performance of Pt–Co NWs/C. Moreover, the morphology and the composition of the catalyst after ADT were characterized using TEM and EDS to explore the reasons of catalyst degradation. The TEM and HRTEM images in Fig. 6a and b show that after the durability test of Pt–Co NWs/C, the nanowires appeared a certain degree of aggregation and size increasing which will result in a decrease in active sites. To identify the chemical compositions, the EDS analysis was conducted which shows that the atomic ratio of Pt/Co is about 85.31/14.69, in which the content of Co element is reduced after the ADT test. These should be the result of the Ostwald ripening and the loss of transition metal element in acidic environment. For reference, TEM images of commercial Pt/C catalyst were also obtained before and after durability test (Fig. 6c and d), and the changes in size and distribution are very obvious.
000 cycles, the ECSA of as-prepared catalyst decreased by 32.5%, while MA decreased by 45.2%. The ORR activity at this time is still 1.87 times the initial performance of commercial Pt/C, which demonstrates the excellent electrochemical catalytic performance of Pt–Co NWs/C. Moreover, the morphology and the composition of the catalyst after ADT were characterized using TEM and EDS to explore the reasons of catalyst degradation. The TEM and HRTEM images in Fig. 6a and b show that after the durability test of Pt–Co NWs/C, the nanowires appeared a certain degree of aggregation and size increasing which will result in a decrease in active sites. To identify the chemical compositions, the EDS analysis was conducted which shows that the atomic ratio of Pt/Co is about 85.31/14.69, in which the content of Co element is reduced after the ADT test. These should be the result of the Ostwald ripening and the loss of transition metal element in acidic environment. For reference, TEM images of commercial Pt/C catalyst were also obtained before and after durability test (Fig. 6c and d), and the changes in size and distribution are very obvious.
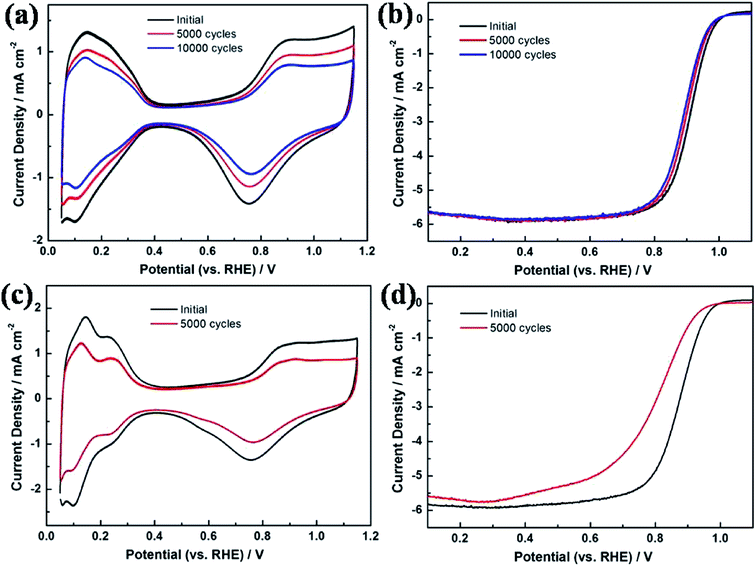 | ||
| Fig. 5 (a) CV curve and (b) LSV curve of Pt–Co NWs/C catalyst before and after ADT, (c) CV curve and (d) LSV curve of commercial Pt/C catalyst before and after ADT. | ||
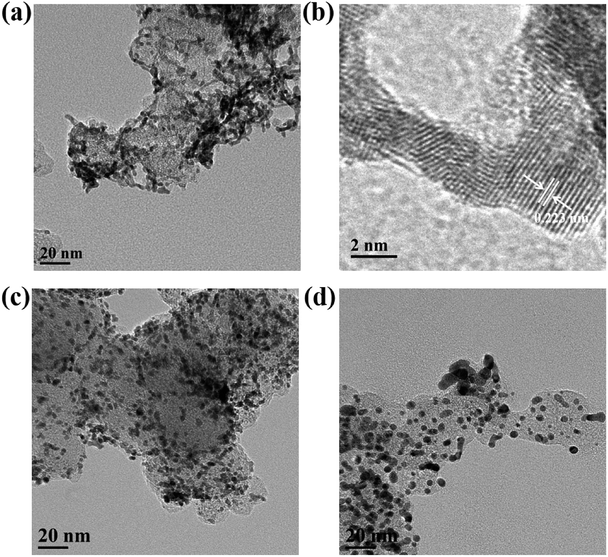 | ||
| Fig. 6 (a) TEM and (b) HRTEM images of Pt–Co NWs/C catalyst after ADT. TEM images of Pt/C(JM) (c) before and (d) after ADT. | ||
Single cell performance
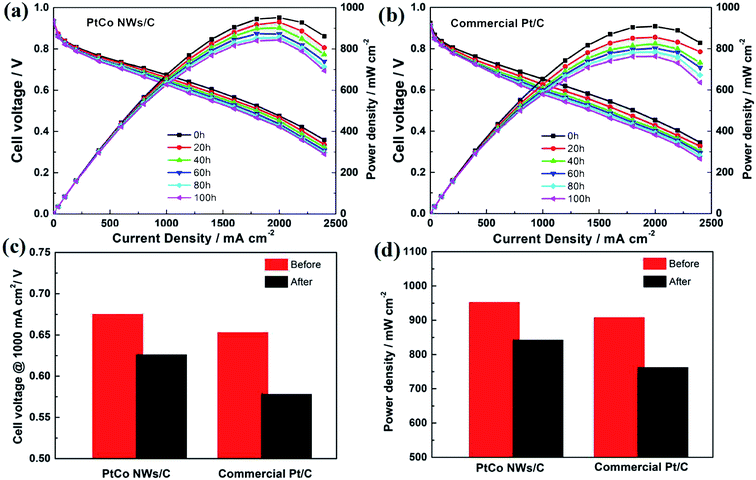
It is previously confirmed that our synthesis strategy is simple but highly efficient, and the prepared catalyst has good ORR performance. Then we prepared the MEA by using Pt–Co NWs/C and commercial Pt/C as cathode catalysts to analyze the practical application of the catalyst at single cell level. The operating conditions for testing the polarization curves of MEA and in situ CVs are described in the previous experimental section. When the current density is low, the performance of the two catalysts is similar in terms of open circuit voltage (OCV), as shown in Fig. 7a. When the current density is increased to the ohmic region and the mass transfer region of the fuel cell, the MEA prepared with Pt–Co NWs/C has a higher cell voltage and power density. The maximum power density of prepared catalyst is calculated to be 952 mW cm−2, which is 44 mW cm−2 higher than that of the commercial catalyst. In addition, its stable cell voltage at 1000 mA cm−2 is measured to be 0.675 V, with an increase of 22 mV over commercial Pt/C. At the same time, by calculating the performance of the MEA with the total platinum loading with the whole single cell, the maximum power density and Pt loading are 1.59 kW gPt−1 and 0.62 gPt·kW−1, respectively, which are superior to the commercial Pt/C which are 1.51 kW gPt−1 and 0.66 gPt·kW−1. The in situ CV images of the MEAs prepared by the two catalysts are shown in Fig. 7b, and their ECSA are 40.7 and 45.8 m2 gPt−1, respectively, which is similar to the trend of the half-cell test and slightly decreased, due to an inherent reduction in catalyst utilization resulting from the MEA preparation process. Fig. 7c is EIS image, in which the semicircular diameter between the high frequency and the low frequency truly reflects the charge transfer resistance of the cell.28 The results show that the cathode charge transfer resistance of the Pt–Co NWs/C catalyst is lower, indicating that the electrocatalytic activity is higher, which makes the electrochemical reaction easy to occur. | ||
| Fig. 7 The MEA performance of (a) the polarization curves, (b) in situ CV curves and (c) EIS using the Pt–Co NWs/C and the commercial Pt/C as cathode catalysts. | ||
In order to investigate the cell durability of the prepared Pt–Co NWs/C as cathode catalyst, the MEA was operated for 100 hours under 1000 mA cm−2. And every 20 hours, the polarization curve was tested and recorded, which is shown in Fig. 8. Overall, the performance degradation of the MEAs are fast at first and then slow. After 100 h of testing, the voltage of the MEA based on Pt–Co NWs/C cathode electrode reduced to 0.626 V at 1000 mA cm−2, which represents a decline rate of 7.2%. And the maximum power density decreased by 11.5%. In comparison, when using commercial Pt/C as cathode catalyst, the decline rate of single cell is 11.4% (0.653 V to 0.578 V) and 16.1%, respectively. The lower decline rate indicates that the Pt–Co NWs/C catalyst has better durability, due to the lower surface energy of the one-dimensional structure and the more difficult Ostwald ripening than zero-dimensional nanoparticles of commercial Pt/C.
Through this rapid high-producing synthesis strategy, nanowire-structured catalysts can be efficiently obtained, and the performance of single cell is also improved compared with commercial catalyst. However, there is still a very large space for improvement, by changing the carbon supports, using other transition metals as the second phase metal, and ameliorating the preparation process of the MEA. And this method can be used as a reference in actual production.
4 Conclusions
In summary, we have successfully prepared ultrathin Pt–Co NWs using very few materials and an efficient self-assembly synthesis strategy, with a diameter of 2 nm and a length of 30 nm. The preparation of Pt–Co NWs relies on oleylamine as a solvent and surfactant, as well as Cr(CO)6, which is very important as a reducing agent and structure directing agent. And the process from nanoparticles to nanorods to nanowires is accomplished by autocatalytic and directional attachment. In rotating disk electrode (RDE) test, the highly active Pt–Co NWs/C catalyst has good ORR performance with mass activity of 291.4 mA mgPt−1, and its durability is also significantly better than commercial Pt/C catalyst. Moreover, the prepared nanowire catalyst was further used in the preparation of MEA for single cell test. The catalysts we prepared has an initial performance of the maximum power density of 952 mW cm−2 and is much more durable than commercial catalysts. As a result, the one-dimensional nanowire structure Pt–Co alloy can be used as cathode catalyst for PEMFC with high activity and high durability. And more importantly, this efficient and simple preparation method can be expanded in grams to achieve large-scale manufacturing, which provides a reference for production.Conflicts of interest
There are no conflicts to declare.Acknowledgements
This project is supported by the National Key Research and Development Program of China (2018YFB1502700), the Key Scientific Research Project in Universities of Henan Province (20A150021) and the Plan for Scientific Innovation Talent of Henan Province (174100510015).References
- O. Z. Sharaf and M. F. Orhan, An overview of fuel cell technology: fundamentals and applications, Renewable Sustainable Energy Rev., 2014, 32, 810 CrossRef CAS.
- L. Bu, Y. Feng, J. Yao, S. Guo, J. Guo and X. Huang, Facet and dimensionality control of Pt nanostructures for efficient oxygen reduction and methanol oxidation electrocatalysts, Nano Res., 2016, 9, 2811 CrossRef CAS.
- J. Wang, B. Li, D. Yang, H. Lv and C. Zhang, Preparation optimization and single cell application of PtNi/C octahedral catalyst with enhanced ORR performance, Electrochim. Acta, 2018, 288, 126 CrossRef CAS.
- Q. Shao, K. Lu and X. Huang, Platinum Group Nanowires for Efficient Electrocatalysis, Small Methods, 2019, 3, 1800545 CrossRef.
- L. Huang, X. Zhang, Q. Wang, Y. Han, Y. Fang and S. Dong, Shape-control of Pt–ru nanocrystals: tuning surface structure for enhanced electrocatalytic methanol oxidation, J. Am. Chem. Soc., 2018, 140, 1142 CrossRef CAS PubMed.
- L. Bu, J. Ding, S. Guo, X. Zhang, D. Su, X. Zhu, J. Yao, J. Guo, G. Lu and X. Huang, A general method for multimetallic platinum alloy nanowires as highly active and stable oxygen reduction catalysts, Adv. Mater., 2015, 27, 7204 CrossRef CAS PubMed.
- Y.-J. Wang, W. Long, L. Wang, R. Yuan, A. Ignaszak, B. Fang and D. P. Wilkinson, Unlocking the door to highly active ORR catalysts for PEMFC applications: polyhedron-engineered Pt-based nanocrystals, Energy Environ. Sci., 2018, 11, 258 RSC.
- H. Du, S. Luo, K. Wang, M. Tang, R. Sriphathoorat, Y. Jin and P. K. Shen, High-Quality and Deeply Excavated Pt3Co Nanocubes as Efficient Catalysts for Liquid Fuel Electrooxidation, Chem. Mater., 2017, 29, 9613 CrossRef CAS.
- J. Wang, B. Li, X. Gao, D. Yang, H. Lv, Q. Xiao, S. K. Kær and C. Zhang, From rotating disk electrode to single cell: exploration of PtNi/C octahedral nanocrystal as practical proton exchange membrane fuel cell cathode catalyst, J. Power Sources, 2018, 406, 118 CrossRef CAS.
- W. Wang, F. Lv, B. Lei, S. Wan, M. Luo and S. Guo, Tuning nanowires and nanotubes for efficient fuel-cell electrocatalysis, Adv. Mater., 2016, 28, 10117 CrossRef CAS PubMed.
- H. Lv, J. Wang, Z. Yan, B. Li, D. Yang and C. Zhang, Carbon-supported Pt-Co Nanowires as a Novel Cathode Catalyst for Proton Exchange Membrane Fuel Cells, Fuel Cells, 2017, 5, 635 CrossRef.
- Y. Zhu, L. Bu, Q. Shao and X. Huang, Subnanometer PtRh Nanowire with Alleviated Poisoning Effect and Enhanced C–C Bond Cleavage for Ethanol Oxidation Electrocatalysis, ACS Catal., 2019, 9, 6607 CrossRef CAS.
- Y. Lu, S. Du and R. Steinberger-Wilckens, One-dimensional nanostructured electrocatalysts for polymer electrolyte membrane fuel cells—A review, Appl. Catal., B, 2016, 199, 292 CrossRef CAS.
- J. Pei, J. Mao, X. Liang, Z. Zhuang, C. Chen, Q. Peng, D. Wang and Y. Li, Ultrathin Pt–Zn nanowires: high-performance catalysts for electrooxidation of methanol and formic acid, ACS Sustainable Chem. Eng., 2017, 6, 77 CrossRef.
- W. Gong, Z. Jiang, R. Wu, Y. Liu, L. Huang, N. Hu, P. Tsiakaras and P. K. Shen, Cross-double dumbbell-like Pt–Ni nanostructures with enhanced catalytic performance toward the reactions of oxygen reduction and methanol oxidation, Appl. Catal., B, 2019, 246, 277 CrossRef CAS.
- S. Mourdikoudis and L. M. Liz-Marzan, Oleylamine in nanoparticle synthesis, Chem. Mater., 2013, 9, 1465 CrossRef.
- J. Mao, W. Chen, D. He, J. Wan, J. Pei, J. Dong, Y. Wang, P. An, Z. Jin, W. Xing, H. Tang, Z. Zhuang, X. Liang, Y. Huang, G. Zhou, L. Wang, D. Wang and Y. Li, Design of ultrathin Pt–Mo–Ni nanowire catalysts for ethanol electrooxidation, Sci. Adv., 2017, 3, 8 Search PubMed.
- K. Jiang, D. Zhao, S. Guo, X. Zhang, X. Zhu, J. Guo, G. Lu and X. Huang, Efficient oxygen reduction catalysis by subnanometer Pt alloy nanowires, Sci. Adv., 2017, 3, 2 Search PubMed.
- B. Y. Xia, H. B. Wu, Y. Yan, X. W. Lou and X. Wang, Ultrathin and ultralong single-crystal platinum nanowire assemblies with highly stable electrocatalytic activity, J. Am. Chem. Soc., 2013, 135, 9480 CrossRef CAS PubMed.
- Q. Xiao, M. Cai, M. P. Balogh, M. M. Tessema and Y. Lu, Symmetric growth of Pt ultrathin nanowires from dumbbell nuclei for use as oxygen reduction catalysts, Nano Res., 2012, 5, 145 CrossRef CAS.
- H. Huang, K. Li, Z. Chen, L. Luo, Y. Gu, D. Zhang, C. Ma, R. Si, J. Yang, Z. Peng and J. Zeng, Achieving remarkable activity and durability toward oxygen reduction reaction based on ultrathin Rh-doped Pt nanowires, J. Am. Chem. Soc., 2017, 139, 8152 CrossRef CAS PubMed.
- H. Xu, J. Wei, M. Zhang, C. Wang, Y. Shiraishi, J. Guo and Y. Du, Solvent-mediated length tuning of ultrathin platinum–cobalt nanowires for efficient electrocatalysis, J. Mater. Chem. A, 2018, 6, 24418 RSC.
- T. Chen, J. Kang, D. Zhang and L. Guo, Ultralong PtNi alloy nanowires enabled by the coordination effect with superior ORR durability, RSC Adv., 2016, 6, 71501 RSC.
- L. Bu, S. Guo, X. Zhang, X. Shen, D. Su, G. Lu, X. Zhu, J. Yao, J. Guo and X. Huang, Surface engineering of hierarchical platinum–cobalt nanowires for efficient electrocatalysis, Nat. Commun., 2016, 7, 11850 CrossRef CAS.
- R. Sriphathoorat, K. Wang and P. Shen, Trimetallic Hollow Pt–Ni–Co Nanodendrites as Efficient Anodic Electrocatalysts, ACS Appl. Energy Mater., 2019, 2, 961 CrossRef CAS.
- W. Xia, A. Mahmood, Z. Liang, R. Zou and S. Guo, Earth-abundant nanomaterials for oxygen reduction, Angew. Chem., Int. Ed., 2016, 55, 2650 CrossRef CAS PubMed.
- M. Li, Z. Zhao, T. Cheng, A. Fortunelli, C. Chen, Y. Huang and X. Duan, Ultrafine jagged platinum nanowires enable ultrahigh mass activity for the oxygen reduction reaction, Science, 2016, 354, 1414 CrossRef CAS PubMed.
- B. Li, J. Wang, X. Gao, C. Qin, D. Yang, H. Lv, Q. Xiao and C. Zhang, High performance octahedral PtNi/C catalysts investigated from rotating disk electrode to membrane electrode assembly, Nano Res., 2019, 12, 281 CrossRef CAS.
| This journal is © The Royal Society of Chemistry 2020 |

