DOI:
10.1039/C9RA10677D
(Paper)
RSC Adv., 2020,
10, 6297-6305
Two groups of copperII pyridine–triazole complexes with “open or close” pepper rings and their in vitro antitumor activities†
Received
18th December 2019
, Accepted 24th January 2020
First published on 11th February 2020
Abstract
Based on 1,2-dimethoxyphenyl (veratrole, open) and 1,2-methylenedioxyphenyl (pepper ring, close)-derived pyridine–triazole analogues, two groups of copper(II) complexes, namely, Group I(C1–C3) and Group II(C4–C6) were synthesized and fully characterized. All ligands and complexes were tested in vitro by MTT assays on seven tumour cell lines (T24, Hep-G2, Sk-Ov-3, MGC-803, HeLa, A549 and NCI-H460) and one normal liver cell line (HL-7702). Surprisingly, the pepper-ring-derived complexes (C4–C6) showed significantly enhanced cytotoxicity compared with the 1,2-bimethoxyphenyl ring-derived complexes (C1–C3) and the standard anticancer drug cisplatin. Cellular uptake assays indicated that the Cu accumulation was consistent with cytotoxicity. In addition, flow cytometry and western blot analysis showed that the apoptosis of the leading complex C4 may be induced by the Bcl-2 family-mediated proteins through the mitochondrial dysfunction pathway. Furthermore, UV-vis and fluorescence spectroscopy assays revealed that C4 has stronger insertion-binding interactions with CT-DNA than C1 and the fluorescence of C1 and C4 with BSA is mainly quenched by static quenching.
Introduction
Cisplatin, the most effective and widely used anti-tumour drug, is a precedent for the research on metal-based drugs. Despite its great success, side effects such as nephrotoxicity and neurotoxicity have seriously affected its application.1 Therefore, many attempts have been made to find more effective and less toxic alternative metal-based drugs to cisplatin.2–6 Among the non-platinum drugs, copper-based complexes have gained increasing attention owing to the diverse fascinating biological analogue ligands that can be linked to the metal centre in its different binding modes.7 Besides the metal itself, the ligand is very important in regulating the activity of the complex; even the partial modification of the ligand's structure may play a crucial role in the biological activity.8
In the past decades, heterocyclic derivatives based on 1,2-dimethoxybenzene (veratrole) have shown promising antitumor activities.9 For example, nordihydroguaiaretic acid (NDGA, Fig. 1) was traditionally used as a herbal medicine to treat many diseases in the United States and had also shown effective anti-tumour activities.10 However, when ingested at higher doses, it exhibits serious hepatotoxicity and nephrotoxicity, which may be associated with NDGA use and is likely linked to NDGA bio-activation to a reactive ortho-quinone.11 Therefore, a more active compound, terameprocol, was synthesized by the methylation of NDGA (Fig. 1), which exhibited a promising anti-tumour effect in phase I/II clinical trials.12 1,2-Methylenedioxybenzene, namely pepper rings, is another active molecule that has a similar structure, and it can be found in many natural bioactive products such as alkaloids and flavonoids. Among them, Inder Pal Singh and co-workers reviewed the structure–activity relationship of piperine (Fig. 1), a simple alkaloid isolated from the seeds of Piper nigrum and its derivatives.13 Likewise, its derivatives have attracted significant attention because of their potent inhibition towards hMAO-A and hMAO-B as well.14 In addition, Farzana Shaheen and co-workers reported a new series of piperazine-modified organotin(IV) complexes that could induce the death of cancerous cells at low doses.15 In spite of the important role of these two similar groups (“open and close”) in medicinal chemistry, the coordination and synthesis of these ligands with metal-based centres have not been widely explored so far.
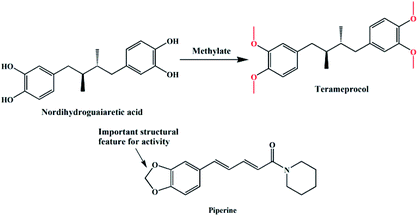 |
| | Fig. 1 Structures of nordihydroguaiaretic acid, terameprocol and piperine. | |
In this study, two groups of pyridine–triazole copperII complexes modified with 1,2-dimethoxyphenyl (open) and 1,2-methylenedioxyphenyl (close) were synthesized and characterized. The cytotoxicities of ligands L1/L2 and the two groups of complexes were evaluated against various cancer cell lines and a normal cell line. Significant antitumor activities were observed for Group II compared to Group I. In addition, the mechanism of action of the most active complex C4 (Group II-1,2-methylenedioxyphenyl-modified) against T24 cells was studied. The ability of C1 (Group I-1,2-dimethoxyphenyl-modified) and C4 to interact with BSA and DNA was investigated and compared as well.
Results and discussion
Synthesis and general characterization
The synthesis of L1 and L2 (Fig. 2) was carried out following a previously reported method.16 L1 or L2 was reacted with different copper(II) salts (CuSO4, CuCl2, and Cu (NO3)2) in similar ratios in a Teflon-lined stainless steel vessel at 85 °C; after slow cooling of the reaction mixture, the corresponding crystals were obtained. The detailed synthesis methods are described in the ESI.† The obtained complexes were structurally characterized by the single-crystal X-ray diffraction technique, which showed that C1–C2 and C4–C5 were mononuclear structures, while C3, C6 were binuclear structures. All the structures are shown in Fig. 3. A summary of the crystallographic data and refinement details is presented in Table S1;† parts of selected bond lengths and angles are listed in Table S2.† Herein, it is worth noting that the ligand L1 undergoes nitrification during the synthesis of C3, resulting in an isomerized copper complex.
 |
| | Fig. 2 The molecular structures of L1 and L2. | |
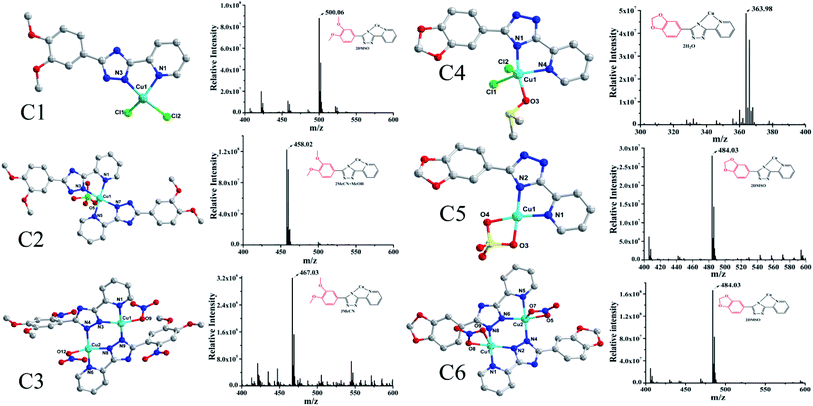 |
| | Fig. 3 The structures of the two groups of complexes (Group II, left), (Group I, right) and their corresponding mass spectra. | |
Stability of complexes
Prior to in vitro evaluation, the stability of all the complexes was measured by UV-Vis absorption spectroscopy in a buffer solution (Tris–HCl/NaCl, 5 mM Tris–HCl and 50 mM NaCl, pH = 7.35, 1% DMSO) at 37 °C. As shown in Fig. S11,† there is no significant change in the position of the absorption bands and no new absorption peaks appear, indicating that all the complexes retain a stable structure in the biological milieu.
In vitro cytotoxicity assay
In this experiment, the inhibitory effects of the ligands L1/L2 and two groups of complexes against seven tumor cell lines were tested by MTT assays, in which cisplatin was used as a control. All the complexes exhibited consistent sensitivity towards T24, Hep-G2, Sk-Ov-3, MGC-803, A549 and NCI-H460 cancer cells as compared to the corresponding ligands L1/L2 (Table 1). Interestingly, it was found that all the complexes in Group II (C4–C6) showed better activity than the complexes in Group I (C1–C3) (with IC50 values in the range of 3.45–8.59 μM vs. 43.60–96.66 μM), exhibiting the same binding pattern as metal ions in solutions (Fig. 3, Cu–L1). In addition, the complexes were much more active than cisplatin in the tested cell lines. In other words, the anti-tumour activity of 1,2-methylenedioxyphenyl-modified copperII complexes may be influenced after substitution by 1,2-methylenedioxyphenyl, which was found to be consistent with that reported for Au(III) complexes.17 In addition, it was indicated from the IC50 values of Group II complexes (C4–C6) that the exchange of zwitterions or the influence of mono/di-nuclear ions had a negligible effect on their activity under the same coordination mode of combination in the solution, which further demonstrated the importance and the key role of the pepper ring substitution of pyridine triazole in the copper complexes.
Table 1 IC50 (μM) of L1/L2 and the activity of two groups of complexes against different cancer cell lines. Cells were treated for 24 h
| Compound |
T24 |
Hep-G2 |
Sk-Ov-3 |
803 |
HeLa |
A549 |
NCI-H460 |
HL-7702 |
| L1 |
>100 |
>100 |
>100 |
>100 |
>100 |
>100 |
>100 |
>100 |
| L2 |
>100 |
>100 |
>100 |
>100 |
>100 |
>100 |
>100 |
>100 |
| C1 |
88.05 ± 2.61 |
89.85 ± 5.21 |
78.54 ± 4.12 |
90.39 ± 7.21 |
95.13 ± 5.92 |
76.06 ± 3.68 |
83.65 ± 4.45 |
92.13 ± 6.97 |
| C2 |
91.36 ± 5.92 |
91.11 ± 8.83 |
86.85 ± 3.69 |
91.02 ± 5.12 |
94.73 ± 4.02 |
78.58 ± 7.64 |
92.78 ± 4.48 |
94.16 ± 5.68 |
| C3 |
43.60 ± 2.68 |
75.19 ± 5.32 |
56.85 ± 3.08 |
92.12 ± 4.37 |
59.66 ± 2.51 |
64.02 ± 3.25 |
96.66 ± 4.76 |
64.07 ± 3.74 |
| C4 |
3.45 ± 0.03 |
4.23 ± 0.03 |
4.04 ± 0.03 |
4.34 ± 0.03 |
5.23 ± 0.02 |
4.17 ± 0.05 |
4.75 ± 0.10 |
5.54 ± 0.08 |
| C5 |
5.46 ± 0.05 |
5.98 ± 0.13 |
6.11 ± 0.40 |
6.41 ± 0.13 |
4.98 ± 0.10 |
7.42 ± 0.04 |
8.59 ± 0.18 |
6.00 ± 0.31 |
| C6 |
3.53 ± 0.29 |
3.58 ± 0.21 |
3.81 ± 0.05 |
4.30 ± 0.10 |
3.57 ± 0.08 |
5.26 ± 0.20 |
5.27 ± 0.15 |
3.96 ± 0.32 |
| Cisplatin |
22.90 ± 0.93 |
19.64 ± 1.39 |
14.41 ± 0.43 |
29.46 ± 1.23 |
13.55 ± 2.63 |
21.31 ± 2.74 |
11.70 ± 2.26 |
13.42 ± 1.56 |
Cellular uptake
Considering the structural similarity and biological activity, we chose C1 and C4 for further comparison and analysis. The cellular uptake of C1 and C4 in T24 cells was investigated using inductively coupled plasma mass spectrometry (ICP-MS), which can detect the level of intracellular Cu distribution in the cells. Nuclear, membrane, mitochondrial and cytoplasm fractions were extracted using a commercial kit as described in the Experimental section. In general, the total accumulation of Cu in the T24 cells treated with C4 was higher than that in those treated with C1 irrespective of whether for 24 h or 48 h (Fig. 4), which was consistent with the relationship between the cellular uptake and in vitro cytotoxicities of C1 and C4. However, C1 and C4 were mainly retained in the cytoplasm of the T24 cells after 24 h treatment. Similar trends were also obtained after 48 h treatment of the cells. Except that, the remaining Cu of C4 mainly accumulated in the mitochondrial fraction (6.16 nmol/106 cells) at 24 h, whereas it showed preference towards the nuclei (6.65 nmol/106 cells) at 48 h.
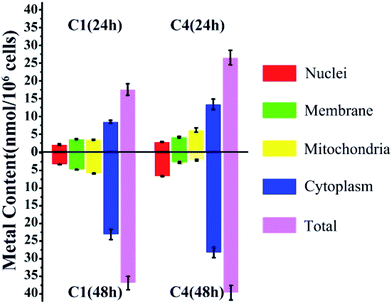 |
| | Fig. 4 Cellular accumulation of C1 and C4 in T24 cells for 24 h and 48 h. The data represent the content of Cu in different fractions. | |
Cell cycle analysis
To investigate the effect of C1/C4 on cell cycle arrest, flow cytometry was used to analyze the DNA content of the T24 cells stained with propidium iodide (PI). As shown in Fig. 5, upon the exposure of the cells to C1/C4 for 24 h, the percentage of the cells in the G0/G1 phase decreases from 45.95% to 36.52% for C4. In contrast, the population of cells in the G2/M phase increased on treatment with C4 (34.76%, 5.3 μM) in comparison to that for the control (17.58%, 0 μM), which confirmed that the enrichment of the G2/M phase of the T24 cells may result in apoptosis by disrupting the cell cycle. At the same concentration, C1 showed no effect on the cell cycle (Fig. S1†).
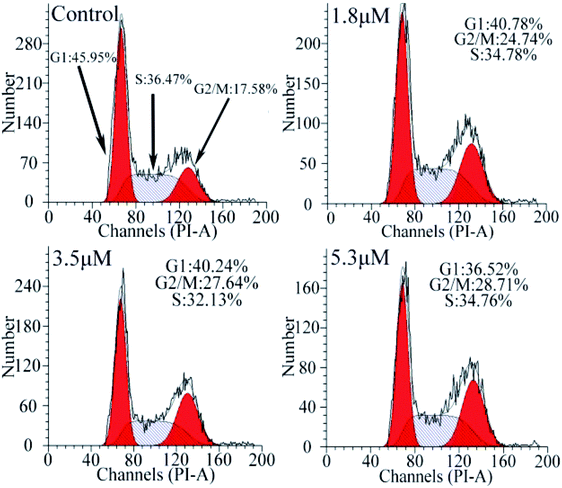 |
| | Fig. 5 Analysis of the cell cycle arrest by flow cytometry in T24 cells after 24 h treatment with C4. | |
Cellular apoptosis
The cell apoptosis induced by C1/C4 was analyzed by flow cytometry using Annexin-V FITC/PI dual staining. As shown in Fig. 6, the treatment of the T24 cells with C4 for 24 h results in significant increase in the population of early apoptotic cells with the values ranging from 1.79% to 77.80% when the concentration increases to 5.3 μM, while 95.5% of the T24 cells survive for the control. C1 showed a negligible effect on the T24 cells (Fig. S2†). These results confirmed that C4 could lead to cell death through a high incidence of apoptosis, which was consistent with the results of MTT assays.
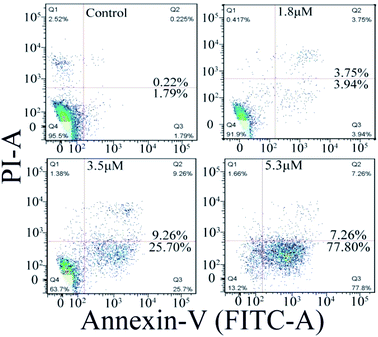 |
| | Fig. 6 Apoptosis of T24 cells induced by C4 detected using flow cytometry after 24 h. | |
Intracellular ROS and Ca2+ level analysis
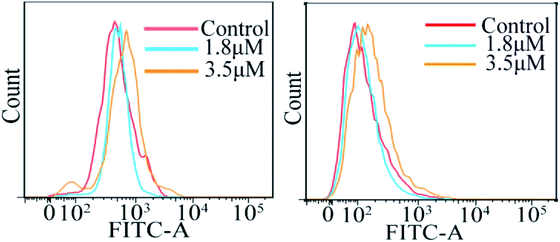
The accumulation of reactive oxygen species (ROS) in cells plays a crucial role in the initiation and regulation of apoptosis; it can damage DNA through oxidative stress and disrupt the mitochondrial membrane potential, thereby causing mitochondrial dysfunction.18–20 According to the results of ICP-MS, C4 exhibited a higher accumulation in the mitochondria except in the cytoplasm of the T24 cells after 24 h incubation. To evaluate the possibility of C4 causing some damage to the mitochondria, the intracellular ROS levels in T24 cells in the presence of C4 were monitored using a oxidant-sensitive fluorescent probe, dichlorofluorescein–diacetate (DCFH–DA). Fig. 7 shows that the treatment of the T24 cells with C4 (1.8 μM and 3.5 μM) for 24 h slightly shifts the levels as compared to that for the untreated cells, which indicates that C4 partially activates the intracellular ROS levels. In addition, the changes in the calcium ion (Ca2+) content, as the second messenger of cell death signal transduction, have an inextricable relationship with the mitochondrial functions and ROS.21 It is well-known that Ca2+ can induce the opening of the mitochondrial permeability transition pore (MPTP) and the influx of Ca2+, which will cause mitochondrial calcium overload, further promoting mitochondrial damage and apoptosis.22,23 Subsequently, a fluorescent probe Fluo-3 AM was used to detect the intracellular calcium level. As shown in Fig. 7, when the T24 cells are exposed to C4 at 3.5 μM for 24 h, only weak deviated peaks appear, indicating that the level of intracellular Ca2+ is slightly promoted by C4, which is consistent with the ROS level.
 |
| | Fig. 7 Analysis of reactive oxygen species level and calcium release by flow cytometry in T24 cells after 24 h treatment with C4. | |
Measurement of mitochondrial membrane potential (MMP)
In general, the change in mitochondrial membrane permeability and uneven distribution of protons will decrease its potential (Δψ), which is considered to be an important signal in the early apoptotic process.24 Therefore, once the mitochondrial membrane potential changes, it indicates the irreversible apoptosis of cells. To investigate the effect of C4 on the mitochondrial membrane potential, the JC-1 probe was used to investigate the effects of C4 on the mitochondrial membrane potential of the T24 cells. As shown in Fig. 8, the treatment of the T24 cells with C4 for 24 h at different concentrations leads to a distinct decrease in MMP from 5.39% (control) to 35.1% (5.3 μM), which proves that C4 can act on mitochondria and further induce cell apoptosis.
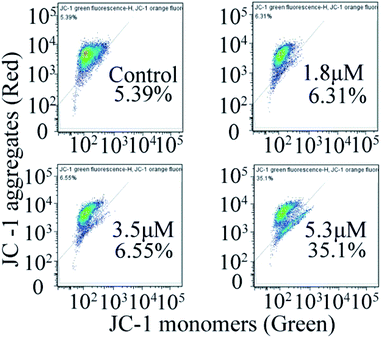 |
| | Fig. 8 Measurement of mitochondrial membrane potential by flow cytometry in T-24 cells after 24 h treatment with C4. | |
Caspase 3/8/9 activation assay
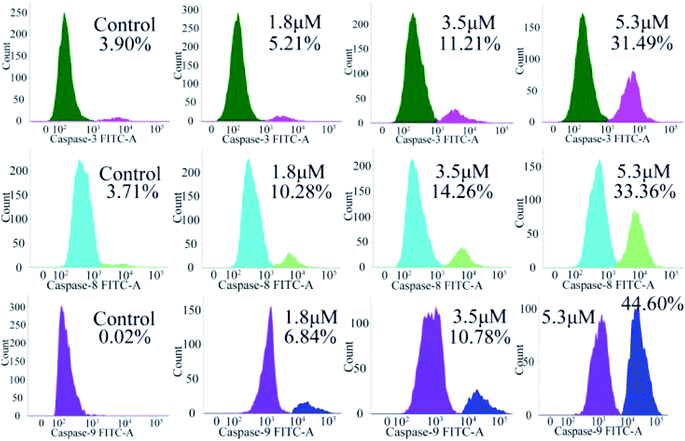
Encouraged by the considerable mitochondrial dysfunction capacity of C4, we further evaluated the expression of caspase family proteins, especially caspase-3/8/9, which play a crucial role in the regulation and activation of cell apoptosis triggered by the mitochondria-mediated pathway. Among them, the conversion of zymogen procaspase-3 to caspase-3 can catalyze the hydrolysis of hundreds of protein substrates; once activated, caspase-3 causes a series of unavoidable cascades downstream, finally leading to apoptosis.25–27 In addition, caspase-9 is an apoptotic promoter that is involved in the mitochondrial apoptotic pathway and activated on a multi-protein activation platform.28 Caspase-8 is another protease, which also plays a key role in death receptor-induced programmed cell death involved in the initiation and execution of apoptosis.29 Therefore, the activated caspase-3/8/9 were analyzed by flow cytometry. As shown in Fig. 9, caspase-3/8/9 are all significantly activated after treatment with C4 for 24 h as compared to the control: from 3.90% to 31.49% for caspase-3, from 3.71% to 33.36% for caspase-8 and from 0.02% to 44.60% for caspase-9. Intriguingly, the amount of the activated caspase-9 increased significantly, suggesting a more pronounced effect on the mitochondrial pathway. Overall, these results suggested that both intrinsic and extrinsic pathways were activated, which finally caused the apoptosis of the T24 cells.
 |
| | Fig. 9 Determination of activated caspase-3/8/9 in T-24 cells treated with C4 for 24 h. | |
Western blot
Apoptosis induced by mitochondrial dysfunction is always accompanied with the release of pro-apoptotic factors, for example, cytochrome c and apoptosis-inducing factor (AIF), and it is regulated by the Bcl-2 family proteins.30,31 In this study, the expressions of apoptosis-associated proteins Bcl-2 (anti-apoptotic protein) and Bax (pro-apoptotic protein) were measured by using western blot analysis. The results showed that the expression levels of Bax, cytochrome c and Apaf-1 progressively increased when the T24 cells were treated with C4 at the concentrations of 1.8 μM and 3.5 μM, whereas the expression level of Bcl-2 decreased (Fig. 10). Based on the results of the mitochondrial membrane potential and caspase assays, we can conclude that the Bcl-2 family proteins regulate the permeability of the mitochondrial membrane,32–34 leading to the decrease in the mitochondrial membrane potential, release of cytochrome c and further binding with APAF-1, caspase-3 activation and finally cell apoptosis.
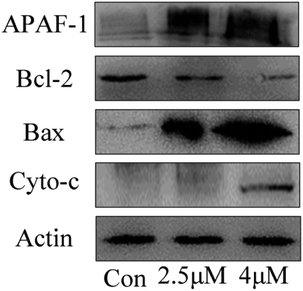 |
| | Fig. 10 The expression level of apoptosis-related proteins of T24 cells after 24 h treatment. | |
BSA binding studies
UV-vis absorption studies. According to the results of ICP-MS (Fig. 4), the content of Cu in C4 in the nucleus increased after 48 h of interaction with T24 cells. To explore the interaction ability of C1/C4 with DNA/BSA, UV-vis absorption and fluorescence emission spectroscopy techniques were used. In general, the UV-vis absorption spectra show two main characteristic absorption bands at 203 nm and 278 nm for the BSA molecule, which are related to the peptide bond and π–π* transition of tryptophan residues, respectively.35–37 As shown in Fig. 11, the band shape of BSA remains unchanged with the gradual addition of complexes. In addition, a significant reduction in absorption is observed at 203 nm, which is associated with the α-helical conformation of BSA, while the band strength at 278 nm decreases slightly. These results reveal that a certain transformation occurs in the α-helical conformation of BSA and tiny changes in the microenvironment of tryptophan residues are caused by the presence of C1 and C4.
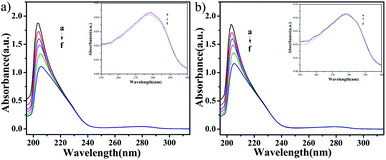 |
| | Fig. 11 The UV-visible absorption spectra of BSA (10−6 M) in the absence and presence of different concentrations of C1 and C4. The concentration of complexes was varied from 0 to 10 × 10−8 M. | |
Fluorescence characteristics
The fluorescence of BSA is mainly generated by the 212-positioned tryptophan residue (Trp) when excited at 280 nm. The fluorescence quenching spectra for the interaction between compounds and BSA are shown in Fig. 12. It can be observed that the fluorescence intensity of BSA regularly decreases as the amounts of C1 and C4 increase gradually at a constant BSA concentration. Simultaneously, the peak shape did not change significantly, and the position did not show a red-shift or blue-shift. These results indicated a certain interaction between the complex and BSA, which resulted in the fluorescence quenching of BSA. The fluorescence quenching was analysed using a linear Stern–Volmer equation to further understand the quenching mechanism:
Here, F0 is the fluorescence intensity of the quencher before the addition of the quencher, F is the fluorescence intensity after the addition of the quencher, [Q] is the quencher concentration, τ0 is the average fluorescence lifetime when no quencher is added (τ0 = 10−8 s),38 kq is the bimolecular quenching rate constant, and KSV is the Stern–Volmer quenching constant. Therefore, a plot of F0/F vs. [Q] yields the Stern–Volmer curve (Fig. 12). Based on its slope, the values of kq and KSV can be derived (Table 2), giving the hierarchy of C4 > C1. In total, the fluorescence quenching rate constant kq is in the order of 1013, which is much greater than the maximum quenching rate constant of dynamic quenching: 2.0 × 10¹² L mol−1 S−1.39 Therefore, the fluorescence of BSA is mainly quenched by static quenching.
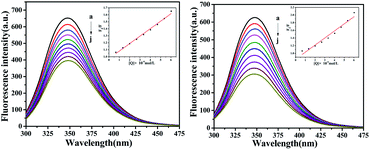 |
| | Fig. 12 The emission titration of BSA (10−6 M) system in the presence of increasing concentrations of C1 and C4. From a to j, the concentrations of complexes were varied from 0 to 6.0 × 10⁻⁶ M. Inset: plot of F0/F versus [complexes]. | |
Table 2 The Stern–Volmer quenching constants of BSA by C1 and C4
| System |
Quenching rate |
Ksv |
Kq |
R2 |
SD |
| BSA-C1 |
39.73% |
1.07 × 10⁵M−1 |
1.07 × 10¹³ M−1 |
0.9909 |
0.0032 |
| BSA-C4 |
51.43% |
1.85 × 10⁵M−1 |
1.85 × 10¹³ M−1 |
0.9617 |
0.0047 |
DNA binding studies
Electronic absorption titration. In general, UV-vis spectroscopy can provide a clear understanding of the interaction between a compound and DNA. It is generally known that the binding of a metal complex to DNA can cause hypochromism and a red-shift, which involves a strong stacking interaction of the intercalative mode.40–42 As shown in Fig. 13, it can be observed that by keeping the concentration of the complexes constant, the absorption intensity of the complexes decreases regularly while increasing the concentration of CT-DNA gradually. The hypochromism intensity of the corresponding C1 is less than that of C4, which suggests that C4 and CT-DNA may have a certain degree of insertion, thereby enhancing the stability of the CT-DNA double helix structure.
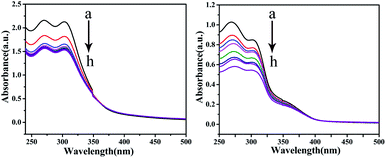 |
| | Fig. 13 The absorption spectra of CT-DNA in the absence and presence of C1 and C4 (10−7 M) at room temperature. The arrow shows the absorption changes on increasing the DNA concentration. | |
Fluorescence quenching studies
To further investigate the interaction mode of C1 and C4 with DNA, a GelRed fluorescent probe was used in this competitive binding experiment. Generally, when a small molecule combines with DNA, GelRed will be substituted from the double helix structure of DNA; synchronously, the fluorescence emission intensity of the DNA-GelRed system will be a part of the quenching, which reflects whether the compound interacts with DNA in an insertion or non-insertion mode. Fig. 14 shows the emission spectra of the system in the presence of C1 and C4. The intensity of the strong DNA-GelRed emission peak decreases with the gradual addition of complexes, indicating that the complexes can replace a considerable number of Gel-Red molecules in the GelRed-DNA system under competition. In other words, C1 and C4 could interact with DNA in the insertion mode, and C4 showed more intensive binding affinity than C1. Subsequently, the linear Stern–Volmer equation was used to calculate the quenching constant:
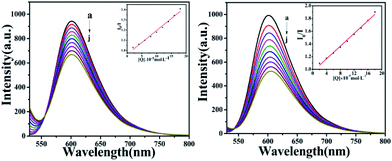 |
| | Fig. 14 The fluorescence quenching curves of GelRed bound to DNA by C1 and C4 (0–1.8 × 10⁻⁴ M) at room temperature. Inset: plot of I0/I versus [complexes]. | |
The calculated quenching constants (KSV) are listed in Table 3, indicating C4 > C1. Furthermore, it can be seen from the illustration that the fluorescence quenching curves of the complexes are straight lines, which is in accordance with the classical theory of fluorescence quenching, further demonstrating that they are inserted between DNA base pairs with an insertion effect similar to GelRed.
Table 3 Fluorescence quenching constant of GelRed bound to DNA by C1 and C4
| Complex |
Extent of quenching |
KSV |
R2 |
SD |
| C1 |
29.43% |
2.36 × 10³ M−1 |
0.9964 |
0.0023 |
| C4 |
47.43% |
5.01 × 10³ M−1 |
0.9930 |
0.0026 |
Experimental
Materials and methods
All chemicals were obtained from commercial sources and used as received. Bovine serum albumin (BSA) and 3-(4,5-dimathylthiazol-2-yl)-2,5-diphenyltetrazolium bromide (MTT) were obtained from Sigma, and CT-DNA was purchased from Solarbio. The Annexin V-FITC/PI apoptosis detection kit, ROS assay kit, Ca2+ assay kit and JC-1 assay kits were obtained from BD Biosciences. All buffer solutions were prepared with double-distilled water. The fluorescence spectra and electronic absorption spectra were collected on an RF-5301 fluorescence spectrophotometer and Cary 60 UV-Visible spectrophotometer, respectively. ESI-MS spectra were recorded using a Bruker HCT Electrospray Ionization Mass Spectrometer. Cell cycle and apoptosis experiments were performed on FACS Aria II flow cytometry (BD Biosciences, San Jose, USA).
Crystal determination and refinement
The diffraction data of C1–C6 were obtained on an Agilent Technologies SuperNova diffractometer using Mo-Kα radiation (λ = 0.71073 Å) at 293(2) K. The structures were solved by direct-methods using SHELXS-97,38 and the refinements were carried out by a full-matrix least-squares method on F2 using SHELXL-97.39 All non-hydrogen atoms were refined anisotropically. Further crystallographic data are provided in Table S1,† and selected bond lengths and angles for C1–C6 are listed in Table S2.† The CCDC reference numbers for the complexes C1–C6 are 1968191, 1968192, 1968190, 1968193, 1968194 and 1968195, respectively.†
Cell lines
All cells were obtained from Shanghai Cell Bank of the Chinese Academy of Sciences and cultured in RPMI 1640 and DMEM (Gibco) (containing 10% FBS (Gibco), 1% streptomycin) at 37 °C in a CO2 incubator (5%). All biological experiment details are shown in the ESI.†
Conclusions
In conclusion, we reported the synthesis and anti-tumour activities of two groups of 1,2-dimethoxyphenyl and 1,2-methylenedioxyphenyl-derived pyridine triazole analogue copperII complexes. MTT assays revealed that Group II complexes (C4–C6) showed significant activities than Group I complexes (C1–C3) towards a panel of human cancer cells regardless of the composition of solvent molecules or ionic species. The cellular uptake assay suggested that C4 (Group II) accumulated preferentially in the mitochondria of the T24 cells. Further mitochondrial dysfunction assays showed that C4-induced apoptosis may mainly be mediated by the change in the permeability of the mitochondrial membrane through the Bcl-2 protein family, resulting in a decreased mitochondrial membrane potential, release of Ca2+ and generation of reactive oxygen species, finally activating the initiation of caspase family and leading to cell apoptosis. UV-vis and fluorescence spectroscopy assays revealed that C4 showed more stronger insertion binding interactions with CT-DNA than C1 and the fluorescence of C1 and C4 with BSA was mainly quenched by static quenching.
Conflicts of interest
The authors declare no conflict of interest.
Acknowledgements
This work was supported by the National Natural Science Foundation of China (No. 21861005), the Guangxi Natural Science Foundation of China (2016GXNSFFA380010), and the Foundation of Key Laboratory for Chemistry and Molecular Engineering of Medicinal Resources (CMEMR2018-C15, CMEMR2016-A11).
References
- S. Ghosh, Bioorg. Chem., 2019, 88, 102925 CrossRef CAS PubMed.
- Z. G. Wang, N. Wang, S. C. Cheng, K. Xu, Z. Q. Deng, S. Chen, Z. F. Xu, K. Xie, M. K. Tse, P. Shi, H. Hirao, C. C. Ko and G. Y. Zhu, Chem, 2019, 5, 3151–3165 CAS.
- K. B. Huang, F. Y. Wang, T. T. Zou, Z. F. Chen, Y. C. Liu, Y. N. Liu and H. Liang, Chem. Commun., 2019, 55, 13066–13069 RSC.
- L. L. Ma, X. D. Lin, C. Li, Z. F. Xu, C. Y. Chan, M. K. Tse, P. Shi and G. Y. Zhu, Inorg. Chem., 2018, 57, 2917–2924 CrossRef CAS PubMed.
- Y. F. Zhong, H. Zhang, G. Mu, W. T. Liu, Q. Cao, C. P. Tan, L. N. Ji and Z. W. Mao, Inorg. Chem. Front., 2019, 6, 2817–2823 RSC.
- Q. P. Qin, Z. F. Wang, X. L. Huang, M. X. Tang, Z. H. Luo, S. L. Wang, B. Q. Zou and H. Liang, Dalton Trans., 2019, 48, 15247–15254 RSC.
- B. L. Fei, S. Y. Tu, Z. Z. Wei, P. P. Wang, J. Y. Long, C. H. Qiao and Z. F. Chen, Dalton Trans., 2019, 48, 15646–15656 RSC.
- A. Çapci, M. M. Lorion, H. Wang, N. Simon, M. Leidenberger, M. C. B. Silva, D. R. M. Moreira, Y. P. Zhu, Y. Q. Meng, J. Y. Chen, Y. M. Lee, O. Friedrich, B. Kappes, J. G. Wang, L. Ackermann and S. B. Tsogoeva, Angew. Chem., Int. Ed., 2019, 58, 13066–13079 CrossRef PubMed.
- M. H. Hsu, S. C. Wu, K. C. Pao, I. Unlu, J. N. Gnabre, D. E. Mold, R. C. C. Huang and J. R. Hwu, ChemMedChem, 2014, 9, 1030–1037 CrossRef CAS PubMed.
- R. W. McDonald, W. Bunjobpon, T. Liu, S. Fessler, O. E. Pardo, I. K. Freer, M. Glaser, M. J. Seckl and D. J. Robins, Anti-Cancer Drug Des., 2001, 16(6), 261–270 CAS.
- L. C. S. Huang, H. Chuang, M. Kapoor, C. Y. Hsieh, S. C. Chou, H. H. Lin, Y. W. Chen, C. C. Chang, J. R. Hwu, Y. C. Liang and M. H. Hsu, RSC Adv., 2015, 5, 107833–107838 RSC.
- X. Li, J. H. Jiang, Q. Q. Chen, S. X. Xiao, C. H. Li, H. W. Gu, H. Zhang, J. L. Hu, F. H. Yao and Q. G. Li, Eur. J. Med. Chem., 2013, 62, 605–613 CrossRef CAS PubMed.
- I. P. Singh and A. Choudhary, Curr. Top. Med. Chem., 2015, 15, 1722–1734 CrossRef CAS PubMed.
- D. Chavarria, C. Fernandes, V. Silva, C. Silva, E. Gil-Martins, P. Soares, T. Silva, R. Silva, F. Remião, P. J. Oliveira and F. Borges, Eur. J. Med. Chem., 2020, 185, 111770 CrossRef CAS PubMed.
- F. Shaheen, M. Sirajuddin, S. Ali, Z. Rehman, P. J. Dyson, N. AliShah and M. N. Tahir, J. Organomet. Chem., 2018, 856, 13–22 CrossRef CAS.
- F. P. Huang, P. F. Yao, H. Y. Li, Q. Yu, H. D. Bian and H. Liang, Chem. Commun., 2015, 51, 7598–7601 RSC.
- C. C. Zeng, S. H. Lai, J. H. Yao, C. Zhang, H. Yin, W. Li, B. J. Han and Y. J. Liu, Eur. J. Med. Chem., 2016, 122, 118–126 CrossRef CAS PubMed.
- V. R. Fanjul, E. L. Torres, M. A. Mendiola and A. M. Pizarro, Eur. J. Med. Chem., 2018, 148, 372–383 CrossRef PubMed.
- S. T. Xu, H. Yao, S. S. Luo, Y. K. Zhang, D. H. Yang, D. H. Li, G. Y. Wang, M. Hu, Y. Y. Qiu, X. M. Wu, H. Q. Yao, W. J. Xie, Z. S. Chen and J. Y. Xu, J. Med. Chem., 2017, 60, 1449–1468 CrossRef CAS PubMed.
- J. J. Lemasters, T. P. Theruvath, Z. Zhong and A. L. Nieminen, Biochim. Biophys. Acta, 2009, 1787, 1395–1401 CrossRef CAS PubMed.
- N. Mnatsakanyan, G. Beutner, G. A. Porter, K. N. Alavian and E. A. Jonas, J. Bioenerg. Biomembr., 2017, 49, 13–25 CrossRef CAS PubMed.
- S. Y. Gao, Q. J. Wang and Y. B. Ji, World J. Gastroenterol., 2006, 12(21), 3359–3367 CrossRef CAS PubMed.
- Y. Tsujimoto, T. Nakagawa and S. Shimizu, Biochim. Biophys. Acta, 2006, 1757, 1297–1300 CrossRef CAS PubMed.
- J. J. Ma, X. Ni, Y. L. Gao, K. Huang, J. A. Liu, Y. Wang, R. F. Chen and C. F. Wang, Med. Chem. Commun., 2019, 10, 465–477 RSC.
- R. F. George, M. A. Fouad and I. E. O. Gomaa, Eur. J. Med. Chem., 2016, 112, 48–59 CrossRef CAS PubMed.
- M. O. Hengartner, Nature, 2000, 407, 770–776 CrossRef CAS PubMed.
- B. Kim, S. K. Srivastava and S. H. Kim, Expert Opin. Ther. Targets, 2015, 19(1), 113–127 CrossRef CAS PubMed.
- G. Fianco, C. Contadini, A. Ferri, C. Cirotti, V. Stagnia and D. Barilà, Int. J. Mol. Sci., 2018, 19, 3798 CrossRef PubMed.
- T. Miura, M. Tanno and T. Sato, Cardiovasc. Res., 2010, 88, 7–15 CrossRef CAS PubMed.
- H. Kashkar, K. Wiegmann, B. Yazdanpanah, D. Haubert and M. Kronke, J. Biol. Chem., 2005, 280, 20804–20813 CrossRef CAS PubMed.
- N. Popgeorgiev, L. Jabbour and G. Gillet, Front. Cell Dev. Biol., 2018, 6, 13 CrossRef PubMed.
- J. M Adams and S. Cory, Trends Biochem. Sci., 2001, 26, 61–66 CrossRef.
- A. J. G. Sáez, Cell Death Differ., 2012, 19, 1733–1740 CrossRef PubMed.
- K. Liu, H. Yan, G. L. Chang, Z. Li, M. J. Niu and M. Hong, Inorg. Chim. Acta, 2017, 464, 137–146 CrossRef CAS.
- R. Liu, W. S. Zong, K. K. Jin, X. T. Lu, J. H. Zhu, L. J. Zhang and C. Z. Gao, Spectrochim. Acta, Part A, 2008, 70, 198–200 CrossRef PubMed.
- O. S. Wolfbeis, M. Leiner and P. Hochmuth, Ber. Bunsenges. Phys. Chem., 1986, 88, 759–767 CrossRef.
- R. X. Su, W. Qi, Z. M. He, Y. B. Zhang and F. M. Jin, Food Hydrocolloids, 2008, 22, 995–1005 CrossRef CAS.
- J. R. Lakowicz and G. Weber, Biochemistry, 1973, 21, 4161–4170 CrossRef PubMed.
- W. R. Ware, J. Phys. Chem., 1962, 66, 455–458 CrossRef CAS.
- M. Hong, G. L. Chang, R. Li and M. J. Niu, New J. Chem., 2016, 40, 7889–7900 RSC.
- Z. G. Hong, X. M. Zhang, T. X. Wu, C. Zheng, B. Luo, J. Tang, F. P. Huang, D. Yao and H. D. Bian, Polyhedron, 2019, 159, 355–364 CrossRef CAS.
- Y. G. Wu, D. B. Wang, J. J. Hu, X. Q. Song, C. Z. Xie, Z. Y. Ma and J. Y. Xu, Inorg. Chem. Front., 2019, 6, 1040–1049 RSC.
Footnote |
| † Electronic supplementary information (ESI) available. CCDC 1968190–1968195. For ESI and crystallographic data in CIF or other electronic format see DOI: 10.1039/c9ra10677d |
|
| This journal is © The Royal Society of Chemistry 2020 |
Click here to see how this site uses Cookies. View our privacy policy here.  Open Access Article
 b,
Hong Lianga,
ZhenFeng Chen*a and
FuPing Huang
 *a
*a


