 Open Access Article
Synthesis of gemini ammonium sulfobetaine and its proppant suspension and gel-breaking mechanisms
Tao Wanga,
Jianhong Xiaoa,
Lushan Wanga,
Aiqing Maa,
Mimi Tianb and
Chen Wang *b
*b
aResearch Institute of Petroleum Engineering Technogoly, Sinopec Shengli Oilfield, Dongying 257001, China
bKey Laboratory of Auxiliary Chemistry & Technology for Chemical Industry, Ministry of Education, Shaanxi University of Science & Technology, Xi'an 710021, P. R. China. E-mail: wangchenhg@sust.edu.cn; Tel: +86-29-86168830
First published on 24th February 2020
Abstract
In this study, gemini ammonium sulfobetaine (GAS) is designed and synthesized using isophorone diisocyanate connecting the ammonium sulfobetaines (AS) to obtain a viscoelastic surfactant exhibiting better viscosification and salt resistance. AS is prepared using the monomers of erucic acid, N-dimethyl-1,3-propanediamine, and 3-chloro-2-hydroxypropanesulfonic acid sodium. The properties of GAS and its proppant suspension as well as the gel-breaking mechanisms are investigated. The critical micelle concentration of GAS is 2.1 × 10⁻⁷ mol mL−1. GAS exhibits good salt resistance, and the viscosity is considerably high under acidic conditions. At 0.5 Hz, the storage modulus G′ of GAS is 60, 120, and 640 mPa when the concentration is 0.3, 0.5, and 1.0 wt%, respectively. Its proppant suspension is optimal under acidic conditions. When the pH is high, the setting velocities are clearly observed to increase. When the pH is 12, the rate of decline is more than 50% after 200 min. Some of the worm-like micelles adsorbed on the proppant surface participate in the formation of the three-dimensional network, appropriately supporting the proppant-carrying performance. When potassium permanganate is used as the gel breaker, the characterization of the GAS gel-breaking liquid indicates that the double bond is disintegrrated by the gel breaker. Upon gel breaking, the average hydrodynamic radius of the GAS gel-breaking solution decreases to 176.2 nm from 492.3 nm.
Introduction
The studies conducted during the previous decade have revealed that the low-permeability oil and gas reservoirs have abundant oil and gas resources.1,2 Hydraulic fracturing is one of the main stimulation methods for obtaining low-permeability oil and gas reservoirs, which can expand the oil flow channels and improve the formation permeability.3,4 Traditionally, crosslinked polymer gels, linear gels, and polyacrylamide slickwaters in high concentrations are extensively used to fracture sandstone and siltstone formations.5–7 Even though they are cheap and simple to use, they cause serious damage during the fracturing process and do not result in an effective all-inclusive system. These fluids leave insoluble residues during formation as well as plug pore throats that can cause a certain degree of damage with respect to the fracture permeability.8More recently, with the development of viscoelastic surfactants (VESs), their application as a new kind of VES fracturing fluid has become an important research field.9–11 Under different concentrations, the VES molecules form different aggregates, including rod-like micelles, worm-like micelles (WLMs), vesicles, lamellar phases, and liquid crystals. In addition, WLMs are extensively used in fracture packing due to the enhanced viscoelasticity.12–14 The VES fracturing fluids exhibit many excellent properties, including low formation damage, simple preparation, and absence of residue.15,16 WLMs, which are linear aggregates formed by the self-assembly of the surfactants, entangle with each other to form dynamic three-dimensional network-like structures at suitable concentrations, providing significant macroscopic viscoelasticity to the solution.17,18 In general, surfactants, organic salts, and inorganic salts are used as additives to form WLMs. Gerhard Fritz reported a high-viscosity system formed by the C18-tailed anionic surfactant sodium oleate (NaOA) and the cationic surfactant trimethylammonium bromide family (CnTAB);19 the best growth of WLMs can be observed in cationic/anionic mixtures when the system exhibits optimal asymmetry with respect to the surfactant tail lengths. Lu constructed a pH-responsive micellar system exhibiting good viscoelasticity using a single surfactant, N,N-dimethyl oleoamindepropylamine, without any additives.20 The transformation between vesicles and WLMs by adjusting the pH value is considered to be the micromechanism. Recently, the synthesis and study of the applications and properties of the zwitterionic surfactants have become a scientific topic.21,22 The zwitterionic surfactants continue to attract the interest of researchers in the fields of industry and academia owing to their unique properties,23–25 including excellent water solubility, insensitivity to temperature and the presence of salts, good biodegradability, biological safety based on their mildness to skin and eyes, high foam stability, and a synergistic effect in combination with a wide variety of ionic and nonionic surfactants.26
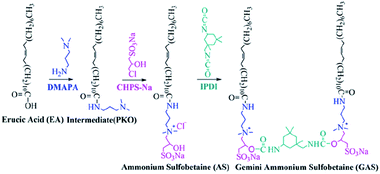
Betaines, which are important zwitterionic surfactants, are extensively used in cosmetics, pesticides, and leather and have been proposed to achieve enhanced oil recovery. Alkyl betaines and their derivatives represent a class of zwitterionic surfactants exhibiting a positive charge on the nitrogen atom and a negative charge on the carboxyl group that exists as electro-neutral internal salts within a wide pH range.27 In this study, erucic acid, N,N-dimethyl-1,3-propanediamine, and 3-chloro-2-hydroxypropanesulfonic have been used to prepare ammonium sulfobetaine (AS). Further, isophorone diisocyanate is used to connect two AS molecules to fabricate gemini ammonium sulfobetaine (GAS). The properties of GAS are investigated based on the surface tension, transmittance, rheology, dynamic light scattering (DLS), and Transmission Electron Microscope (TEM). Subsequently, its proppant suspension mechanism is studied by setting the velocity and SEM. Finally, the mechanism of the gel-breaking process is studied through FT-IR, 1H NMR, DLS, and SEM.
Experimental
Materials
Erucic acid (EA, >99%), N,N-dimethyl-1,3-propanediamine (DMAPA, >99%), 3-chloro-2-hydroxypropanesulfonic acid sodium, and isophorone diisocyanate (IPDI, >99%) were provided by Shaanxi Mingrui Co. Ltd. (Xi'an, China) and were used without any further purification. Dibutyltin dilaurate (DBTDL, >99%), sodium chloride (NaCl, >99%), calcium chloride (CaCl2, >99%), sodium hydroxide (NaOH, >99%), hydrochloric acid (HCl, 10%) and N,N-dimethylformamide (DMF) were purchased from Shanghai No. 1 Chemical Reagent Factory (Shanghai, China). All the solutions were prepared in distilled water.Synthesis of ammonium sulfobetaine (AS)
GAS was synthesized according to the reaction pathway presented in Scheme 1. First, 67.714 g of erucic acid and 0.44 g of toluene-p-sulfonic acid were added to a 500 mL three-necked flask. Then, 20.436 g of N,N-dimethyl-1,3-propane-diamine (1.05 mol) was added dropwise under magnetic stirring, and the temperature was gradually increased to 150 °C. The first product (PKO) was obtained after reaction mixing for 10 h. Then, 105.5 g of PKO and 38 g of 3-chloro-2-hydroxypropanesulfonic acid sodium were added to a solution of water and ethanol. The temperature was gradually increased to 80 °C in a 500 mL three-necked flask under stirring. The second product (AS) was obtained after reaction mixing for 8 h. The product was subsequently washed thrice using petroleum benzine and a solution of water and ethanol to eliminate the unreacted PKO. Unreacted water and ethanol were eliminated by vacuum distillation. The final product was dried in a vacuum oven until a constant weight was obtained.Synthesis of gemini ammonium sulfobetaine (GAS)
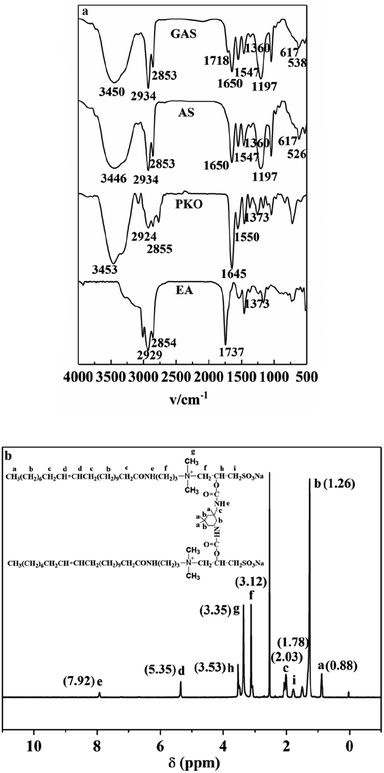
18.46 g of AS and 20.96 g of DMF were added to a 250 mL three-necked flask. Then, 2.5 g of IPDI was added dropwise under magnetic stirring, and the temperature was gradually increased to 45 °C. The product was obtained after reaction mixing for 4 h.Fig. 1a presents the FI-IR spectra of EA, PKO, AS, and GAS. In the spectrum, the intensity ratio of I (2924 cm−1) to I (2855 cm−1) is close to 1![[thin space (1/6-em)]](https://www.rsc.org/images/entities/char_2009.gif) :
:![[thin space (1/6-em)]](https://www.rsc.org/images/entities/char_2009.gif) 1. The reason for this is that both vibrations belong to the stretching vibration of the –CH2– groups, the band at 2855 cm−1 is the symmetric stretching vibration of –CH2– groups, while the absorption band located at 2924 cm−1 is the asymmetric stretching vibration of the –CH2– moiety. Though the stretching vibration of the –CH3 groups may coincide with that of –CH2– groups, their deformation vibration is showed at near 1380 cm−1. Moreover, their existence will also be confirmed in the following 1H NMR spectrum. The characteristic absorption bands of the amide groups (νN–H: 3453 cm−1 and 1550 cm−1; νC
1. The reason for this is that both vibrations belong to the stretching vibration of the –CH2– groups, the band at 2855 cm−1 is the symmetric stretching vibration of –CH2– groups, while the absorption band located at 2924 cm−1 is the asymmetric stretching vibration of the –CH2– moiety. Though the stretching vibration of the –CH3 groups may coincide with that of –CH2– groups, their deformation vibration is showed at near 1380 cm−1. Moreover, their existence will also be confirmed in the following 1H NMR spectrum. The characteristic absorption bands of the amide groups (νN–H: 3453 cm−1 and 1550 cm−1; νC![[double bond, length as m-dash]](https://www.rsc.org/images/entities/char_e001.gif) O: 1645 cm−1) are present in the spectrum of PKO. The characteristic peak due to the functional groups of the second step products is observed at 1197 cm−1 (–SO3– stretching). 617 and 526 cm−1 denote the mid-strong absorption peaks of the sulfonic acid group. The characteristic absorption bands of carbamate (νN–H: 3450 and 1547 cm−1; νC
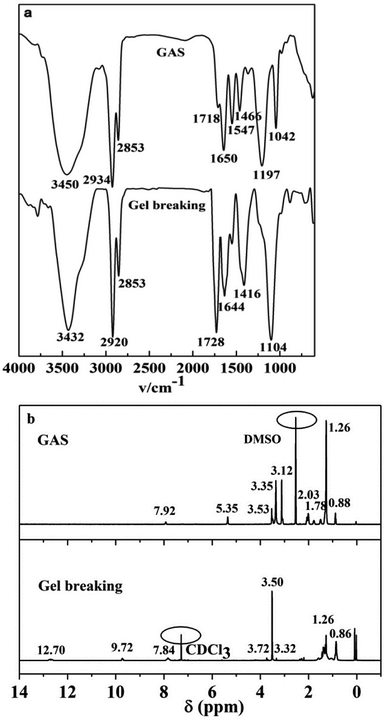
O: 1645 cm−1) are present in the spectrum of PKO. The characteristic peak due to the functional groups of the second step products is observed at 1197 cm−1 (–SO3– stretching). 617 and 526 cm−1 denote the mid-strong absorption peaks of the sulfonic acid group. The characteristic absorption bands of carbamate (νN–H: 3450 and 1547 cm−1; νC![[double bond, length as m-dash]](https://www.rsc.org/images/entities/char_e001.gif) O: 1718 cm−1) are detected in the GAS spectrum. When compared with the FT-IR spectra of PKO and AS, the amide and sulfonic acid groups continue to appear in the GAS spectrum, indicating the successful synthesis of GAS.28
O: 1718 cm−1) are detected in the GAS spectrum. When compared with the FT-IR spectra of PKO and AS, the amide and sulfonic acid groups continue to appear in the GAS spectrum, indicating the successful synthesis of GAS.28
The 1H NMR spectra were recorded on a Bruker Ascend 400 spectrometer at 400 MHz. 1H MNR (400 MHz, DMSO): 0.88 (t, 15H, a), 1.26 (m, 66H, b), 1.78 (m, 4H, i), 2.03 (m, 12H, c), 3.12 (m, 16H, f), 3.35 (s, 12H, g), 3.53 (s, 2H, h), 5.35 (t, 4H, d), 7.92 (t, 4H, e). Based on the spectra, it can be concluded that the target product (GAS) was successfully prepared.
Rheological measurements
The rheological behavior of GAS at different concentrations was evaluated using the Haake rheometer (RS150L, Therm Haake Co., Germany) equipped with a cone and plate measuring unit. The dynamic measurements were conducted in frequencies of 0 to 300 rad s−1. All the measurements were performed within the linear viscoelastic region unless otherwise specified.Dynamic light scattering (DLS) measurements
Multi-angle DLS measurements were performed for the samples at five different scattering angles using a Malvern 4800 photon correlation spectrometer. The GAS sample solutions are filtered through a 450 nm Durapore membrane (Millipore) before testing.Freeze-drying and scanning electron microscope (SEM)
To obtain the micrographs of the GAS hydrogel and the broken gel liquid, they are initially treated using the freeze-drying methods, and the obtained sponge is subsequently examined by SEM (TESCAN, Czech).Proppant suspension measurements
The static suspended proppant experiment was performed using a measuring cylinder. The settling rate of 70 mesh ceramsite was observed in the measuring cylinder. The weight of the ceramsite is 10% of the mass of the solution. Further, the settling height and time of the proppant were recorded in the measuring cylinder.Core permeability damage measurements
The core is selected to conduct and simulate the formation water base permeability test. After the core is saturated, it is put into the core holder, and 3.5 MPa of pressure is applied; a constant-speed and constant-pressure high-precision displacement pump is used for obtaining displacement at a critical flow rate of not more than the critical flow rate of each core until the flow of the liquid at the outlet end of the core holder becomes stable; subsequently, the volume of the liquid to be displaced in unit time is measured. The displacement differential pressure is recorded, and the formation water base permeability is calculated for each core.Results and discussion
CMC
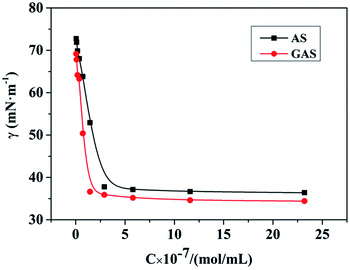
The minimum concentration required for the surfactants to form micelles in water is referred to as the critical micelle concentration (CMC). The surfactants alter the interfacial properties by adsorption at the interface. The surface tension and CMC must be studied to better understand and use the surfactants. The curve of surface tension versus concentration is shown in Fig. 2, indicating that the CMC of the surfactant AS synthesized in the first step is 3.9 × 10⁻⁷ mol mL−1 and that the surface tension in the CMC is 38.11 mN m−1. Then, AS is connected via IPDI, and the CMC of the prepared GAS is 2.1 × 10⁻⁷ mol mL−1. The surface tension at the CMC is 36.58 mN m−1. The CMC of GAS is slightly smaller than half of that of AS, and the surface tension is significantly lower than that of AS. Therefore, GAS exhibits better surface activity.Transmittance
The solubility and reversible solubility are presented in Fig. 3, which are verified by measuring the transmittance. GAS is insoluble, and the system exhibits considerably low light transmittance at room temperature. When the temperature increases to 50 °C, the light transmittance becomes 100% and the solution represents a transparent state. When the temperature decreases from 100 °C to room temperature, the transmittance remains stable at 100%; however, it does not reversibly exhibit turbidity. This occurs because the gemini C22 chains require a high temperature to dissolve. However, once they are soluble, they can form micelles. Furthermore, the apparent viscosities are measured by increasing the temperature. With the dissolution of the gemini C22 chains in the system, the viscosity increases; when they are completely dissolved, the viscosity decreases. However, at 44 °C, another maximum viscosity can be observed at 154.8 mPa s. The first maximum viscosity can be attributed to dissolution, whereas the second maximum viscosity can be attributed to the temperature that promotes multiple WLM entanglements.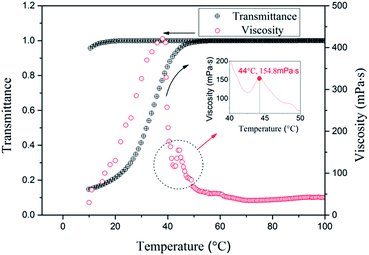 | ||
| Fig. 3 The transmittance and viscosity (rheological behaviors; the shear rate is 1 s−1) of the 1% GAS solution. | ||
Apparent viscosities
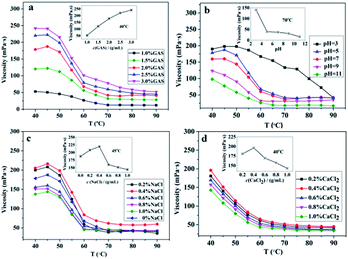
As can be observed from Fig. 4a, upon increasing the temperature, the maximum viscosity can be observed at 45 °C, which may be caused by the maximum hydrophobic interaction and charge balance observed at this temperature. As the mass fraction increases, the viscosity also increases. When the concentration of surfactants is high, the micelles overlap, resulting in increased viscosity of the system. GAS exhibits a certain viscosity at a concentration of 1%, which indicates that GAS forms short rod-like micelles at a lower concentration.Fig. 4b shows the variation of the GAS viscosity with temperature for different pH conditions. As the pH decreases, the viscosity clearly increases, and the temperature resistance is observed to be better under acidic conditions. When the system is acidic, it contains large amount of –SO3H groups and the hydrophobicity is stronger than that when the system is alkaline. Therefore, the viscosity increases because the WLM network is easily wound under acidic conditions.
The NaCl tolerance of GAS is shown in Fig. 4c; as the NaCl concentration increases, the viscosity of GAS increases and subsequently decreases with increasing temperature. The salt tolerance of GAS is shown in Fig. 4d. The viscosity of the system decreases with increasing temperature as the concentration of CaCl2 increases. The low salt concentration may increase the polarity of the aqueous solution and promote the micelle to be wound. The formation of aggregates is increasingly destroyed with increasing salt concentration, resulting in reduced viscosity of the system. Adding too much salt will affect and even destroy the viscoelasticity of the system, affecting the service performance of the system. Thus, the self-assembly behavior of GAS in brine produced good salt-resistant properties.
Rheological behavior
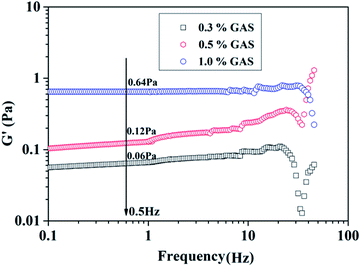
The storage modulus (G′) describes the ability of a material to store the elastic deformation energy; therefore, it is an indicator of the resilience of material after deformation. In Fig. 5, the G′ of different mass concentrations of GAS is presented. The linear region ranges from 0.1 to 20 Hz. The viscoelasticity results denote that the G′ of each GAS mass concentration slightly increases with increasing frequency, and the elastic modulus becomes higher than the viscous modulus. Therefore, the fluid belongs to the class of typical elastic materials, which favor the formation of a proppant suspension. This may be related to the force between micelles and the entanglement of the surfactant micelles. Especially at a frequency of 0.5 Hz, the G′ of GAS is 60, 120, and 640 mPa when the concentration is 0.3, 0.5, and 1.0 wt%, respectively, indicating that higher concentrations of GAS produce structures exhibiting considerable physical crosslinking and a strong associating behavior, which could help to achieve viscoelasticity.Proppant suspension
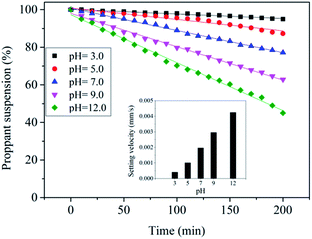
The results are presented in Fig. 6. Fracturing fluids were prepared under different pH conditions; the fluid prepared under acidic conditions exhibits the best proppant suspension property. When the pH is adjusted to high values, the setting velocities clearly increase. When pH = 12, the rate of decline is more than 50% after 200 min. Under acidic conditions, the system contains a considerable number of –SO3H groups and the hydrophobicity is stronger than that of the –SO3Na groups under alkaline conditions. Therefore, the WLM networks are easily entangled, and the proppant-carrying performances of the GAS fracturing fluid are better under acidic conditions.
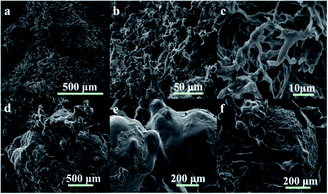 | ||
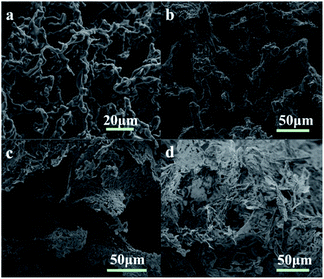
| Fig. 7 Micrographs of the GAS viscoelastic system (2 wt%) and their proppant suspension. (a–c) the networks of 2 wt% GAS;(d–f) WLMs networks with the proppant sands. | ||
Fig. 7d–f show the manner in which the entangled WLMs support the proppant sands. In general, WLM networks are interspersed between the proppant sands (Fig. 7d). Specifically, the proppant is adhered to the elastic–viscous fracturing fluid (Fig. 7e). Some of the WLMs adsorbed on the proppant surface participate in the formation of the three-dimensional network, enhancing the proppant-carrying performance (Fig. 7f).
Gel breaking
Morphological changes of micelles (TEM and DLS)
The DLS results denote the particle diameters and size distributions. The cryo-TEM results intend to clarify the microstructures via different GAS concentrations. The DLS and cryo-TEM of its gel-breaking solution are simultaneously investigated. The molecular state variations of the solutions with different GAS concentrations (and its gel-breaking solution) reflect the evolution of the microstructures in the systems. In Fig. 10, the hydrodynamic diameter, particle size distribution, and microstructure of the GAS aggregates are presented for 0.3, 0.8, and 3.0 wt% GAS.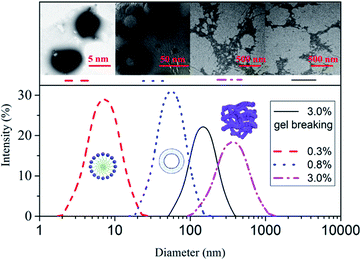 | ||
| Fig. 10 Effect of GAS concentration on the average hydrodynamic diameter of the aggregates at 25 °C. | ||
The average hydrodynamic radius is 9.5 nm when the GAS concentration is 0.3 wt%, indicating the presence of spherical micelles. The average hydrodynamic radius is 45.1 nm when the GAS concentration is increased to 0.8 wt%, and the presence of vesicle micelles is clearly presented. For a GAS concentration of 3.0 wt%, the radius of the particles in the solution progressively increases to 492.3 nm, which is larger than the diameter of the millipores of the filter membrane (450 nm), demonstrating the occurrence of associative behavior at this stage. All the changes have been previously verified using SEM; the micelles transform to vesicles and subsequently to WLMs. The hydrodynamic volumes are enhanced with an increase in the concentration of GAS.
When potassium permanganate is used as the gel breaker for the 2.0% GAS solution, the average hydrodynamic radius of the GAS gel-breaking solution decreases to 176.2 nm. This can be explained by studying the NMR results of the gel-breaking solution. The hydrophobic chains fracture and become shorter due to the strong oxidizing property of potassium permanganate; thus, the associating properties become weaker.
Core permeability damage
Insoluble residuals may result in core plugging. Therefore, the core permeability damage and residual content must be known to test according to the industrial standards of the People's Republic of China (water-based fracturing fluid, SY/T 5107-2005). The residual content is 10.2 mg L−1, and the core permeability damage is 4.36%, meeting the fracturing operation requirements.Conclusions
GAS is designed and synthesized using isophorone diisocyanate connecting the AS to obtain a viscoelastic surfactant exhibiting better viscosification and salt resistance. AS is prepared by synthesizing the monomers of erucic acid, N-dimethyl-1,3-propanediamine, and 3-chloro-2-hydroxypropanesulfonic acid sodium. The properties of GAS and its proppant suspension and gel-breaking mechanisms are studied. The CMC of GAS is 2.1 × 10⁻⁷ mol mL−1. GAS exhibits good salt resistance, and the viscosity is considerably high under acidic conditions. At 0.5 Hz, the G′ of GAS is 60, 120, and 640 mPa when the concentration is 0.3, 0.5, and 1.0 wt%, respectively. The proppant suspension property is the best under acidic condition. When the pH is high, the setting velocities clearly increase. When the pH is 12, the rate of decline becomes more than 50% after 200 min. Some of the WLMs adsorbed on the proppant surface participate in the formation of a three-dimensional network, enhancing the proppant-carrying performance. When potassium permanganate is used as the gel breaker, characterization of the GAS gel-breaking liquid indicates that the double bond was disintegrated by the gel breaker. Upon accomplishing gel breaking, the average hydrodynamic radius of the GAS gel-breaking solution decreases to 176.2 nm.In this work, erucic acid, N,N-dimethyl-1,3-propanediamine, and 3-chloro-2-hydroxypropanesulfonic are used to prepare AS. Further, isophorone diisocyanate is used to connect the two AS molecules for fabricating GAS. The properties of GAS are investigated based on surface tension, transmittance, rheology, DLS, and TEM. The results denote that the CMC of GAS is 2.1 × 10⁻⁷ mol mL−1. GAS exhibits good salt resistance, and the viscosity is considerably high under acidic conditions. At 0.5 Hz, the G′ of GAS is 60, 120, and 640 mPa when the concentration is 0.3, 0.5, and 1.0 wt%, respectively.
The GAS proppant suspension is studied by setting the velocity and SEM. Its proppant suspension is observed to be the best under acidic conditions. At high pH, the setting velocities are observed to clearly increase. When pH = 12, the rate of decline is more than 50% after 200 min. Some of the WLMs adsorbed on the proppant surface participate in the formation of a three-dimensional network, enhancing the proppant-carrying performances.
Finally, the gel-breaking mechanism is studied through FT-IR, 1H NMR, DLS, and SEM. When potassium permanganate is used as the gel breaker, the characterization of the GAS gel-breaking liquid indicates that the double bond is disintegrated by the gel breaker. Upon gel breaking, the average hydrodynamic radius of the GAS gel-breaking solution decreases.
Conflicts of interest
There are no conflicts to declare.Acknowledgements
We would like to express our appreciation to the Natural Science Foundation of China (Grant No. 51603117) and the Science Association of University Talents Promotion Plan in Shaanxi Province (Grant No. 20190604) for financial support.References
- D. B. Bennion, R. F. Bietz, F. B. Thomas and M. P. Cimolai, J. Can. Pet. Technol., 1994, 33, 45–54 CrossRef CAS.
- X. Zhou, L. Zhang and K. Fan, Geol. Rev., 2006, 52, 777–782 Search PubMed.
- J. W. Cosgrove, AAPG Bull., 2001, 85, 737–748 Search PubMed.
- J. F. W. Gale, R. M. Reed and J. Holder, AAPG Bull., 2007, 91, 603–622 CrossRef.
- M. R. Gurluk, H. A. Nasr-El-Din and J. B. Crews, Presented in part at Eage Conference & Exhibition Incorporating Spe Europec, 2013 Search PubMed.
- Q. You, H. Wang, Y. Zhang, Y. Liu, J. Fang and C. Dai, J. Pet. Sci. Eng., 2018, 166 Search PubMed.
- S. Liu, J. Wang, H. He and H. Wang, Nanosci. Nanotechnol. Lett., 2018, 10, 87–93 CrossRef.
- J. Yang, B. Guan, Y. Lu, W. Cui, X. Qiu, Z. Yang and W. Qin, Presented in part at Spe European Formation Damage Conference & Exhibition, 2013 Search PubMed.
- C. Fontana, E. Muruaga, D. R. Perez and G. D. Cavazzoli, Presented in part at Europec/eage Conference and Exhibition, Society of Petroleum Engineers, 2007 Search PubMed.
- M. Y. Zhao, Z. Y. Zhao, Q. Zhao and Y. Yin, Oilfield Chem, 2004, 21, 224–226 Search PubMed.
- Y. Zhao, J. Wang, L. Deng, P. Zhou, S. Wang, Y. Wang, H. Xu and J. R. Lu, Langmuir, 2013, 29, 13457–13464 CrossRef CAS PubMed.
- C. Zonglin, C. A. Dreiss and F. Yujun, Chem. Soc. Rev., 2013, 42, 7174–7203 RSC.
- Y. Lin, X. Han, J. Huang, H. Fu and C. Yu, J. Colloid Interface Sci., 2009, 330, 449 CrossRef CAS PubMed.
- Z. Chu, Y. Feng, X. Su and Y. Han, Langmuir, 2010, 26, 7783–7791 CrossRef CAS PubMed.
- B. Chase, W. Chmilowski, R. Marcinew, C. Mitchell, J. Dang, K. Krauss, E. Nelson, T. Lantz, C. Parham and J. Plummer, Oilfield Rev., 1997, 9, 20–33 CAS.
- P. Bajpai, J. P. Singh, A. Mandal and K. Ojha, Pet. Sci. Technol., 2010, 28, 1750–1760 CrossRef CAS.
- Y. Zhao, J. Wang, L. Deng, P. Zhou, S. Wang, Y. Wang, H. Xu and J. R. Lu, Langmuir, 2013, 29, 13457–13464 CrossRef CAS PubMed.
- F. Chen, Y. Wu, M. Wang and R. Zha, Colloid Polym. Sci., 2015, 293, 687–697 CrossRef CAS.
- S. R. Raghavan, G. Fritz and E. W. Kaler, Langmuir, 2002, 18, 3797–3803 CrossRef CAS.
- H. Lu, L. Wang and Z. Huang, RSC Adv., 2014, 4, 51519–51527 RSC.
- T. Yoshimura, K. Nyuta and K. Esumi, Langmuir, 2005, 21, 2682–2688 CrossRef CAS PubMed.
- M. Yaseen, Y. Wang, T. J. Su and J. R. Lu, J. Colloid Interface Sci., 2005, 288, 361–370 CrossRef CAS PubMed.
- S. Doussin, N. Birlirakis, D. Georgin, F. Taran and P. Berthault, Chemistry, 2006, 12, 4170–4175 CrossRef CAS PubMed.
- M. Yaseen, J. R. Lu, J. R. P. Webster and J. Penfold, Langmuir, 2006, 22, 5825–5832 CrossRef CAS PubMed.
- H. J. Y. El-Aila, J. Surfactants Deterg., 2005, 8, 165–168 CrossRef CAS.
- J. Zajac, C. Chorro, M. Lindheimer and S. Partyka, Langmuir, 1997, 13, 1486–1495 CrossRef CAS.
- C. Delgado, M. D. Merchán, M. M. Velázquez and J. Anaya, Colloids Surf., A, 2006, 280, 17–22 CrossRef CAS.
- F. Billes, I. Mohammed-Ziegler and P. Bombicz, Vib. Spectrosc., 2007, 43, 193–202 CrossRef CAS.
| This journal is © The Royal Society of Chemistry 2020 |

