 Open Access Article
Creative Commons Attribution 3.0 Unported Licence
Effects of electrical-hydrothermal aging degradation on dielectric and trap properties of high temperature vulcanized silicone rubber materials
Huasong Xu,
Congzhen Xie*,
Rui Wang ,
Bin Gou,
Shoukang Luo and
Jiangang Zhou
School of Electric Power, South China University of Technology, Guangzhou 510641, China. E-mail: congzhen168@163.com
First published on 22nd January 2020
Abstract
In this paper, a new aging platform combined the high voltage electric field and the hydrothermal environment was built. To investigate the aging mechanism, physicochemical, dielectric and trap properties of HTV SR before and after electrical-hydrothermal aging for 24 days were discussed. The results indicated that, compared with hydrothermal aging, more cracks and holes appeared on the surface of HTV SR after electrical-hydrothermal aging, and the content of flame retardant decreased significantly. Due to the main chain and side chain scission of PDMS, lots of low weight molecular (LWM) substances and free radicals were produced. And the tensile strength and elongation at break significantly decreased. Various physical and chemical defects appeared in the HTV SR specimen in the process of electrical-hydrothermal degradation, as a result of which, the dielectric constant significantly increased and the peak trap density increased by about 2.5 times compared to the virgin sample. The increase in trap density in turn accelerated the charge accumulation and enhanced the breakdown probability, resulting in the electric field strength decrease from 21.8 kV mm−1 to 16.1 kV mm−1 and severe degradation of HTV SR.
1 Introduction
Composite insulators are widely used in power systems because of their light weight and strong resistance to pollution flashover.1–8 As an important material for the sheaths and sheds of composite insulators, high temperature vulcanized silicone rubber (HTV SR) plays an important role. However, as the operating life increases, the aging problem becomes more and more serious. Due to long-term exposure to the harsh environment, external insulation of composite insulators can suffer from multiple stresses such as electrical discharge, temperature and mechanical stress et al.9–13 In hot and humid areas all over the world, they are also accompanied by the problem of hydrothermal aging. Therefore, it is of great significance to carry out multiple stress aging research on external insulation materials of composite insulators for mastering the aging rule and evaluating the insulation state.Degradation studies of HTV SR have been a topic for research from the last few decades. Z. D. Jia et al.14 studied the thermo-oxidative aging process of HTV SR and calculated the activation energy of the aged specimens. Z. Wang et al.15 investigated the absorption characteristics of HTV SR in deionized water, NaCl solution and HNO3 solution, analyzing the effects of the three liquids on the electrical properties. Mansab Ali and Reuben Hackam16 studied the loss of hydrophobicity of HTV SR after immersion in saline solutions at different temperatures, revealing that the contact angle will decrease sharply during immersion. Yong Zhu et al.17 described the degradation of HTV SR resulting from corona discharges under atmospheric pressure, showing that the corona discharges can cause physical and chemical damages to the surface of HTV SR. Recent studies focus on corona aging, thermal aging, electrical branch aging and other single physical field aging mechanism. Comparative analysis of hydrothermal and electrical-hydrothermal aging has not been reported. However, as sheds of composite insulators, HTV SR has been exposed to multiple stresses, and the aging rate is much higher than the single field aging. Therefore, studying the electrical-hydrothermal aging properties to analyze the aging mechanism is imperative.
In the present work, the aging mechanism of HTV SR exposed to multiple stresses has not been clearly claimed. In this paper, AC breakdown field strength, dielectric spectroscopy, thermally stimulated current (TSC), Fourier transform infrared (FTIR) spectroscopy, scanning electron microscopy (SEM) and energy dispersive X-ray (EDAX) analysis were conducted to analyze changes of electrical characteristics and physical properties after hydrothermal aging and electrical-hydrothermal aging. Subsequently, the mechanism of electrical-hydrothermal aging was analyzed.
2 Experimental details
2.1 Sample preparation
The HTV SR specimen was provided by Dongguan Gaoneng Company in China. It should be emphasized that the composite insulator manufactured by the Dongguan Gaoneng Company has been running successfully in hot and high humidity areas in southern China for nearly 20 years. The formulation of the HTV SR specimen was 100 parts per hundred (phr) methyl vinyl silicone rubber, 40 phr meteorological silica, 125 phr aluminum powder, 6 phr silicone oil, 2 phr vulcanizing agent and some iron oxide colorant. The methyl vinyl silicone rubber, meteorological silica, aluminum powder, silicone oil and colorant are added to an open mill in proportion and mixed uniformly, then heated in an oven at 150 °C for 2 hours and added vulcanizing agent at room temperature. After the vulcanizing agent is mixed in the open mill, the compound is vulcanized and formed on a flat vulcanized machine. Finally, the HTV SR with a diameter of 100 mm and a thickness of 2 mm is prepared. The detailed product information (code, supplier) of each component for the formulation of the HTV SR is listed in Table 1. Outside of China, the similar HTV SR specimen can be easily procured in factories that produce composite insulators. For instance, Mar-Bal company in America, Maschinenfabrik Reinhausen company in German, etc.| Component | Supplier |
|---|---|
| Methylvinyl silicone rubber | Jinjinle Chemical Co., Ltd. China |
| Meteorological silica | Degussa AG, America |
| Aluminum powder | Yuanyang Powder Technology Co., Ltd. China |
| Silicone oil, vulcanizing agent, iron oxide colorant | Gaide Chemical Co., Ltd. China |
2.2 Test apparatus and test method
The experimental set up for investigating the electrical-hydrothermal aging effect is shown in Fig. 1. It is composed of AC power box, rod-plate electrode, quartz tube and heating plate. Saline solutions were prepared as the conductive solution and the salt contaminant. The high voltage electrode, when immersed in the saline solutions, will provide a uniform and stable electric field on the HTV SR. To verify the electric field uniformity, the simulation model was established using the COMSOL and the results were shown in Fig. 2. As shown in Fig. 2, the HTV SR specimens were in a uniform electric field. In the electrical-hydrothermal aging test, the temperature of the heating plate was controlled at 30 °C, 60 °C, 80 °C and the electric field intensity was 0 kV cm−1 (equivalent to hydrothermal aging), 15 kV cm−1 and 25 kV cm−1. For comparison, the temperature of the saline solutions in the hydrothermal aging test was also controlled at 30 °C, 60 °C and 80 °C.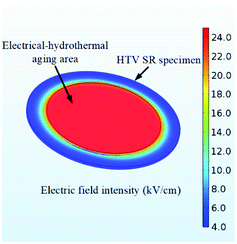 | ||
| Fig. 2 Characteristics of the surface electric field intensity at 25 kV cm−1 on the HTV SR specimen. | ||
2.3 Characterization
 | (1) |
The AC breakdown voltage measurements were performed on the hydrothermal and electrical-hydrothermal aging specimens. In the measurement of AC breakdown voltage, a set of 5 samples with a diameter of 100 mm and a thickness of 2 mm were tested to calculate the breakdown field strength. The experimental setup for the AC breakdown voltage was shown in Fig. 3. The aging specimens are placed in the plate to plate arrangement, and placed into a vessel containing filling with insulation oil to avoid surface discharges. During the test, the voltage is increasing step by step until the breakdown occurs. The voltage was rising at the rate of 500 V s−1. When the breakdown occurs, the AC breakdown stress can be calculated according to the equation E = V/d, where V is the breakdown voltage and d is the thickness of the aging specimen in the breakdown point.
For the investigation of the frequency domain dielectric spectroscopy, the dielectric constant and loss of dielectric materials at different frequencies were analyzed. In this paper, the dielectric spectroscopy of different aging specimens with a diameter of 40 mm and a thickness of 2 mm was measured by ALPHA-ANB type broadband dielectric spectrometer produced by Guangzhou Huayu Electronic Service Co., Ltd. Each HTV SR specimen in the study, the dielectric response in the range of frequency at 100 Hz to 105 Hz was measured at room temperature.
For the measurement of TSC, the HTV SR specimen with a thickness of 2 mm and a diameter of 40 mm were vacuum vaporized with an Au electrode on both sides. Firstly, the HTV SR specimen was loaded between the electrodes and heated to 50 °C. Secondly, the DC voltage of 3 kV was applied to the HTV SR and kept warm for 20 min. Then the HTV to −50 °C quickly with liquid nitrogen. After keeping the temperature at −50 °C and the voltage at 3 kV for 2 min, the polarization voltage can be removed. When the current decays to zero, the specimen can be heated at a rate of 5 °C min−1. In the process, the depolarization current was measured as a function of temperature.
3 Results and discussion
3.1 Relative weight change
Fig. 4 shows the relative weight change of HTV SR after electrical-hydrothermal aging under different electric field intensity at varying temperatures. As shown in Fig. 4, in the absence of an electric field, the weights of HTV SR specimens immersed in saline solutions at 30 °C increased rapidly at first and then slowly increased within 24 days. However, when immersed in saline solutions at 60 °C and 80 °C, the weight of HTV SR increased rapidly and then decreased. This phenomenon might result from the increase of temperature and the invasion of water accelerating the hydrothermal aging effect of the HTV SR specimen. The relative weight change of HTV SR specimen depended on the competition between the invasion of water and the extraction of the low-molecular-weight (LMW) substances and the filler particles. Both process was influenced by water temperature. During the immersion for 24 days at 30 °C, the weight increased because of the invasion of water over counteracted the weight decrease caused by the extraction of the LMW substances and the filler particles. However, at 60 °C and 80 °C, the weight of HTV SR decreased rapidly because the oxidation decomposition of HTV SR specimen and the extraction of the LMW substances and the filler particles over counteracted the weight increase due to the diffusion of water into HTV SR.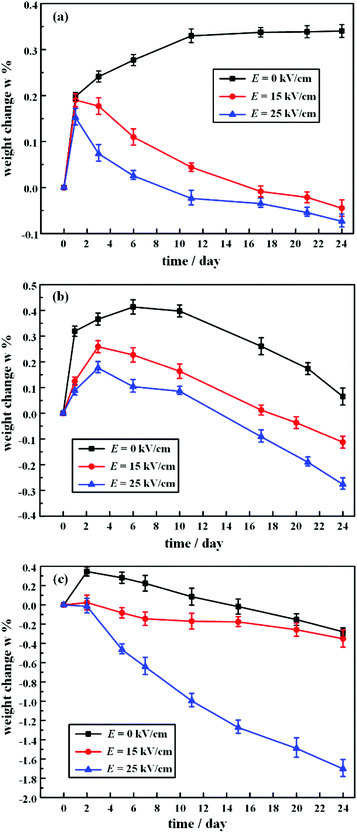 | ||
| Fig. 4 Relative weight change of HTV SR after electrical-hydrothermal aging under different electrical field intensity at (a) 30 °C, (b) 60 °C, and (c) 80 °C. | ||
When considering the electric field, the weight of the HTV SR samples was obviously decreased. With the increase of electric field intensity, the final mass loss rate was significantly higher than that of the HTV SR samples without an electric field. The final relative weight change of the hydrothermal aging samples at 80 °C was 0.27%, while the relative weight change rate reached −1.71% under the 80 °C and 25 kV cm−1 electrical-hydrothermal aging condition. Therefore, there was a synergistic effect of mutual enhancement of electrical-hydrothermal aging process, which significantly accelerated the weight reduction of HTV SR specimens. The presence of an electric field accelerated the hydrothermal aging process, which in turn accelerated the deterioration of the electric field to HTV SR samples.
3.2 AC breakdown studies
The Weibull distribution, proposed by the Swedish physicist Weibull in 1939, has been widely used to represent breakdown voltages.18–20 It reflected the failure probability of a dielectric being broken down at a certain electric field strength E. In this test, the two-parameter Weibull distribution was applied to evaluate the statistical law of the breakdown behavior of HTV SR under alternating electric fields. The function can be expressed as:15| P(E) = 1 − exp(−(E/E0)β) | (2) |
log10(−ln(1 − P(E))) = β![[thin space (1/6-em)]](https://www.rsc.org/images/entities/char_2009.gif) log10 log10![[thin space (1/6-em)]](https://www.rsc.org/images/entities/char_2009.gif) E − β E − β![[thin space (1/6-em)]](https://www.rsc.org/images/entities/char_2009.gif) log10 log10![[thin space (1/6-em)]](https://www.rsc.org/images/entities/char_2009.gif) E0 E0
| (3) |
To find the value of P(E), the Bernard estimator was given by ref. 21,
 | (4) |
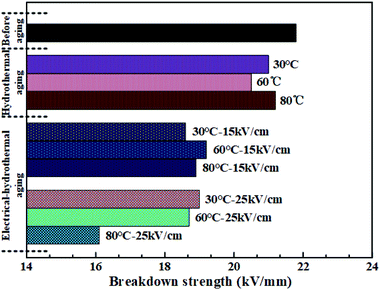
The AC breakdown characteristic of all samples under Weibull distribution is presented in Fig. 5. According to eqn (3), the value of the shape parameter β was calculated and listed in Table 2. Coppard22 et al. believed that the shape parameter β represented the distribution of defects and filling particles. However, as seen in Table 2, the value of β did not show obvious regularity but presented a great fluctuation. It indicated that there were complex reactions in HTV SR after hydrothermal and electrical-hydrothermal aging processes. Due to high temperature and high electric field, severe degradation occurred in HTV SR and various physical and chemical defects were produced. Therefore, the change in the shape parameter β showed large variation in dispersity of electrical weak points in the aging samples. Then the value of breakdown field strength under different aging conditions is shown in Fig. 6. As shown in Fig. 6, compared to the virgin sample and hydrothermal aging sample, the breakdown field strength of the electrical-hydrothermal (80 °C – 25 kV cm−1) sample was significantly decreased from 21.8 kV mm−1 to 16.1 kV mm−1. It indicated that there was obvious synergistic aging effect of electric, water and temperature. The change of breakdown field strength caused by electrical-hydrothermal aging was much greater than that caused by hydrothermal aging. The combined effect significantly accelerated the decrease of breakdown field strength. To further explore the combined aging effect, the microscopic analysis was studied below.
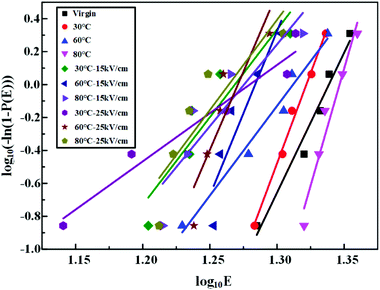 | ||
| Fig. 5 Curve of the Weibull statistical distribution of the breakdown field strength of before and after aging samples. | ||
| Sample | Virgin | Hydrothermal aging (°C) | Electrical-hydrothermal aging (°C – kV cm−1) | |||||||
|---|---|---|---|---|---|---|---|---|---|---|
| 30 | 60 | 80 | 30–15 | 60–15 | 80–15 | 30–25 | 60–25 | 80–25 | ||
| Shape parameter β | 17.0 | 21.9 | 10.9 | 28.5 | 10.6 | 19.9 | 9.9 | 5.9 | 19.0 | 10.9 |
3.3 Physicochemical properties and mechanical properties analysis
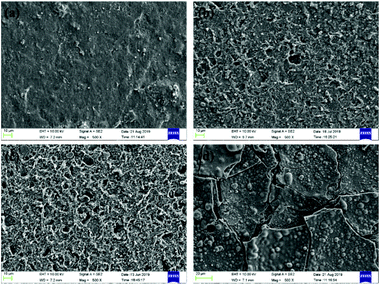 | ||
| Fig. 8 SEM photos of HTV SR specimens after electrical-hydrothermal aging at varying temperature under 25 kV cm−1 for 24 days: (a) virgin HTV SR, (b) 30 °C, (c) 60 °C, (d) 80 °C. | ||
To examine the cross-sections of the HTV SR, SEM photos of specimens aging in different conditions to verify the depth of the damage was presented in Fig. 9. It indicated that the cross-sections of the virgin HTV SR was relatively smooth and presented little cracks, holes and particles compared to the aging samples. Then the cross-section of the HTV SR specimen became rough after hydrothermal aging. With the addition of electric field, a large number of microscopic cracks and holes appeared in the HTV SR specimen in Fig. 9(c). It can be concluded that the electrical-hydrothermal aging degradation occurred not only on the surface but also in the interior. However, the degradation on the surface showed much more serious than the interior. It indicated that the initial deterioration process began on the surface of the samples.
At the same time, EDAX was conducted to recognize the elements present over the HTV SR surface. Fig. 10 presents the EDAX of the virgin HTV SR (spectrum 1) and the electrical-hydrothermal aged (80 °C – 25 kV cm−1) HTV SR (spectrum 2). Because the test mainly studied the variation rules of surface elements on HTV SR after electrical-hydrothermal aging, various trace elements in the filler were neglected. As shown in Fig. 10, silicon (Si), carbon (C), oxygen (O) and aluminum (Al) were the main elements on the surface of the HTV SR specimen. After electrical-hydrothermal aging (80 °C – 25 kV cm−1) for 24 days, the content of elements C and Al decreased significantly. It represented the side chain scission of PDMS molecules, and the LMW substances would be extracted, resulting in a decline of C content. Moreover, Al content was also significantly reduced due to acidic substances generated by discharge. The generated acidic substances would react with the flame retardant aluminum hydroxide. The analysis could be further proved in the FTIR below.
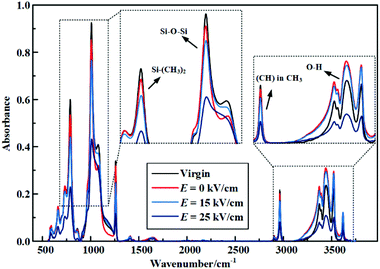 | ||
| Fig. 11 FTIR of HTV SR before and after electrical-hydrothermal aging at 80 °C for 24 days (varying electric field intensity). | ||
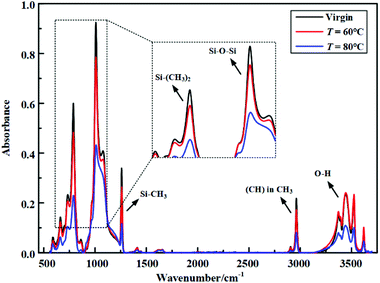 | ||
| Fig. 12 FTIR of HTV SR before and after electrical-hydrothermal aging at 25 kV cm−1 for 24 days (varying temperature). | ||
| Bond | Wave number/cm−1 |
|---|---|
| O–H | 3700–3200 |
| (C–H) in CH3 | 2960 |
| Si–CH3 | 1270–1255 |
| Si–O–Si | 1100–1000 |
| Si–(CH3)2 | 840–790 |
3.4 Frequency response analysis
In this section, the data of 80 °C and 15 kV cm−1 after electrical-hydrothermal aging for 24 days were selected for analysis. Fig. 15(a) and (b) shows the change of dielectric constant and the dielectric loss of HTV SR at varying temperature after electrical-hydrothermal aging at 15 kV cm−1 for 24 days.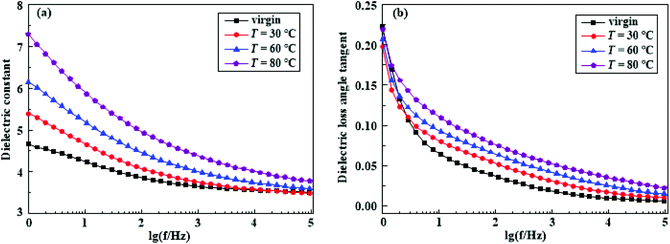 | ||
| Fig. 15 The dielectric constant (a) and the dielectric loss angle tangent (b) of HTV SR before and after electrical-hydrothermal aging at 15 kV cm−1 for 24 days (varying temperature). | ||
As shown in Fig. 15(a), it indicated that the dielectric constant of the aging samples in the whole frequency range significantly increased with the rise of temperature, especially at low frequency. However, in the high frequency band (104 Hz to 105 Hz), the curve tended to a constant, which might be caused by electron polarization or molecular chain vibration of HTV SR media under the influence of the electric field. Fig. 15(b) shows that the dielectric loss of HTV SR specimen increased with the rise of temperature in the middle and high frequency band, while in the low frequency band, the dielectric loss of the electrical-hydrothermal aging samples was lower than that of the initial samples.
This phenomenon can be attributed to the following aspects. First of all, according to Debye relaxation theory, the dielectric loss of HTV SR samples at low frequency band is mainly caused by the DC conductance loss. With the increase of frequency, the polarization loss of different relaxations tends to play an important role and gradually becomes dominant. Secondly, in literature,27 the dielectric properties of silicone rubber sleeve were measured by the non-contact dielectric spectrum, and the various relaxation processes of silicone rubber were analyzed in detail by using the modified Cole–Cole model. The polarization processes were divided into macroscopic interface polarization, microscopic interface polarization and dipole polarization. Considering that the contact dielectric spectrum was selected in this test, the macroscopic interface polarization process can be neglected. Therefore, the dielectric loss of silicone rubber samples was mainly caused by the microscopic interface polarization and dipole polarization. According to the SEM analysis, the polarization loss at the microscopic interface enlarged with the increase of physical and chemical defects such as holes and cracks on the surface of HTV SR and the loss of packing. Combined with the infrared spectrum characteristics, it can be seen that the rise of temperature aggravated the damage degree of the molecular main chain and decomposed to produce more LMW substances, leading to the increase of dipoles and dipole polarization loss.
Fig. 16(a) and (b) shows the change of dielectric constant and the dielectric loss of HTV SR under different electric field intensity after electrical-hydrothermal aging at 80 °C for 24 days. As seen in Fig. 16(a), the dielectric constant behave similarly for the HTV SR of the aged and the virgin sample, and increased with decreasing frequency. Especially in the low frequency band, the increase became faster because of the space charge polarization or the effect of interfacial polarization. Due to the appearance of various physical and chemical defects on the surface and inside of HTV SR, as well as the increase of particles shown by SEM results, the interface polarization was significantly enhanced. The highest observed values (dielectric constant) were for the samples after electrical-hydrothermal aging at 80 °C – 25 kV cm−1. As compared to the virgin sample, there was an obvious increase in dielectric constant almost along the entire frequency range for hydrothermal and electrical-hydrothermal aged HTV SR specimen. This might be due to the increase in mobility of the polymer chains by the breakage of bonds caused by applied electric and hydrothermal stress.
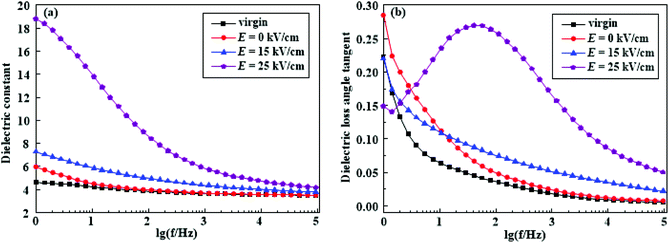 | ||
| Fig. 16 The dielectric constant (a) and the dielectric loss angle tangent (b) of HTV SR before and after electrical-hydrothermal aging at 80 °C for 24 days (varying electric field intensity). | ||
As regards the dielectric loss angle tangent, in Fig. 16(b), it presented different and interesting phenomenon. In the middle frequency region (10 Hz to 103 Hz), there was an obvious dielectric loss peak in the HTV SR specimen after electrical-hydrothermal aging at 80 °C – 25 kV cm−1 for 24 days. It might be caused by the orientation of greater dipolar groups. A large amount of broken PDMS molecular chains led to the increase of free radicals in the material and the enhancement of dipole polarization, presenting the apparent loss peak in the dielectric frequency response. However, in the low frequency region, the dielectric loss angle tangent of the electrical-hydrothermal aging samples showed different change rules. Because there was another dielectric relaxation process in the dielectric loss curve at low frequency band in addition to the DC conductivity,27 and they worked together in the low frequency region of the dielectric loss curve.
3.5 Trap properties analysis
It is commonly acknowledged that the aging performance of the polymer material is related to the accumulation of space charge or the trap characteristics. Fig. 17 shows the TSC curve of unaged, the hydrothermal aged and electrical-hydrothermal aged samples. In order to analyze trap properties, the amount of trap charge can be calculated by eqn (5). Then the amount of trap charge, the peak current and the peak current temperature can be listed in Table 3.
 | (5) |
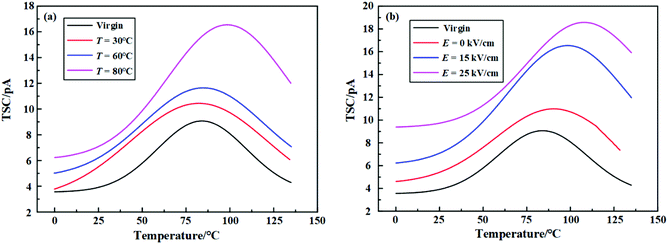 | ||
| Fig. 17 TSC measurement before and after electrical-hydrothermal aging for 24 days: (a) E = 15 kV cm−1, varying temperature; (b) T = 80 °C, varying electric field intensity. | ||
As shown in Fig. 17, it indicated that the TSC curve of all HTV SR samples presented a main current peak. With the increase of the temperature or the electric field strength of electrical-hydrothermal aging, the peak current increased continuously and tended to drift towards the high temperature region. As listed in Table 4, the trap charge of the electrical-hydrothermal aging samples was significantly more than that of the unaged and after hydrothermal aged samples. Similarly, the trap charge also increased with the rising temperature and electric field strength. Because there were more physical and chemical defects generated in the HTV SR specimen, and the deterioration degree was deepened, which led to the increase of trap and trap charge.
| Sample | Virgin | Hydrothermal aging (°C) | Electrical-hydrothermal aging (°C – kV cm−1) | |||||||
|---|---|---|---|---|---|---|---|---|---|---|
| 30 | 60 | 80 | 30–15 | 60–15 | 80–15 | 30–25 | 60–25 | 80–25 | ||
| Q (nC) | 9.60 | 9.96 | 10.80 | 11.17 | 12.24 | 13.80 | 18.24 | 15.00 | 16.56 | 21.36 |
| Peak current (pA) | 9.07 | 9.15 | 9.36 | 10.98 | 10.44 | 11.64 | 16.50 | 12.55 | 12.69 | 18.57 |
| Peak temperature (°C) | 84.01 | 78.97 | 75.49 | 90.35 | 82.35 | 84.84 | 98.49 | 94.45 | 97.38 | 107.73 |
However, it is almost difficult to obtain the trap density and trap energy level distribution of the HTV SR specimen directly before and after aging from Fig. 17. According to the TSC theory, the TSC caused by the de-trapping process of the captured charges can be expressed as the following function:28
 | (6) |
![[thin space (1/6-em)]](https://www.rsc.org/images/entities/char_2009.gif) exp(−Et/kT) is the emission rate of electrons at trap level E and temperature T. k is the Boltzmann constant, d is the sample thickness and β is the heating rate. v is commonly called the frequency factor or attempt-to-escape frequency, typically 1012 s−1 as suggested by Mott.29 Ev and Ec are the valence band top energy and conduction band bottom energy, respectively.
exp(−Et/kT) is the emission rate of electrons at trap level E and temperature T. k is the Boltzmann constant, d is the sample thickness and β is the heating rate. v is commonly called the frequency factor or attempt-to-escape frequency, typically 1012 s−1 as suggested by Mott.29 Ev and Ec are the valence band top energy and conduction band bottom energy, respectively.
Then, the trap level distribution from TSC measurement can be calculated by eqn (6) based on MATLAB numerical calculation. Fig. 18 shows the trap level distributions of the virgin and aging samples. It shows that the trap density of the virgin was relatively low. With the rise of temperature and electric field intensity, the trap density increased and the trap energy level corresponding to the peak of trap density became deeper. The peak density of traps could reach about 2.5 times larger than that of the virgin sample under the condition of 80 °C – 25 kV cm−1 electrical-hydrothermal aging. The phenomenon can be explained by the following aspects. Firstly, with the combination of electrical-hydrothermal aging, more defects were produced inside the HTV SR, which enhanced the electron trapping ability and increased the trap density. Secondly, it is well known that traps can be divided into deep traps and shallow traps according to the trap level. The current peak at low temperature is mainly contributed by the charge decapitation in shallow traps, while the current peak at high temperature corresponds to the charge decapitation in deep traps. As shown in Fig. 18, compared to the virgin sample, more deep traps were generated in the process of electrical-hydrothermal aging. Deep traps bound carrier migration, leading to local charge accumulation and rising local electric field strength. When the threshold was exceeded, the polymer breakdown might occur finally.
 | ||
| Fig. 18 Trap level distributions before and after electrical-hydrothermal aging for 24 days: (a) E = 15 kV cm−1, varying temperature; (b) T = 80 °C, varying electric field intensity. | ||
3.6 Discussion
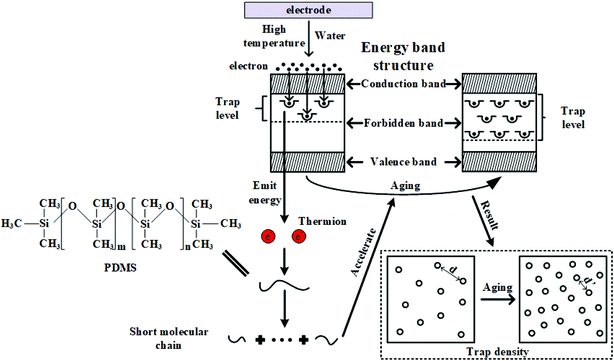
According to the trap theory of solid dielectric, the energy band of insulators can be divided into the conduction band, forbidden band and valence band. The charges injected by the electrode can pass through the potential barrier into the conduction band through the Schottky effect and be captured by the trap in the forbidden band.30 The relaxation time of captured charges in traps is mainly determined by trap energy level and trap energy density. The larger trap energy level and density, the longer the relaxation time would be. Electrons captured by traps must overcome the larger trap barrier to be released. Due to the increase of trap energy level and trap density after electrical-hydrothermal aging, it is easier to form charge accumulation. When charges accumulate to a certain critical value, the breakdown happens.Combined with the test results above, the mechanism of electrical-hydrothermal aging can be summarized in Fig. 19. First of all, when the HTV SR specimen is subjected to hydrothermal aging effects, the main and side chains scission on PDMS molecular chain occurred, producing free radical and LMW substances. With the aging process going on, more physical and chemical defects are formed in the material. The oxidation decomposition reaction in the aging process promotes the formation of more free molecules and traps, leading to the increase of dielectric constant, loss tangent tan![[thin space (1/6-em)]](https://www.rsc.org/images/entities/char_2009.gif) δ, trap energy level and trap density.
δ, trap energy level and trap density.
Then, when the electric field is added, electrons would be injected into the HTV SR from the electrode, and some electrons are trapped by the polymer. The trapped electron becomes the recombination center of the hole, releasing large amounts of energy and transferring it to other electrons to produce thermions. The hydrothermal aging condition provides convenience for electron injection. More thermions will bombard the molecular chain, creating more traps. On the other hand, the dipole polarization loss generates thermal power, which aggravates the deterioration of insulating materials. Therefore, according to the trap properties during the aging process, producing nanocomposites can be an available way. The addition of nanoparticles can reduce the number of traps in the material and enhance breakdown strength. By adjusting the charge transport characteristics, the breakdown probability can be lowered down.
4. Conclusions
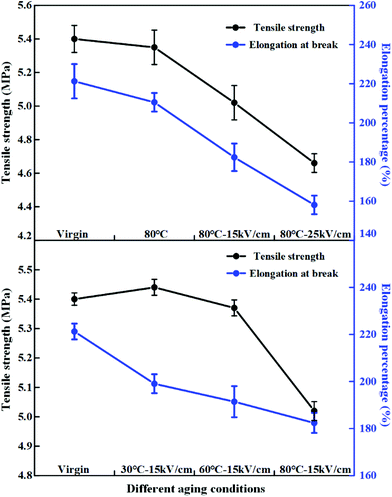
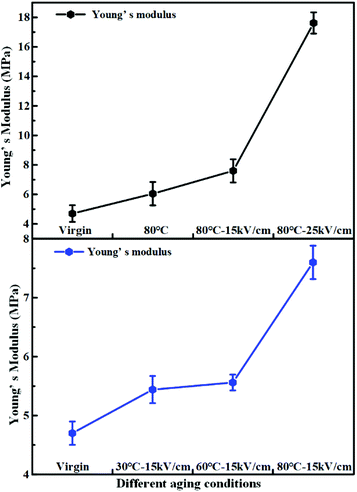
This study focuses on the electrical-hydrothermal aging experiment of HTV SR based on the high temperature and high humidity environment all over the world. Some important conclusions can be summarized as follows:(1) Compared with hydrothermal aging samples, the relative weight, tensile strength, elongation at break and breakdown field strength significantly decreased after electrical-hydrothermal aging. The surface and interior of HTV SR were severely degraded, which was reflected in the scission of a large number of PDMS molecular chains, and the loss of flame retardant Al(OH)3.
(2) The dielectric constant and dielectric loss of HTV SR samples significantly increased with the rise of the aging temperature and electric field strength. When aged at 80 °C and 25 kV cm−1, there was an obvious dipole polarization loss peak that occurred due to the breaking of molecular chains and the increase of dipoles.
(3) The electrical-hydrothermal aging has a synergistic effect. The presence of temperature and water facilitates the electron injection and deepens the trap energy level and trap density of HTV SR, which in turn increases the probability of electron entrapment, accelerating the deterioration process of HTV SR.
Conflicts of interest
There are no conflicts to declare.Acknowledgements
This work was supported by the National Natural Science Foundation of China (No. 51977084).References
- M. Bleszynski and M. Kumosa, Silicone rubber aging in electrolyzed aqueous salt environments, Polym. Degrad. Stab., 2017, 146, 61–68 CrossRef CAS.
- W. Bretuj, J. Fleszynski, K. Wieczorek and J. Ziaja, Influence of composite insulators sheds diameter on ageing resistance in laboratory research, Przegl. Elektrotech., 2010, 86(11b), 205–208 Search PubMed.
- E. Solis-Ramos and M. Kumosa, Synergistic effects in stress corrosion cracking of glass reinforced polymer composites, Polym. Degrad. Stab., 2017, 136, 146–157 CrossRef CAS.
- S. F. Yang, Z. D. Jia, X. G. Ouyang and S. H. Wang, Inhibition of algae growth on HVDC polymeric insulators using antibiotic-loaded silica aerogel nanocomposites, Polym. Degrad. Stab., 2018, 155, 262–270 CrossRef CAS.
- J. J. Wang, W. H. Lee, J. C. Ho and T. S. Hu, High performance OTFTs using surface-modified nanocomposite dielectric gate insulator, J. Mater. Sci.: Mater. Electron., 2009, 20, 355–358 CrossRef CAS.
- R. Wang, C. Z. Xie, L. L. Zeng and H. S. Xu, Thermal decomposition behavior and kinetics of nanocomposites at low-modified ZnO content, RSC Adv., 2019, 9(2), 790–800 RSC.
- Q. Yang, W. X. Sima, J. Z. Deng, C. X. Sun and J. L. Hu, Shed Configuration Optimization for Ice-Covered Extra High Voltage Composite Insulators, J. Adhes. Sci. Technol., 2012, 26(4–5), 575–591 CAS.
- C. Yuan, C. Z. Xie, L. C. Li, X. D. Xu and S. M. Gubanski, Surface Potential Decay on Material Samples Taken from In-service Aged HVDC Silicone Rubber Composite, IEEE Trans. Dielectr. Electr. Insul., 2017, 24(1), 592–600 Search PubMed.
- C. Yuan, C. Z. Xie, L. C. Li, X. D. Xu, S. M. Gubanski, Y. Zhou, Q. Li and J. L. He, Space Charge Behavior in Silicone Rubber from In-Service Aged HVDC Composite Insulators, IEEE Trans. Dielectr. Electr. Insul., 2019, 26(3), 843–850 CAS.
- Y. Zhu, M. Otsubo, C. Honda and S. Tanaka, Loss and recovery in hydrophobicity of silicone rubber exposed to corona discharge, Polym. Degrad. Stab., 2006, 91(7), 1448–1454 CrossRef CAS.
- W. Song, W. W. Shen, G. J. Zhang, B. P. Song, Y. Lang, G. Q. Su, H. B. Mu and J. B. Deng, Aging Characterization of High Temperature Vulcanized Silicone Rubber Housing Material Used for Outdoor Insulation, IEEE Trans. Dielectr. Electr. Insul., 2015, 22(2), 961–969 CAS.
- A. R. Verma, B. S. Reddy and R. Chakraborty, Multistress Aging Studies on Polymeric Insulators, IEEE Trans. Dielectr. Electr. Insul., 2018, 25(2), 524–532 CAS.
- G. C. Montanari, G. Mazzanti and L. Simoni, Progress in electrothermal life modeling of electrical insulation during the last decades, IEEE Trans. Dielectr. Electr. Insul., 2002, 9(5), 730–745 CrossRef CAS.
- C. Chen, Z. D. Jia, W. A. Ye, Z. C. Guan and Y. Z. Li, Thermo-oxidative Aging Analysis of HTV Silicone Rubber Used for Outdoor Insulation, IEEE Trans. Dielectr. Electr. Insul., 2017, 24(3), 1761–1772 CAS.
- Z. Wang, Z. D. Jia, J. K. Jiao and Z. C. Guan, Influence of Water, NaCl Solution, and HNO3 Solution on High-Temperature Vulcanized Silicone Rubber, IEEE Trans. Dielectr. Electr. Insul., 2016, 23(2), 1164–1173 CAS.
- M. Ali and R. Hackam, Effects of Saline Water and Temperature on Surface Properties of HTV Silicone Rubber, IEEE Trans. Dielectr. Electr. Insul., 2008, 15(5), 1368–1378 CAS.
- Y. Zhu, K. Haji, M. Otsubo and C. Honda, Surface degradation of silicone rubber exposed to corona discharge, IEEE Trans. Plasma Sci., 2006, 34(4), 1094–1098 CAS.
- S. Pelissou, P. Benca and L. H. Gross, Electrical properties of metallocene polyethylene, Proceedings of the 2004 IEEE International Conference on Solid Dielectrics, vol. 1–2, 2004, pp. 466–469 Search PubMed.
- T. Kauerauf, R. Degraeve, E. Cartier, C. Soens and G. Groeseneken, Low Weibull slope of breakdown distributions in high-k layers, IEEE Electron Device Lett., 2002, 23(4), 215–217 CAS.
- G. C. Montanari, G. Mazzanti, M. Cacciari and J. C. Fothergill, In search of convenient techniques for reducing bias in the estimation of Weibull parameters for uncensored tests, IEEE Trans. Dielectr. Electr. Insul., 1997, 4(3), 306–313 CrossRef.
- G. C. Montanari, G. Mazzanti, M. Cacciari and J. C. Fothergill, In search of convenient techniques for reducing bias in the estimation of Weibull parameters for uncensored tests, IEEE Trans. Dielectr. Electr. Insul., 1997, 4(3), 306–313 CrossRef.
- R. W. Coppard, J. Bowman and L. A. Dissado, et al., The effect of aluminium inclusions on the dielectric breakdown of polyethylene, J. Phys. D: Appl. Phys., 1990, 23(12), 1554–1561 CrossRef CAS.
- J. Kim, M. K. Chaudhury, M. J. Owen and T. Orbeck, The mechanisms of hydrophobic recovery of polydimethylsiloxane elastomers exposed to partial electrical discharges, J. Colloid Interface Sci., 2001, 244(1), 200–207 CrossRef CAS.
- J. R. Hollahan and G. L. Carlson, Hydroxylation of Polydimethylsiloxane Surfaces by Oxidizing Plasmas, J. Appl. Polym. Sci., 1970, 14, 2499–2508 CrossRef CAS.
- A. D. Delman, M. Landy and B. B. Simms, Photodecomposition of Polydimethylsiloxane, J. Polym. Sci., Part A-1: Polym. Chem., 1969, 7, 3375–3386 CrossRef CAS.
- F. Chainet, L. L. Meur and C. P. Lienemann, et al., Characterization of silicon species issued from PDMS degradation under thermal cracking of hydrocarbons: part 1–gas samples analysis by gas chromatography-time of flight mass spectrometry, Fuel, 2013, 111, 519–527 CrossRef CAS.
- C. Yuan, C. Z. Xie, L. C. Li, X. D. Xu, S. M. Gubanski and Z. L. He, Dielectric Response Characterization of In-service Aged Sheds of (U) HVDC Silicone Rubber Composite Insulators, IEEE Trans. Dielectr. Electr. Insul., 2016, 23(3), 1418–1426 Search PubMed.
- F. Q. Tian, W. B. Bu, L. S. Shi, C. Yang, Y. Wang and Q. Q. Lei, Theory of modified thermally stimulated current and direct determination of trap level distribution, J. Electrost., 2011, 69(1), 7–10 CrossRef.
- N. F. Mott, and R. W. Gurney, Electronic Processes in Ionic Crystals, Oxford University Press, London, 1948 Search PubMed.
- R. Wang, C. Z. Xie, S. K. Luo, B. Gou, H. S. Xu and L. L. Zeng, The influence mechanism of nanoparticles on the dielectric properties of epoxy resin, RSC Adv., 2019, 9(34), 19648–19656 RSC.
| This journal is © The Royal Society of Chemistry 2020 |


