
 Open Access Article
 This Open Access Article is licensed under a Creative Commons Attribution-Non Commercial 3.0 Unported Licence
Efficient synthesis of niobium pentoxide nanowires and application in ethanolysis of furfuryl alcohol†
Zhenwei Zhang *a,
Peng Wangb,
Zeying Wua,
Chuanjun Yuea,
Xuejiao Weia,
Jiwei Zhenga,
Mei Xianga and
Baoliang Liua
*a,
Peng Wangb,
Zeying Wua,
Chuanjun Yuea,
Xuejiao Weia,
Jiwei Zhenga,
Mei Xianga and
Baoliang Liua
aSchool of Chemical Engineering and Materials, Changzhou Institute of Technology, 213022, People's Republic of China. E-mail: qianyangrun@163.com; Fax: +86 25 83587190; Tel: +86 25 83587190
bJiangsu Key Laboratory of Advanced Catalytic Materials and Technology, School of Petrochemical Engineering, Changzhou University, Gehu Road 1, Changzhou, Jiangsu 213164, People's Republic of China. E-mail: pengwang@cczu.edu.cn
First published on 4th February 2020
Abstract
Nb2O5 nanowires with high specific surface area and crystallinity were prepared by using ammonium oxalate and an acetic acid solvent system. The nanomaterial was applied in ethanolysis of furfuryl alcohol (FA), and the yield of the product, 2-(ethoxymethyl)furan (FEE), achieved was up to 79.6%. Compared to mesoporous Nb2O5 materials and other porous materials, the residence time of FEE on the surface of the catalyst is shorter, and the yield of ethyl levulinate (EL) is lower. Furthermore, a high temperature calcination treatment can change the acid sites and acidity type distribution on the nanowire surface. By XRD, NH3-TPD, IR, and TG-DTA determination methods, it was found that the weak and medium-strong acid sites on the surface of Nb2O5 nanowires were reduced after a 300 °C treatment, and the amount of strong acid was relatively higher. According to the catalytic performance test data and acidity determination, it was concluded that more weak acid and medium-strong acid sites improve the conversion of furfuryl alcohol to FEE, and the strong acid sites promote further conversion of FEE to EL.
1. Introduction
In recent decades, with the growth of the global economy, nations require a higher level of environmental protection. Under increasing environmental pressures, the transformation of traditional petrochemical raw materials to fuels and other fine chemicals faces enormous challenges, and the disparity between energy supply and demand is increasingly significant. Transformation of fine chemicals production is currently one of the most popular topics in the chemical industry. Compared with petrochemical resources, biomass resources possess lower pollution, wider distribution, and are more abundant.1 Furfuryl alcohol (FA) prepared from biomass is an important chemical platform compound, which can be used to synthesize other important energy products and bio-based chemicals. Determining how to convert FA into target chemicals or energy substitutes efficiently and ecologically is a big challenge all over the world.Alcoholysis of FA to furfuryl alcohol ethers and alkyl levulinates have been a popular topic in catalysis. FA ethers are important additives in fuels, and alkyl levulinates are important organic intermediates that can convert into many other chemicals. Utilization of sulfuric acid and aluminum chloride in the early stages has not conformed with environmental protection rules, and the quality requirements of the reaction equipment are higher. There is a wide variety of catalysts currently used in alcoholysis. Sulfates2 and fluorosulfonic acids3,4 have high catalytic activity, especially the long-chain levulinate, which can reach a yield of more than 90%, but the equipment is highly corrosive, and catalyst recovery is difficult, leading to solid waste salts. The ionic liquid catalysts can sufficiently mix with the reactants to promote the reaction efficiently, but the ionic liquid catalysts5–8 have low reusability. Catalysts such as acidic resin Amberlyst-15 (ref. 9) and sulfonic acid-modified organic porous silicon materials10,11 have high alcoholysis reaction efficiency due to sulfate modification on the surface, and the conversion of FA can reach up to 100%. Other catalysts used in alcoholysis include heteropoly acid-MOF materials,12 molecular sieves,13,14 multi-layer kaolin,15 graphenes,16 and noble metals.17 However, the sulfate group is easily lost after long reaction time. MOFs and noble metal catalysts have high activity and selectivity, but their preparation processes are complicated, costly, and the scale-up to production is difficult. The molecular sieves and basic layered compound catalyst have high specific surface areas, but the humins produced by the alcoholysis reaction of FA blocks the pores, and the diffusion rate is limited. Additionally, the water produced in the alcoholysis reaction causes damage to the porous structure. Although the graphene catalyst has high selectivity, there is still a long way to industrial preparation.
Metal oxide catalysts such TiO2,18 Al2O3, etc. exhibit higher activity in the preparation of FEE.1 In contrast, Nb2O5 is an important class of solid acid catalyst19 characterized by high stability, high acid strength, and good water resistance20 that can be applied in ammoxidation,21 dehydration,22,23 and oxidation24 reactions. However, the low specific surface area of Nb2O5 leads to low catalytic activity. Mesoporous Nb2O5 nanomaterials contain a large amount of Lewis acid (LA) sites and Brønsted acid (BA) sites, which can effectively catalyze the preparation of 5-hydroxymethylfurfural, and the conversion of glucose to HMF from LA acid sites is more effective than BA acid sites.25 However, the porous structure is easily blocked by carbon deposits in the alcoholysis reaction, thereby decreasing catalyst activity. The layered structure of Nb2O5 has better catalytic activity than mesoporous Nb2O5 and performed well in preparation of lactic acid by sugar.26 Thus, nanowire, nanorod, or nanosheet morphologies can be good alternatives for Nb2O5 material in the alcoholysis of FA.27 However, the large scale preparation of Nb2O5 materials with special morphology needs further optimization.
In this study, by improving the preparation method, the Nb2O5 nanowire material can be produced on a large scale by using acetic acid and ammonium oxalate as directing agents in an aqueous solution without using template agents; the added organic impurities can be easily removed. The preparation method is simple, and the prepared material has a high specific surface area. A Nb2O5 nanowire can be used as a solid acid for the ethanolysis reaction of FA. Its wire morphology can effectively increase the diffusion rate of reactants and products and improve the catalytic reaction efficiency. The nanomaterials are also easily recycled. Further studies have shown that by controlling the temperature of calcination treatment, the acidity and surface properties of Nb2O5 nanowires can be regulated, thereby allowing for selectivity tuning of FEE and EL.
2. Experimental
2.1 Chemical materials
Niobium oxalate (C10H5NbO20, >99%) was purchased from Guanggong Wenjiang Chemical Reagent Co. Ltd. Acetic acid (>99%), ammonium oxalate ((NH4)2C2O4, >99%), furfuryl alcohol (FA, 98%), and ethyl levulinate (EL, 99%) were purchased from ShangHai LingFeng Company. Deionized water was made from OKP equipment (Shanghai Lakecore Company).The niobium oxalate was purified before use, and 30 g niobium oxalate was dissolved in 100 ml deionized water, then heated to 80 °C for 1 h, and finally filtered while hot. The solution cooled to room temperature, and the white powder was collected. Then, the purified powder was used to prepare a solution using deionized water, approximately 10 g/100 ml.
2.2 Synthesis process
The preparation method of Nb2O5 nanowires was carried out as follows: 50 ml of the niobium oxalate solution (as described in Section 2.1) and 15 ml acetic acid were mixed together. 2.5 g of ammonium oxalate solid powder was added into the solution and was stirred for 3 h at 30 °C. Then the solution was poured into a Teflon-lined autoclave, which underwent hydrothermal treatment at 180 °C for 25 h. A white powder was obtained, most of the organic impurities were washed in hot water at 80 °C. Then the white powder was filtered and dried in an oven at 100 °C for 12 h. The obtained catalysts were denoted as 100-wNb.To change acidity and surface properties of nanowires, 100-wNb was calcinated in a tube furnace under different temperatures: 200 °C, 300 °C, 400 °C, and 500 °C. The programming rate was 5 °C min−1 to the target temperature, and the total time was 5 h. The obtained catalysts were denoted as 200-wNb, 300-wNb, 400-wNb, and 500-wNb, respectively.
2.3 Catalytic performance
The alcoholysis experiments were carried out in a closed, pressure-controlled vessel under continuous stirring, using 250 mg of catalyst in a solution of 1 ml FA and 10 ml ethanol. Once the set temperature was attained (160 °C, 0.8 MPa) after 5–8 min, time was reset to zero and the reactions proceeded for 5 h. After the reaction, the mixture was cooled to room temperature (30 min) and filtered with 0.22 μm syringe filters. The filtrate was analysed for GC-FID. All results (conversion and yield) are expressed as molar percentages.For catalyst stability experiments, the first run was performed with fresh catalysts, and the reaction carried out in nine parallel reactions. After the reaction, the catalyst was separated via centrifugation, washed with ethanol (10 ml per every time) three times, then water (10 ml per every time) three times, and then dried in an oven under 80 °C overnight. Finally, the catalysts were transferred back to the reactor starting a new catalytic run under standard reaction conditions.
2.4 Characterization
The crystallographic information on the obtained Nb2O5 nanocrystals was established by X-ray diffraction (XRD, using nickel-filtered Cu Kα radiation). The Nb2O5 nanocrystal morphology was examined using transmission electron microscopy (TEM, JEM-2100) and scanning electron microscopy (SEM, supra55). BET specific surface area was determined using a micromeritics Gemini instrument (type ASAP2010C). X-ray photoelectron spectroscopy (XPS) was operated using a Thermo Scientific Escalab 250 instrument under ultrahigh vacuum with a pressure near 2 × 10⁻⁹ mbar, and the composition of w-Nb2O5 was determined from a single sampling.NH3 temperature-programmed desorption (NH3-TPD): the sample was heat treated under a He atmosphere at 393 K for 1 h and then cooled. After that, it was processed to adsorb NH3 molecules at 373 K for 1 h, then purged with He to remove excess and weakly adsorbed NH3 molecules at 373 K. The temperature was programmed to 973 K, and the heating rate was 10 K min−1.
Pyridine adsorption Fourier-transform infrared spectroscopy (Py-IR): the samples were formed into pellets and placed in a vacuum cell. After activation by a high temperature vacuum, the background spectroscopy was taken. Pyridine adsorbed after cooling down to room temperature, and the spectrum was collected after purged pyridine molecules at 160 °C. The adsorption and desorption of pyridine was observed to reflect the B acid type and L acid type on the nanowire surface.
The possible intermediates produced during the catalytic processes were identified by a HP6890GC-5973MSD mass spectrometer coupled with gas chromatography with a HP-5 capillary column: the temperature of the injection was 280 °C, and the temperature of the detector was 250 °C. The temperature of the column was maintained at 90 °C for five minutes and raised to 200 °C with a ramp rate of 10 °C min−1. Every sample size injected to the GC and GC-MS units is 1 μl by Agilent automatic liquid sampler.
The yield of ethyl levulinate and other products were analyzed with gas chromatography. A HaiXin gas chromatograph was fitted with a HP-5 capillary column and flame ionization detector. The temperature of the injection was 280 °C, and the temperature of detector was 250 °C. Temperature of the column was maintained two min at 70 °C, and raised to 200 °C with a ramp rate of 10 °C min−1. The content of each substance was quantified by using the FA standard curve method, using different concentrations: 2, 5, 10, 20, and 40 mg ml−1.
3. Results and discussion
3.1 Preparation and characterization of Nb2O5 nanowire
The crystal phase of the obtained 100-wNb nanowire determined by XRD is shown in Fig. 1(a). 2θ values of planes 22.6, 28.3, 46.1, and 55.2 can be indexed as the (001), (100), (002), and (102) crystal planes of Nb2O5, according to the standard card (JCPDS no. 18-0911).28 In Fig. 1(a), the (001), (002) peak intensities are in accordance with the standard PDF card, and the other peaks are weak, which shows that the compound has a special morphology.29 No other impurity peaks were detected, indicating the high purity of the sample. Fig. S1† shows the Nb2O5 crystal change by hydrothermal reaction time. After 5 h, amorphous Nb2O5 particles were primarily formed. After 10 h of reaction, Nb2O5 nanomaterials showed obvious (001) crystal planes. After 15 hours, the (001) crystal plane peak intensity increased and after 25 h, the (001), (100), and (002) crystal plane strengths were all enhanced. It shows the that size of Nb2O5 nanowire crystals gradually increase with increasing time.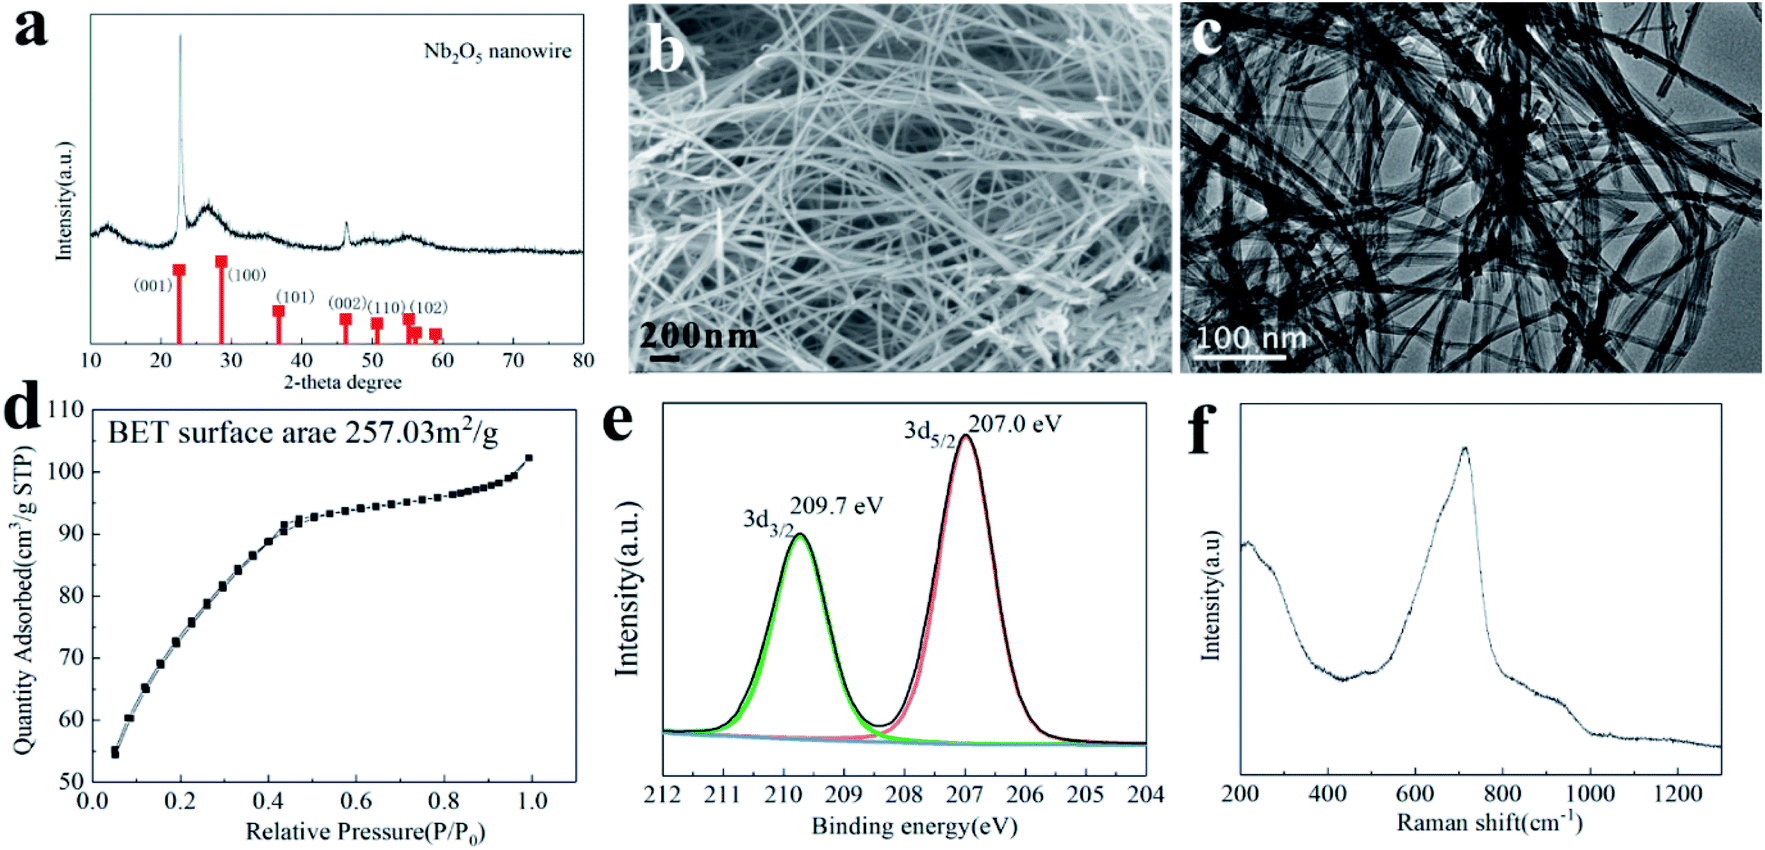 | ||
| Fig. 1 Characterization of the catalyst 100-wNb. (a) XRD patterns and standard card, (b) SEM image (scale bar, 200 nm), (c) N2 physical adsorption desorption (d) TEM image (scale bar, 100 nm). (e) Raman spectroscopy and (f) X-ray Photoelectron Spectroscopy. | ||
According to the XRD analysis and TEM and SEM results in Fig. S2 and S3,† Nb2O5 materials with different morphologies can be obtained under different hydrothermal times. In the early 5 h, niobium oxalate decomposed to form a small particle morphology. After 10 h, the Nb2O5 particles were assembled to form a curve-rod morphology. After 15 h, a linear morphology was formed by curve-rods, and after 25 h, the Nb2O5 nanowires gradually grew to large scales. The SEM (b) and TEM (c) images clearly show the linear 100-wNb with a width of about 10 nm. It has a large difference compared to the morphology reported in the literature, and its aspect ratio is large. The amino group on the ammonium oxalate molecule in the solution acts as a structure agent, and Nb2O5 can form a linear morphology. However, there is no macromolecular compound in the solution, no barrier effect exists,30 so the nanowire is further grown along the length by several micrometers or more.
The nanowire morphology makes the structure fluffy and increases the specific surface area of the material. As shown in Fig. 1(d), the specific surface area of 100-wNb was about 257.03 m2 g−1 by N2 physical adsorption desorption determination. When the relative pressure is 0.1–0.4, the adsorption amount rapidly increases, indicating the surface of the material has a macroporous or slit porous structure. When above 0.4, the adsorption curve tends to be gentle and the hysteresis loop is extremely small, but the adsorption amount continues to increase, indicating the material has a microporous structure.
XPS was used to detect elemental content and the valence state of Nb and O in the nanowires. According to the results, the atomic ratio of Nb to O is 15.20![[thin space (1/6-em)]](https://www.rsc.org/images/entities/char_2009.gif) :38.02, which is close to the chemical formula. The signal peaks of Nb3d are shown in Fig. 1(e), and the strong peaks at 207.0 eV and 209.7 eV are Nb5+ in accordance with the literature.31
:38.02, which is close to the chemical formula. The signal peaks of Nb3d are shown in Fig. 1(e), and the strong peaks at 207.0 eV and 209.7 eV are Nb5+ in accordance with the literature.31
The surface properties and valence bonds of 100-wNb were analyzed by Raman spectroscopy. According to literature, peaks at 500–700 cm−1 represent symmetric tensile vibration Nb–O, and the vibration peak at 900–1200 cm−1 is symmetric stretching of the Nb![[double bond, length as m-dash]](https://www.rsc.org/images/entities/char_e001.gif) O bond. The highly distorted octahedral structure, NbO6 in Nb2O5, has NbO chemical bonds and is associated with Lewis acids. The lowly distorted octahedral structures, NbO7 and NbO8, have Nb–O chemical bonds associated with Brønsted acids.32 According to the analysis of the 100-wNb material in Fig. 1(f), the Nb2O5 nanowire has a strong peak around 500–800 cm−1. It shows that there is more Brønsted acid and scheelite-like structure in the 100-wNb.
O bond. The highly distorted octahedral structure, NbO6 in Nb2O5, has NbO chemical bonds and is associated with Lewis acids. The lowly distorted octahedral structures, NbO7 and NbO8, have Nb–O chemical bonds associated with Brønsted acids.32 According to the analysis of the 100-wNb material in Fig. 1(f), the Nb2O5 nanowire has a strong peak around 500–800 cm−1. It shows that there is more Brønsted acid and scheelite-like structure in the 100-wNb.
3.2 Catalytic assessment
The main products and their contents in the ethanolysis reaction of FA by 100-wNb nanomaterials can be detected by a gas chromatography mass spectrometer and gas chromatography. The HP-5 column is a non-polar column used in gas chromatography equipment, so the compounds determined by the FID detector are as follows in Fig. S4:† 2-(ethoxymethyl)furan (FEE), α-angelica lactone (FO), ethyl levulinate (EL), and di(furan-2-yl)methane (diFA) are the four main products (reaction 1). Fig. 2 shows the mass spectrum of the main product, FEE. The molecular ion peak value of 126.1 is consistent with its molecular weight. The base peak value m/z is 81, which could indicate a fragment of 2-methylfuran anion. The m/z value of the other fragments can be presumed to be FEE molecular structure. The other three mass spectrometry analyses are shown in Fig. S5–S7† to confirm the correct structures of FO, EL, and diFA, respectively.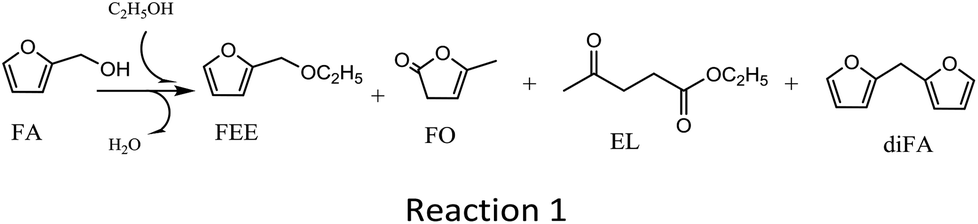
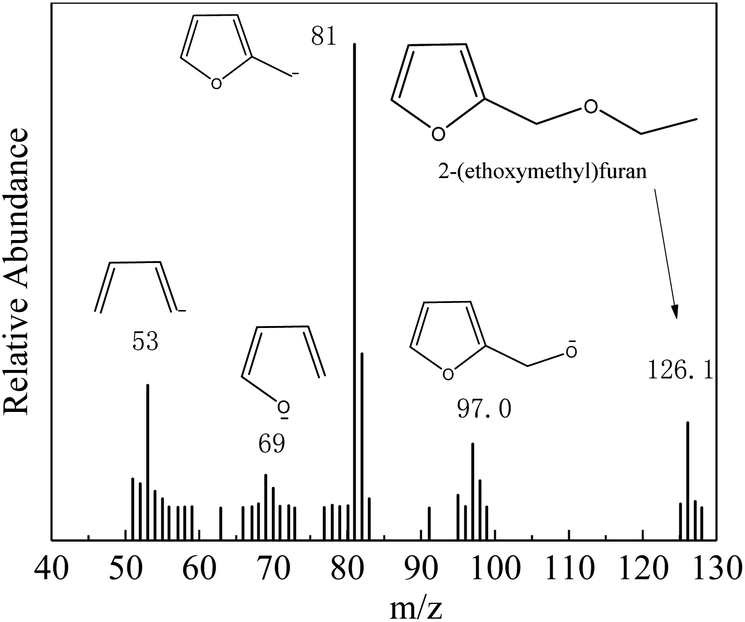 | ||
| Fig. 2 Mass spectrometry analysis of FEE. | ||
Temperature is one of the most important factors in the chemical reaction. Fig. 3 shows the effect of different temperatures on the activity and selectivity of 100-wNb in the ethanolysis reaction. When the temperature was 100 °C, the conversion of FA was only 10.7%. After the temperature was raised to 120 °C, the conversion of FA improved to 46.3%, and the yields of FEE and EL were 38.4% and 3.3%, respectively. The lower temperature makes the side reaction less, and the dimmer FA has less content. When the temperature was raised to 140 °C, the conversion of FA increased to 95.8%, and the yield of FEE was 80.0%. At 160 °C, the yield of FEE decreased slightly to 79.6%, and the yield of EL increased, but side reactions increased, increasing the yield of diFA at temperatures higher than 140 °C. When the temperature was increased to 180 °C, the side reaction increased significantly, and the yields of both FEE and EL decreased.
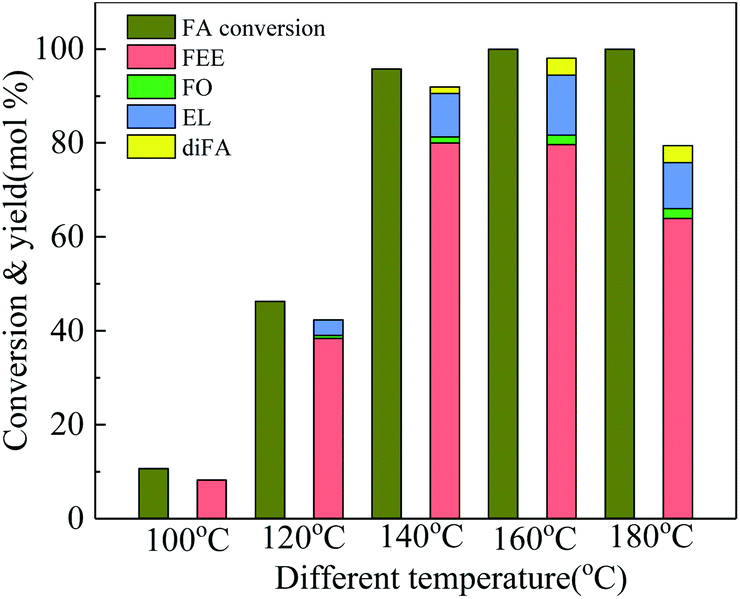 | ||
| Fig. 3 Effect of temperature on conversion and product yields in ethanolysis, by using 250 mg 100-wNb, solvent ethyl alcohol 10 ml, FA 1.00 ml, reaction time 5 h. | ||
Fig. 4 shows 100-wNb catalyzed FA ethanolysis changing with time at 160 °C. The FA conversion rate is fast at the beginning of the reaction. When the reaction was carried out for 3 h, the conversion of FA reached 95.7%, and then the reaction rate slowed. The yield of FEE increased gradually over the first 3 h, and the highest yield was 83.0%, after which the content decreased. The intermediate product, FO, can rapidly convert into other products.13 The content of the intermediate is below 3.0% during the reaction, and EL and diFA contents increase with reaction time. The yield of EL after five hours is about 12.8%.
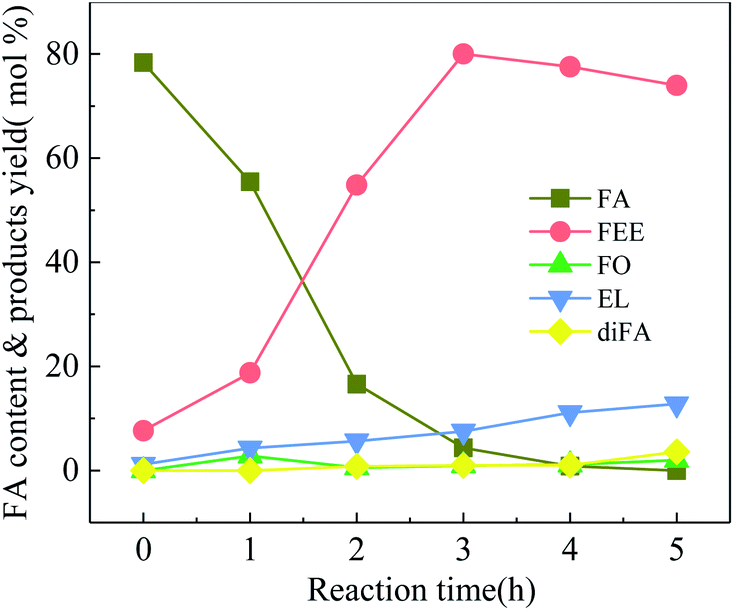 | ||
| Fig. 4 Ethanolysis of FA at different times over 100-wNb, by using 250 mg 100-wNb, at 160 °C, solvent ethyl alcohol 10 ml, FA 1.00 ml, reaction time 5 h. | ||
Fig. 5 shows the activity of different catalysts in the ethanolysis reaction of FA. Acidic Al2O3 has a low specific surface area, low acid content, and does not provide sufficient acidic sites in the reaction, so FA cannot efficiently convert in the reaction. Thus the conversion rate of FA is only 9.4%. The acidity strength of Ta2O5 is stronger than that of Al2O3, so the conversion of FA is 36.7%. In the phosphoric acid-modified Ta2O5 catalyzed reaction, the Ta2O5 surface has more acidic sites, making the FA conversion increase to 65.8%, and the FEE yield to 30.6%. Compared with Ta2O5, hydrated niobium oxide prepared by the literature method25 has an amorphous structure containing more acid sites. The conversion of FA was 80.5%, and the yield of FEE was 61.6%.
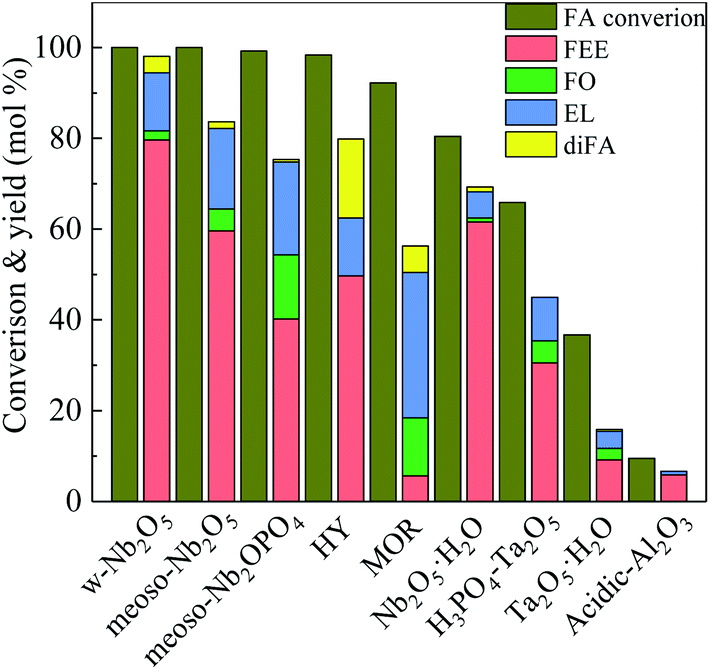 | ||
| Fig. 5 Catalytic activity studies of various catalysts towards ethanolysis of FA, by using 250 mg catalyst, at 160 °C, solvent ethyl alcohol 10 ml, FA 1.00 ml, reaction time 5 h. | ||
HY-molecular sieve and mordenite (MOR) have a high specific surface area and a porous structure and efficiently catalyze the FA with conversion rates of 98.4% and 92.3%, respectively. The pore size of HY is larger than that of MOR, and the mass transfer rate of reactants and products is higher. Therefore, the yields of FEE and EL are higher than MOR, which are 49.8% and 12.7%, respectively. Both m-NbOPO4 and m-Nb2O5 have a mesoporous structure, but m-NbOPO4 has more acidic sites on the surface and enables the conversion of FA up to 100%. Compared with mesoporous Nb2O5, mesoporous NbOPO4 has a higher EL yield by 20.4%. The conversion rate of w-Nb2O5 is 100%. Since the nanowire has a linear morphology, high specific surface area and more acidic sites, making the mass transfer rate fast, the yield of FEE can reach 79.6%. The FEE remains too long in the pores of mesoporous Nb2O5 and NbOPO4 materials, further producing FO and EL. As shown in Fig. 6, the catalytic reaction rate of mesoporous Nb2O5 at 160 °C changes with time. Compared with Nb2O5 nanowires in Fig. 3, the conversion rate of FA is slower, also the rate of FEE formation slower. The yield of EL improved.
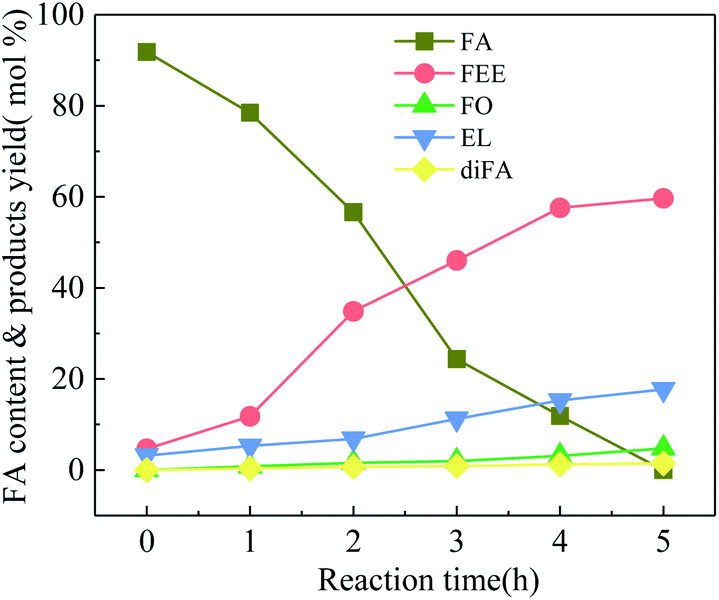 | ||
| Fig. 6 Ethanolysis of FA at different times over 100-wNb, by using 250 mg mesoporous Nb2O5, at 160 °C, solvent ethyl alcohol 10 ml, FA 1.00 ml, reaction time 5 h. | ||
To study the effects of surface acid properties of Nb2O5 in the ethanolysis reaction, 100-wNb nanowires calcined under different high temperatures were used for ethanolysis reaction assessment. Results in Fig. 7 show that since the acidic site on the surface of the nanowire decrease as the calcination temperature increases, the activity decrease leads to a gradual decrease in the conversion of FA. However, the yield of EL first increased, then decreased and the EL yield of 300-wNb was the highest. The FEE yield gradually decreased to 41.0% when using 500-wNb.
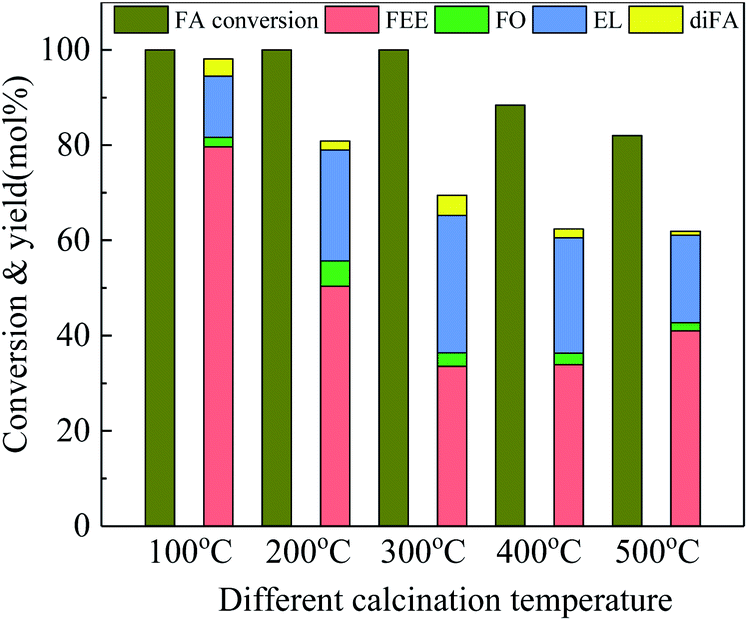 | ||
| Fig. 7 Catalytic activity studies of Nb2O5 nanowire calcined under different temperatures towards ethanolysis of FA, by using 250 mg catalyst, at 160 °C, solvent ethyl alcohol 10 ml, FA 1.00 ml, reaction time 5 h. | ||
To further study the effects of surface acidity of Nb2O5 nanowires in the catalytic reaction, a calcination treatment method in different (high) temperatures changed the acid site and acidity distribution of 100-wNb nanowire surface. It can be seen from the TG-DTA analysis (in Fig. 8(a)) that the mass loss of 100-wNb starts around 200 °C on the thermogravimetric curve, and there is no lost weight at 300 °C. The total mass loss is about 23.6%. The DTA curve gradually increased from room temperature and no exothermic peaks appeared. The results show that the Nb2O5 nanowire has no crystal phase transfer during high temperature calcination. From the XRD patterns (in Fig. 8(b)) of five samples: 100-wNb, 200-wNb, 300-wNb, 400-wNb, and 500-wNb, it can be seen that as the temperature rises, the peak intensities of the (001) and (002) crystal planes change little and the improvement of crystallinity is not obvious. The data proves no crystalline phase transformation, but the morphological structures are similar. The cause of thermal weight loss is desorption of hydroxyl groups on the surface and decomposition of a small amount of organic matters. After a 300 °C calcination treatment, there is almost no dehydration on the surface of the Nb2O5 material, and more Lewis acid sites are exposed on the surface of the nanowire.
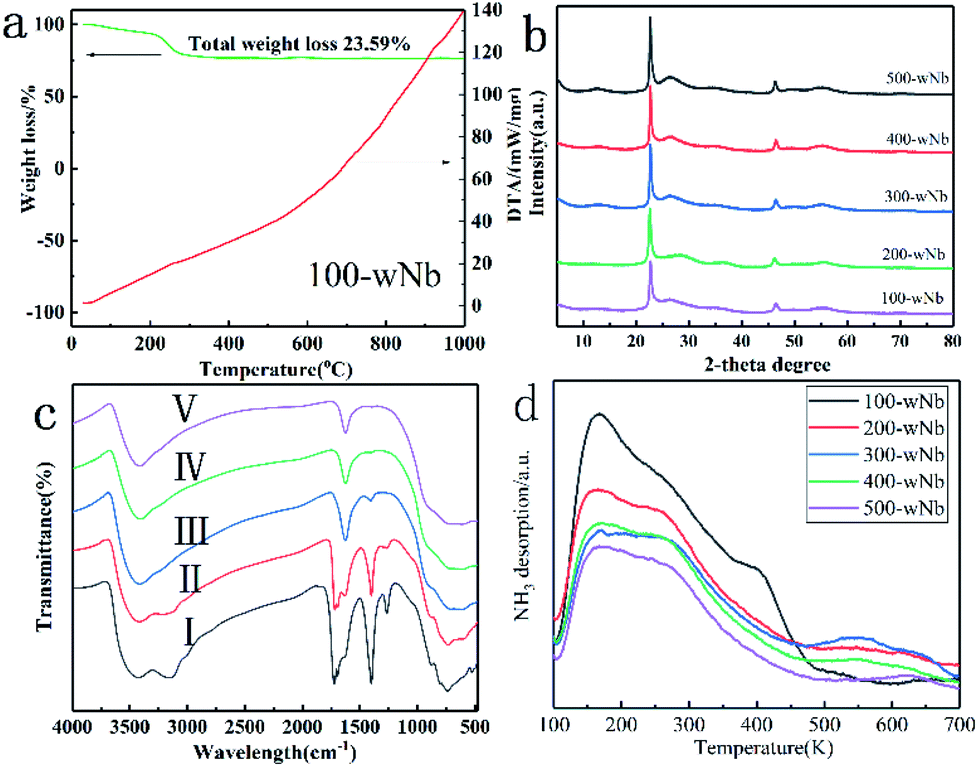 | ||
| Fig. 8 Characterization of the catalysts: 100-wNb, 200-wNb, 300-wNb, 400-wNb, 500-wNb. (a) and (b) XRD patterns SEM image (scale bar, 200 nm), (c) Fourier transform infrared spectroscopy analysis (I 100-wNb, II 200-wNb, III 300-wNb, IV 400-wNb, V 500-wNb), (d) NH3 temperature programmed desorption (NH3-TPD). | ||
Fig. 8(c) shows infrared spectra of a Nb2O5 nanowire obtained after different temperatures of calcination. The curves (a) and (b) in the spectrum all contain the vibration absorption peak of Nb–O at 564 cm−1 and the vibration absorption peak of Nb–O–Nb at 808 cm−1. In Fig. 8(c), the bending vibration characteristic absorption peaks of water molecules at 1622 cm−1, 1378 cm−1, and 1250 cm−1 are the characteristic absorption peaks of the organic matter contained on the Nb2O5. 3406 cm−1 is the –OH absorption peak caused by bound water, and 3240 cm−1 is the –OH absorption peak of the water content in Nb2O5.33 Curve (c) shows that the peaks of organic matter at 1378 cm−1 and 1250 cm−1 in the infrared spectrum after calcination at 573 K disappeared. It was shown that after Nb2O5 calcined at 573 K, the organic matter is significantly removed to form pure phase nano Nb2O5.
A NH3 temperature-programmed desorption curve can determine the total surface acidity properties of Nb2O5 after different temperatures during calcination, and the acid amount decreased with increasing calcination temperature. In Fig. 8(d), the desorption peak at 100–400 °C is weak and medium-strong acid, and the desorption peak at 500–600 °C is strong acid.34 100-wNb has the largest acid amount, mainly weak acid and medium-strong acid, and the selectivity of FEE is higher in the catalytic reaction. However, as the calcination temperature increases, the dehydration of Nb2O5 causes the total acid amount to decrease. However, 300-wNb has the highest strong acid desorption peak at 500–600 °C, and the material has the highest yield of EL in the ethanolysis reaction. According to the pyridine infrared data analysis (in Fig. S8†), 100-wNb has a strong absorption peak at 1420–1440 cm−1, and there is a larger amount of Brønsted acid. The peak of 300-wNb at 1470 cm−1 is stronger than 1440 cm−1, indicating more Lewis acid sites on the Nb2O5 than Brønsted acid.35 Therefore, according to the data, in the ethanolysis reaction the weak acid and the medium-strong acid are favorable for the formation of FEE, and the strong acid can further catalyze the ring opening of the intermediate product FEE to form EL.
Catalyst stability is an important indicator in measuring the catalytic reaction. Fig. 9 shows the catalytic stability of 100-wNb. After it was recycled eight times, the conversion rate of FA is still high, only declining by 2.0%. The FEE yield decreased from the initial 79.6% to 70.3% due to a certain amount of humin adsorption on Nb2O5 during the recycle process, but the total catalytic activity and selectivity remain essentially unchanged.
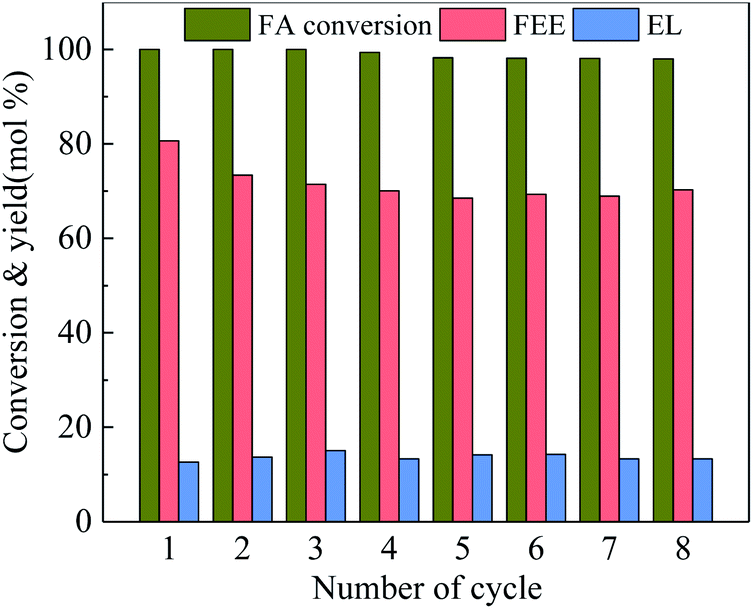 | ||
| Fig. 9 Reusability of 100-wNb towards ethanolysis of FA, by using 250 mg catalyst, at 160 °C, solvent ethyl alcohol 10 ml, FA 1.00 ml, reaction time 5 h. | ||
4. Conclusions
Acetic acid and ammonium oxalate form a successful hydrothermal system for large scale synthesis of Nb2O5 nanowire materials. The advantage of this method is that no templating agent is needed, and most of the organic impurities can be removed easily via washing, to retain high quality Nb2O5. The material has excellent activity in the ethanolysis reaction of FA. Compared with microporous molecular sieves and mesoporous materials, the morphology of Nb2O5 nanowires reduces the residence time of FEE on its surface and improves its catalytic selectivity. Characterization analysis showed that the weak acid and medium-strong acid sites on the surface of Nb2O5 promoted efficient formation of FEE, and the strong acid site promoted FEE convert to EL.Conflicts of interest
There are no conflicts to declare.Acknowledgements
The research was supported by National Science Foundation of China (21802008), the Nature Science Foundation of the Jiangsu Higher Education Institutions of China (19KJB530004), 2018 Changzhou Institute of Technology School Support Program for Young Scholars (A3-3008-18-008), and Changzhou Institute of Technology Start-up Capital (YN1502, No. E3-6107-15-026) Jiangsu Province.Notes and references
- E. Ahmad, M. I. Alam, K. K. Pant and M. A. Haider, Green Chem., 2016, 18, 4804–4823 RSC
.
- Y.-B. Huang, T. Yang, M.-C. Zhou, H. Pan and Y. Fu, Green Chem., 2016, 18, 1516–1523 RSC
- J. R. Kean and A. E. Graham, Catal. Commun., 2015, 59, 175–179 CrossRef CAS
- A. Chappaz, J. Lai, K. De Oliveira Vigier, D. Morvan, R. Wischert, M. Corbet, B. Doumert, X. Trivelli, A. Liebens and F. Jérôme, ACS Sustainable Chem. Eng., 2018, 6, 4405–4411 CrossRef CAS
- G. Wang, Z. Zhang and L. Song, Green Chem., 2014, 16, 1436–1443 RSC
- A. S. Amarasekara and B. Wiredu, BioEnergy Res., 2014, 7, 1237–1243 CrossRef CAS
- G. M. González Maldonado, R. S. Assary, J. A. Dumesic and L. A. Curtiss, Energy Environ. Sci., 2012, 5, 8990–8997 RSC
- J.-P. Lange, W. D. van de Graaf and R. J. Haan, ChemSusChem, 2009, 2, 437–441 CrossRef CAS PubMed
- M. Zuo, K. Le, Y. Feng, C. Xiong, Z. Li, X. Zeng, X. Tang, Y. Sun and L. Lin, Ind. Crops Prod., 2018, 112, 18–23 CrossRef CAS
- B. Lu, S. An, D. Song, F. Su, X. Yang and Y. Guo, Green Chem., 2015, 17, 1767–1778 RSC
- P. A. Russo, M. M. Antunes, P. Neves, P. V. Wiper, E. Fazio, F. Neri, F. Barreca, L. Mafra, M. Pillinger, N. Pinna and A. A. Valente, J. Mater. Chem. A, 2014, 2, 11813–11824 RSC
- Z. Wang and Q. Chen, Green Chem., 2016, 18, 5884–5889 RSC
- D. Zhao, P. Prinsen, Y. Wang, W. Ouyang, F. Delbecq, C. Len and R. Luque, ACS Sustainable Chem. Eng., 2018, 6, 6901–6909 CrossRef CAS
- P. Neves, S. Lima, M. Pillinger, S. M. Rocha, J. Rocha and A. A. Valente, Catal. Today, 2013, 218–219, 76–84 CrossRef CAS
- T. A. Natsir, T. Hara, N. Ichikuni and S. Shimazu, ACS Appl. Energy Mater., 2018, 1, 2460–2463 CrossRef CAS
- S. Zhu, C. Chen, Y. Xue, J. Wu, J. Wang and W. Fan, ChemCatChem, 2014, 6, 3080–3083 CrossRef CAS
- Y. Wang, Q. Cui, Y. Guan and P. Wu, Green Chem., 2018, 20, 2110–2117 RSC
- J. N. Appaturi, M. R. Johan, R. J. Ramalingam, H. A. Al-Lohedan and J. J. Vijaya, RSC Adv., 2017, 7, 55206–55214 RSC
- S. M. A. H. Siddiki, M. N. Rashed, M. A. Ali, T. Toyao, P. Hirunsit, M. Ehara and K.-i. Shimizu, ChemCatChem, 2019, 11, 383–396 CrossRef CAS
- D. R. Fernandes, A. S. Rocha, E. F. Mai, C. J. A. Mota and V. Teixeira da Silva, Appl. Catal., A, 2012, 425–426, 199–204 CrossRef CAS
- E. Rojas, M. O. Guerrero-Pérez and M. A. Bañares, Catal. Lett., 2013, 143, 31–42 CrossRef CAS
- J. J. Martínez, D. F. Silva, E. X. Aguilera, H. A. Rojas, M. H. Brijaldo, F. B. Passos and G. P. Romanelli, Catal. Lett., 2017, 147, 1765–1774 CrossRef
- B. Viswanadham, V. Pavankumar and K. V. R. Chary, Catal. Lett., 2014, 144, 744–755 CrossRef CAS
- M. Tanaka, H. Shima, T. Yokoi, T. Tatsumi and J. N. Kondo, Catal. Lett., 2011, 141, 283–292 CrossRef CAS
- H. T. Kreissl, M. M. J. Li, Y.-K. Peng, K. Nakagawa, T. J. N. Hooper, J. V. Hanna, A. Shepherd, T.-S. Wu, Y.-L. Soo and S. C. E. Tsang, J. Am. Chem. Soc., 2017, 139, 12670–12680 CrossRef CAS PubMed
- K. Nakajima, J. Hirata, M. Kim, N. K. Gupta, T. Murayama, A. Yoshida, N. Hiyoshi, A. Fukuoka and W. Ueda, ACS Catal., 2018, 8, 283–290 CrossRef CAS
- F. Yang, J. Tang, R. Ou, Z. Guo, S. Gao, Y. Wang, X. Wang, L. Chen and A. Yuan, Appl. Catal., B, 2019, 256, 117786 CrossRef CAS
- Y. Wang, F. Xin, X. Yin, Y. Song, T. Xiang and J. Wang, J. Phys. Chem., 2018, 122, 2155–2164 CrossRef CAS PubMed
- X. Liu, G. Liu, Y. Liu, R. Sun, J. Ma, J. Guo and M. Hu, Dalton Trans., 2017, 46, 10935–10940 RSC
- R. F. Ali, A. H. Nazemi and B. D. Gates, Cryst. Growth Des., 2017, 17, 4637–4646 CrossRef CAS
- K. Kim, S.-G. Woo, Y. N. Jo, J. Lee and J.-H. Kim, Electrochim. Acta, 2017, 240, 316–322 CrossRef CAS
- I. Nowak and M. Ziolek, Chem. Rev., 1999, 99, 3603–3624 CrossRef CAS PubMed
- B. X. Huang, K. Wang, J. S. Church and Y.-S. Li, Electrochim. Acta, 1999, 44, 2571–2577 CrossRef CAS
- X. Wang, Y. Song, L. Huang, H. Wang, C. Huang and C. Li, Catal. Sci. Technol., 2019, 9, 1669–1679 RSC
- Y. Zhang, J. Wang, J. Ren, X. Liu, X. Li, Y. Xia, G. Lu and Y. Wang, Catal. Sci. Technol., 2012, 2, 2485–2491 RSC
Footnote |
| † Electronic supplementary information (ESI) available. See DOI: 10.1039/d0ra00085j |
| This journal is © The Royal Society of Chemistry 2020 |