DOI:
10.1039/C9RA08870A
(Paper)
RSC Adv., 2020,
10, 5697-5703
Anti-biofouling effect of a thin film nanocomposite membrane with a functionalized-carbon-nanotube-blended polymeric support for the pressure-retarded osmosis process†
Received
29th October 2019
, Accepted 28th January 2020
First published on 4th February 2020
Abstract
In this study, the anti-biofouling effect of a thin film nanocomposite (TFN) membrane with a functionalized-carbon-nanotube-blended polymeric support layer was analyzed to determine the applicability of this membrane for the pressure-retarded osmosis (PRO) process. The anti-biofouling property of TFN membranes for the PRO process was characterized by SEM, FTIR, and AFM, as well as contact angle measurements and zeta potential analysis of the bottom side of the support layer. The anti-biofouling effect of the fabricated membrane for the PRO process was analyzed by bacterial attachment tests on the bottom surface of the support layer and biofouling tests in a cross-flow operation system in the PRO mode (AL-DS). The TFN membrane with 0.5 wt% fCNTs exhibited enhanced anti-biofouling properties of the bottom surface of the support layer compared to the bare TFC membrane due to the low roughness, high negative surface charge, and hydrophilicity. Compared to the bare TFC membrane, the support layer of the fCNT0.5-TFN membrane exhibited a 35% decrease in bacterial attachment. In a laboratory-scale biofouling test, the water flux of the fCNT0.5-TFN membrane was ∼10% less than that of the bare TFC membrane in the PRO mode.
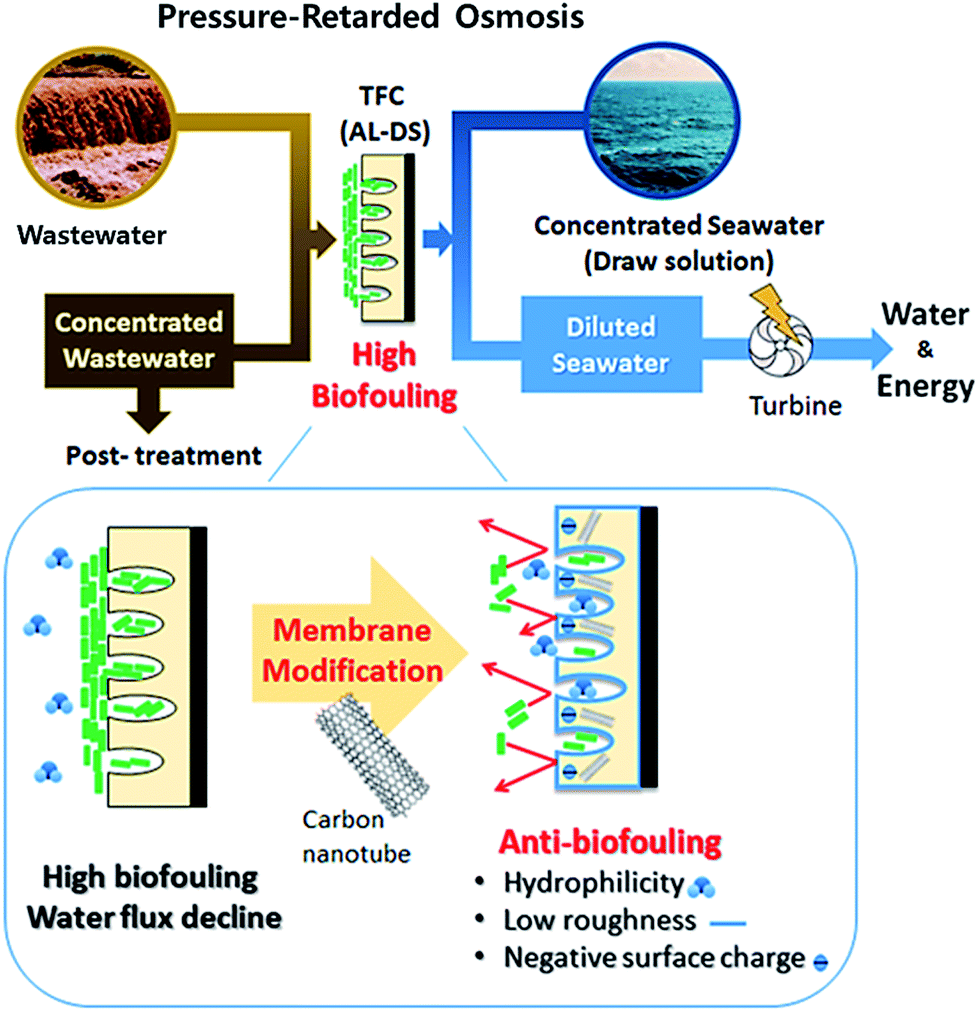
1. Introduction
As a water crisis and energy shortage have become serious issues around the world, membrane technology has become increasingly popular compared to other water treatment technologies due to less chemical and thermal consumption as well as low energy consumption. Pressure-retarded osmosis (PRO) is one of the membrane technologies used for producing water and energy by the osmotic pressure difference between two solutions.1 As saline water (i.e., draw solution) draws feed solution (i.e., wastewater) through a membrane, the volume of the draw solution increases, which leads to the movement of the turbine to produce electricity and water.2,3 In the PRO process, a thin film composite (TFC) membrane, comprising a polyamide active layer on a support layer, has been widely used for applications.4 This TFC membrane is limited by serious fouling due to the membrane orientation. The orientation of the TFC membrane in the PRO process is known as the PRO mode (AL-DS), where the active layer contacts the draw solution, while the support layer contacts the feed solution. Due to the membrane orientation, foulants in the feed solution are easily deposited on the bottom surface of the support layer and within the support layer structure.3,5 Due to the high concentrations of organic matter and bacteria in the feed solution, biofouling on membranes leads to a significant reduction in the system performance via the decrease in the membrane water flux and degradation of the membrane in the PRO process.6 The development stages of biofouling on membranes include the initial attachment of bacteria and formation of biofilms with the secretion of extracellular polymers. Therefore, it is imperative to modify membranes for the purpose of minimizing bacterial attachment and bacterial growth. The modification of membranes to reduce biofouling is categorized into anti-adhesion and antimicrobial approaches. The anti-adhesion approaches involve the control of the initial attachment of the microorganisms to inhibit the biofilm development via the change in the membrane surface properties such as hydrophilicity,7 surface charge,8,9 and surface roughness.10 Compared to hydrophobic membranes, hydrophilic membranes would exhibit less bacterial attachment due to the low interaction between the membrane surface and bacteria. In addition, the low roughness reduces the contact between the membrane surface and bacterium. The negatively charged surface of the membrane repels negatively charged bacteria around neural pH via electrostatic repulsive forces.11 By contrast, the antimicrobial approaches involve the prevention of the biofilm growth on the membrane via the use of biocidal agents that can disrupt and kill the attached microorganisms.12
Recently, carbon nanotubes (CNTs) have been applied for the synthesis of advanced membranes for use in water purification and desalination.13 CNTs can change membrane properties such as hydrophilicity, roughness, and surface charge. These property changes can improve the membrane performance, such as the water flux, thermal stability, mechanical stability, and antifouling.14–16 In addition, studies have reported the potential antimicrobial effect of CNTs.17–20 Antimicrobial mechanisms are hypothesized to occur via oxidative stress, physical cell damage, and intracellular metabolic pathway disruption.19,21
Previous studies have reported the incorporation of CNTs in the active layer of TFC membranes to enhance separation performance and anti-biofouling effect on the active layer for the Forward Osmosis (FO) or Reverse Osmosis (RO).17–20 In this purpose, the functionalized CNT was embedded in the polyamide thin film during interfacial polymerization or additional coating.22–24 Nevertheless, few studies have described carbon nanotubes employed in the TFC membrane for PRO process. In this study, the CNTs incorporated in the support layer of TFN membranes was analyzed to determine their anti-biofouling ability in the PRO mode for potential applications of the PRO process. In addition, the relationship between the anti-biofouling effect and characterization of the bottom surface of the support layer on the TFN membrane was investigated by scanning electron microscopy (SEM) and atomic force microscopy (AFM), as well as contact angle measurements and zeta potential analysis. In particular, this study played a significant role in the analysis of the anti-biofouling effect of the fCNT-TFN membrane in a cross-flow system by biofouling tests in the PRO mode (AL-DS). To the best of our knowledge, it is the first paper of reporting characterization of the bottom surface of support layer on the fCNT-TFN membrane and biofouling test of the fCNT-TFN membrane using the feed solution containing microorganisms for application in PRO process (Fig. 1).
 |
| | Fig. 1 Anti-biofouling properties of the TFN membrane with fCNT blended in the support layer for the PRO process. | |
2. Experimental
2.1 Materials
The support layer was fabricated with polyethersulfone (PES, Solvay Korea Co.), polyester nonwoven fabric (PET, grade 3249, Ahlstrom, Finland), N-methyl-2-pyrrolidinone (NMP, anhydrous 99.5%, Sigma-Aldrich) as the solvent, and polyvinylpyrrolidone (PVP, Mw: 10![[thin space (1/6-em)]](https://www.rsc.org/images/entities/char_2009.gif) 000 g mol−1, Sigma-Aldrich) as the pore formation additive. The active layer (polyamide) was formed by interfacial polymerization using trimesoyl chloride (TMC, 98%, Sigma-Aldrich), m-phenylenediamine (MPD, flakes 99%), and n-hexane (anhydrous 95%, Sigma-Aldrich). Multiwalled carbon nanotubes (MWCNTs, CM-95, Hanwha Nanotech Corp., Korea) were incorporated in the support layer of the TFN membrane. Nitric acid (70%, Sigma-Aldrich) and sulfuric acid (95.0–98.0%, Sigma-Aldrich) were used for CNT functionalization. Deionized (DI) water (Dream Plus ll, MDM Co., Korea) with a resistivity of 18.2 mΩ cm was used.
000 g mol−1, Sigma-Aldrich) as the pore formation additive. The active layer (polyamide) was formed by interfacial polymerization using trimesoyl chloride (TMC, 98%, Sigma-Aldrich), m-phenylenediamine (MPD, flakes 99%), and n-hexane (anhydrous 95%, Sigma-Aldrich). Multiwalled carbon nanotubes (MWCNTs, CM-95, Hanwha Nanotech Corp., Korea) were incorporated in the support layer of the TFN membrane. Nitric acid (70%, Sigma-Aldrich) and sulfuric acid (95.0–98.0%, Sigma-Aldrich) were used for CNT functionalization. Deionized (DI) water (Dream Plus ll, MDM Co., Korea) with a resistivity of 18.2 mΩ cm was used.
2.2 Fabrication of a thin film nanocomposite membrane with functionalized carbon nanotubes (fCNTs)
The effective performance of the CNT-incorporated membrane is related to the homogeneous dispersion of CNTs and good interfacial bonding with the polymer.25 The oxidation of CNTs with the acid mixture leads to the increased solubility in a solvent with hydrophilic functional groups (ESI E1†).
First, a polymer solution comprising PES (17 wt%), NMP (83 wt%) as the solvent, and PVP (1 wt%) as the pore formation additive was mixed using a stirrer. Second, functionalized MWCNTs were added into the polymer solution and stirred for 30 hours to permit homogeneous blending in the solution. After homogeneously mixing the solution, the solution was kept overnight at room temperature for removing bubbles, which were created during stirring. Table 1 summarizes the fabricated membranes blended with different concentrations of functionalized MWCNTs (0 wt%, 0.5 wt%, 1 wt%, 2 wt% of PES). The PET fabric was fixed on a glass plate using laboratory tape and wetted with the NMP solution. The fCNT-blended PES polymer solution was poured onto the PET fabric and drew down to a thickness of 100 μm using a casting knife. Then, the glass plate was immersed in DI water for 30 min to prepare the support layer by phase inversion. Time gap between solution casting on a fabric support and immersing inside a solvent is 5 s. The support layer was transferred to a coagulation bath, which was filled with DI water before the polyamide layer formation.
Table 1 Support layer composition of TFN membranes
| Membrane classification |
PES ratio (wt%) |
NMP ratio (wt%) |
PVP loading (wt% of PES) |
fCNT (wt% of PES) |
| CNT0 |
17 |
83 |
1 |
0 |
| CNT0.5 |
0.5 |
| CNT1 |
1 |
| CNT2 |
2 |
The polyamide layer was developed by interfacial polymerization. The support layer was placed into a custom-made acrylic frame and filled with a 2 wt% solution of MPD in 100 mL of DI water for 10 min. The MPD solution was discarded and removed by using a rolling rubber roller. Next, 0.15 wt% of TMC in 100 mL n-hexane was poured on the membrane surface that was wetted by using the MPD solution. The interfacial polymerization of MPD and the TMC solution led to the formation of an active layer (polyamide layer) on the membrane surface in 2 min. The TMC solution was discarded and placed in an oven at 70 °C for 2 min for further polymerization. The fabricated TFN membranes were stored in DI water at 4 °C prior to the performance or biofouling test.
2.3 Characterization of the fabricated membrane
In the PRO process, as the orientation of the TFC membrane was in the PRO mode, foulants were deposited on the bottom side of the support layer. It is crucial to analyze the characteristics of the bottom surface of the support layer to understand the anti-biofouling property. In this study, the bottom side of the support layer of the TFN membrane was characterized by SEM and AFM, as well as contact angle measurements and zeta potential analysis. SEM images were recorded to analyze the surface and cross-sectional morphology of the membrane (SEM, S-4700, Hitachi, Japan). Different functional groups on CNT, fCNT, TFC, and fCNT-TFN were analyzed by Fourier transform infrared (FTIR) spectroscopy in the ATR mode (660-IR, Varian, US). The membrane surface roughness was measured by AFM in the non-contact mode (XE-100, Park Systems, US). The root-mean-square roughness (Rq), arithmetical mean roughness (Ra), and ten-point mean roughness (Rz) were measured with a scan size of 8 μm × 8 μm. Surface hydrophilicity was evaluated by the static sessile drop method using a contact angle goniometer (Phoenix 300, Surface Electro Optics, Republic of Korea). The surface charge of the membrane was characterized by surface zeta potentials at pH 6.8 (ELS-Z, Otsuka Electronics, Japan). The membrane zeta potential was determined by the comparison of the electrostatic repulsion force between the membrane surface and negative ions in the background solution of 10 mM NaCl.
2.4 Membrane performance test
Membrane performance was evaluated by water flux and reverse salt flux (RSF) measurements in the cross-flow operation mode. First, 1 M NaCl of the draw solution and DI water of the feed solution were circulated using a 300 cm3 (cm2 min−1) pump with an effective membrane area of 30 cm2. The water flux and RSF were measured in the FO mode (AL-FS)/PRO mode (AL-DS) and calculated by the following equations (ESI E2†).
2.5 Bacteria attachment test on the bottom side of the support layer
As the bacteria-containing feed solution come into contact with the bottom of the support layer in the PRO process, bacteria attachment tests were performed on the bottom side of the support layer. E. coli (ATCC 15977) was cultured in a Luria–Bertani (LB) broth and incubated up to an optical cell density of 0.7–0.8 at 600 nm, with a bacterial concentration of 1 × 10⁸ CFU mL−1. After incubation, bacteria were collected by centrifugation at 4500 rpm for 20 min and resuspended in a phosphate buffered saline (PBS) solution. Membrane coupons of 4 cm2 were placed in plastic holders on the side of the support layer. Next, 100 μL of the suspension solution with E. coli (1 × 10⁸ CFU mL−1) was dropped on the membrane surface for 1 day at room temperature. After bacterial attachment, the suspended bacteria solution on the membrane was discarded, and the membrane surface was rinsed with the PBS solution to remove non-attached and dead bacteria. The rinsed membrane coupons were transferred into 50 mL conical tubes containing 10 mL of the PBS solution and subjected to sonication for 15 min to determine the number of attached bacteria on a membrane surface. The bacterial cell suspension in the tube was subjected to serial dilution for counting, followed by plating on LB plates for incubation at 37 °C. After incubation, the colonies were counted to examine the number of bacteria attached on the bottom surface of the support layer.
2.6 Biofouling test in the PRO mode
Membrane biofouling by bacteria was examined using a laboratory-scale cross-flow equipment in the PRO mode (AD-DS) in the absence of applied pressure. Synthetic wastewater was used as the feed solution, and 2 L of 1 M NaCl was used as the draw solution. Flow rates of the feed and draw solutions were 100 cm3 and 200 cm3 (cm2 min−1), respectively. The synthesis of 1 L of synthetic wastewater was carried out using DI water, 8.0 mM NaCl, 0.5 mM NaHCO3, 0.4 mM NH4Cl, 0.2 mM CaCl2·H2O, 0.2 mM KH2PO4, and 0.15 mM MgSO4·7H2O. The initial water flux of membrane was recorded under the condition of synthesis wastewater in the absence of the LB broth containing bacteria. Then, 10 mL of LB broth with bacteria was added per 1 L of the wastewater media. The LB broth is used as an energy source to increase bacterial growth. The initial E. coli concentration was 1 × 10⁸ CFU mL−1, reaching an optical cell density of 0.7–0.8 at 600 nm. The permeated water flux was continuously monitored at 25 °C during an incubation time of 2000 min to understand the biofilm formation on a membrane surface. After each biofouling experiment, (ESI E3†) thorough cleaning was performed. After the biofouling experiment, the tested membranes were stored in the PBS solution for the confocal laser scanning microscopy (CLSM) observation of the biofilm (ESI E4†).
3. Results and discussion
3.1 Characterization of fabricated membranes
3.1.1 FTIR analysis of functionalized CNT and fabricated membranes. Functional groups of functionalized MWCNTs and the 0.5 wt% functionalized MWCNT-blended support layer were examined by FTIR (Fig. S1†). Functionalized CNTs exhibited peaks of –OH (∼3440 cm−1) and (–COOH) (∼1380 cm−1), corresponding to bare CNTs.26–28 The carboxylic and hydroxyl groups of the functionalized CNTs led to the increased dispersion of CNTs in the polymeric support layer via hydrogen bonding with the PES sulfonic groups.14,29 Compared to the bare TFC membrane, the fCNT composite TFN membrane, comprising the functionalized CNTs in the support layer, exhibited increased peak intensities.
3.1.2 Morphology of fabricated membranes with SEM. Fig. S2† shows the cross-sectional image of the fabricated TFN membranes and the surface image of the bottom side of the support layer. In the cross-sectional image of the bare TFC membrane (Fig. S2a†) and fCNTs composite TFN membranes (Fig. S2b–d†), the polymer support exhibited an asymmetric porous structure with a polyamide active layer on the top of the surface. Compared to the bare TFC membrane, TFN membranes exhibited a slightly straight finger-like structure. In the surface SEM image, the bottom side of fCNT composite support layers exhibited larger pores (Fig. S2f–h†) than those observed on the bare PES support layer (Fig. S2e†).30 Pore size was affected by the concentration of fCNTs, which were deposited on the bottom side of the support layer (Fig. S3†). The addition of 0.5 wt% of fCNTs led to the formation of larger pores on the bottom of the support layer than bare PES support layer due to the hydrophilic functional groups of fCNTs and hydrogen bonding with the PES sulfonic groups. At an fCNT concentration greater than 0.5 wt%, the high viscosity of the polymer solution led to the delayed rate of phase separation, leading to small pores and aggregation.
3.1.3 AFM analysis of the roughness of the fabricated TFC membranes. The addition of fCNT in the support layer strongly affected the roughness of the bottom surface of the support layer of the TFN membranes. The roughness parameters (Ra, Rq) of the membrane bottom surface initially decreased with the addition of up to 0.5 wt% fCNTs and then increased with the further addition of the fCNT content of the support layer (Table 2). Fig. S4† shows the three-dimensional surface images of the bottom side of the support layer with different concentrations of fCNTs at a scan size of 8 μm × 8 μm. Although the bottom surface of support layer has more porous structure than top surface of support layer, the bottom surface microstructure of the support layer became smoother with the increase in the concentration of fCNTs in the casting solution of up to 0.5 wt% because fCNT located on the bottom side of the support layer led to a slower counter-diffusion velocity of the solvent and non-solvent, resulting in a smoother membrane surface.31 The further increase in the fCNT concentration (1 wt%, 2 wt%) of the casting solution led to a rough membrane surface by the aggregation of fCNTs in the support layer, as the high amount of fCNT was excessive for electrostatic interactions and good compatibility with the PES support layer.32,33
Table 2 Surface roughness parameters of the support layer of the fabricated TFN membranes
| Membrane |
Roughness |
| Ra (nm) |
Rq (nm) |
Rz (nm) |
| CNT0 |
49.976 |
62.17 |
340.394 |
| CNT0.5 |
23.874 |
31.3 |
277.413 |
| CNT1 |
28.43 |
37.76 |
334.207 |
| CNT2 |
31.139 |
40.708 |
439.176 |
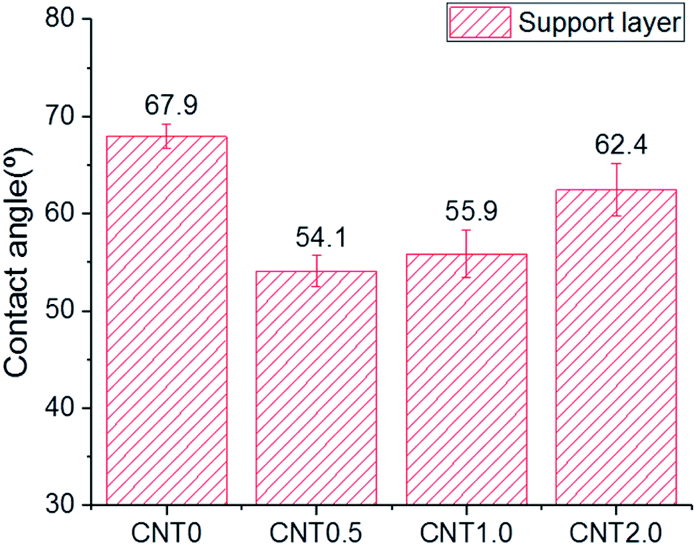
3.1.4 Hydrophilicity of the fabricated TFN membranes. The hydrophilicity of the support layer on the as-synthesized TFN membranes was determined by static water contact angle measurements (Fig. 2). With the increase in the concentration of fCNTs deposited on the bottom surface of support layer, the hydrophilicity of the bottom surface of the membrane increased due to presence of hydroxyl and carboxylic groups.14,16,28 In addition, wettability is directly associated to the change in the microstructure, and the good dispersion of fCNTs could increase hydrophilicity34 fCNTs were well dispersed on the bottom surface of the support layer at a concentration of 0.5 wt% and led to high hydrophilicity. The further increase in the fCNT concentration (1 wt% and 2 wt%) led to the aggregation of fCNTs on the membrane and decrease in their dispersion in the support layer. This tendency reduced the hydrophilicity of the bottom side of the support layer at an fCNT concentration greater than 0.5 wt%.
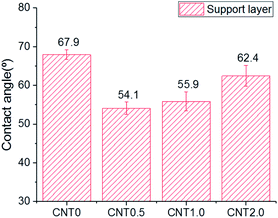 |
| | Fig. 2 Contact angle measurement of the support layer of the fabricated membrane. | |
3.1.5 Surface charge of the support layer. The surface charge of the bottom side of the support layer was examined to determine the anti-biofouling property using different fCNT contents (Fig. 3). The zeta potential of the bottom surface of the bare support layer (CNT0) was −38.1 mV, which changed to −63 mV (CNT0.5) by blending with fCNTs due to the negative charges of the hydroxyl and carboxylic groups after both groups ionized in 10 mM NaCl solution.28 At an fCNT content of greater than 0.5 wt%, a high amount of fCNTs led to the increase in the surface charge of the zeta potential as the high fCNT content led to their increased aggregation and decreased dispersion in the support layer. For the most part, the zeta potential values of both Gram positive and Gram negative bacteria were negative (∼−20 mV).35,36 The negatively charged membrane surfaces repel the bacterial surface, which is also negatively charged, via electrostatic repulsions.37 Therefore, the high negative surface charge of the support layer (CNT0.5) might increase the resistance of negatively charged foulants and bacteria.
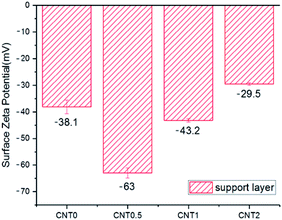 |
| | Fig. 3 Surface zeta potential of the support layer. | |
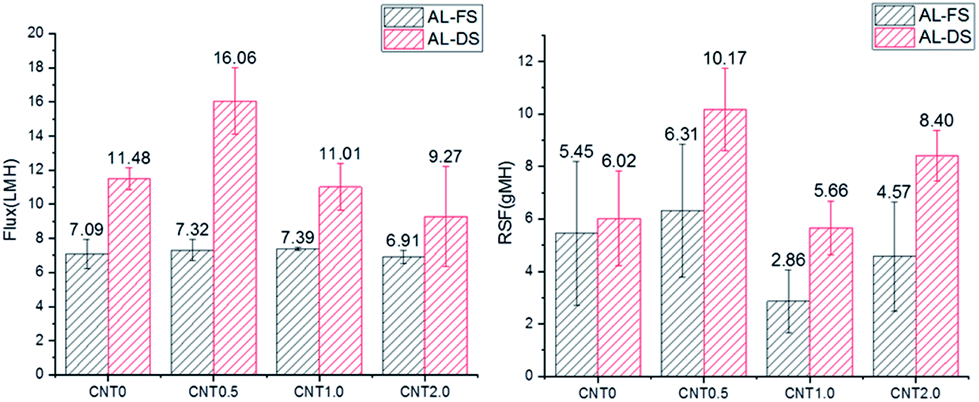
3.2 Water flux performance
Fig. 4 shows the water flux and RSF of the bare TFC membrane/fCNT composite TFN membranes. In the FO mode, the water flux of the CNT0.5 membrane slightly increased from 7.09 L m−2 h−1 (LMH) to 7.32 LMH compared with that observed for CNT0 membranes. In the PRO mode, the water flux of CNT0.5 increased by ∼30% from 11.48 LMH (CNT0 membrane) to 16.06 LMH due to the increase of the larger pores in the support layer than bare PES support layer.14,28 With the increase in the fCNT content of the membrane to greater than 0.5 wt%, the high viscosity of the casting solution led to the delayed phase separation and afforded smaller pores and lower water flux. Generally, the water flux in the PRO mode is more rapid than that in the FO mode due to the higher effective driving force, which is caused by membrane orientation.38 In the PRO mode, as water passes through the support layer to the draw solution, the highly porous support layer with the blended fCNTs can increase the effective osmotic difference (Δπeff) and lead to the notable increase in the water flux. On the other hand, in the FO mode, as water passes through the active layer to the draw solution, there is a lower increase in the effective osmotic difference. Hence, in the PRO process, it is effective to blend 0.5 wt% fCNTs in the support layer of the TFN membrane due to the highest water flux.
 |
| | Fig. 4 Water flux/RSF of bare TFC membranes and fCNT composite TFN membranes (0.5 wt%, 1 wt%, 2 wt%) in the FO mode (AL-FS)/PRO mode (AL-DS). | |
RSF is a membrane selectivity parameter in osmotically driven membrane processes. In the FO mode, with the increase in the water flux, RSF increased from 5.45 gMH (CNT0) to 6.31 gMH (CNT0.5). In the PRO mode, with the increase in the water flux, RSF increased from 6.02 gMH (CNT0) to 10.17 gMH (CNT0.5). RSF can increase due to the high effective area of the support layer with larger pores than bare PES support layer. With the increase in the pore size, salt can diffuse to the feed side instead of staying within the internal space between the active and support layers.39,40
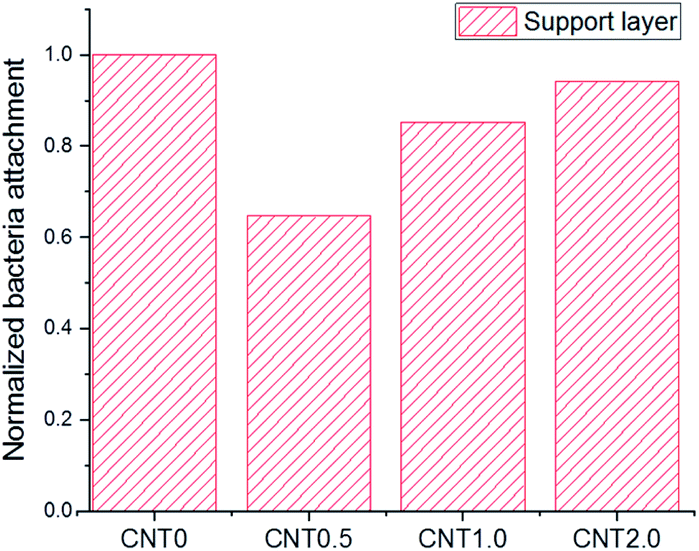
3.3 Analysis of bacterial attachment on the support layer
Fig. 5 shows the attachment of bacteria on the bottom surface of the support layer of TFN membranes. There is an increased number of bacteria attached on the bottom side of the support layer due to the facile attachment of bacteria on the porous support on the surface and inside the membrane structure.41 The number of E. coli attached to the support layer blended with 0.5 wt% fCNT (CNT0.5) was 35% less than that attached on the bare support layer of the TFC membrane (CNT0). At an fCNT concentration of greater than 0.5 wt%, the increased FCNT content of the support layer led to the slight increase in the number of attached bacteria. The reduction of bacterial attachment was considerably affected by the bottom surface characteristics of negative charge, low roughness, and hydrophilicity. The highest negative surface charge (Fig. 3) of the CNT0.5 membrane might reduce bacteria attachment via electrostatic repulsions with the negatively charged bacterial surface.37 In addition, the highest hydrophilicity (Fig. 2) and lowest roughness (Table 2) of the fCNT composite support layer might have reduced anti-adhesion on the membrane via the limitation of the contact between the membrane surface and bacterium.31 Furthermore, the antibacterial property of CNT might inhibit bacterial growth. A previous study has already explained the high potential and mechanisms of the antibacterial property of CNTs such as the intracellular metabolic pathway disruption, oxidative stress, and physical stress.19
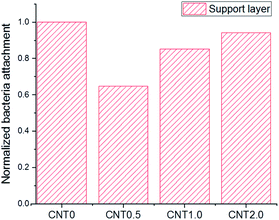 |
| | Fig. 5 Bacterial attachment on the support layer of the fabricated TFN membrane at different fCNT concentrations. | |
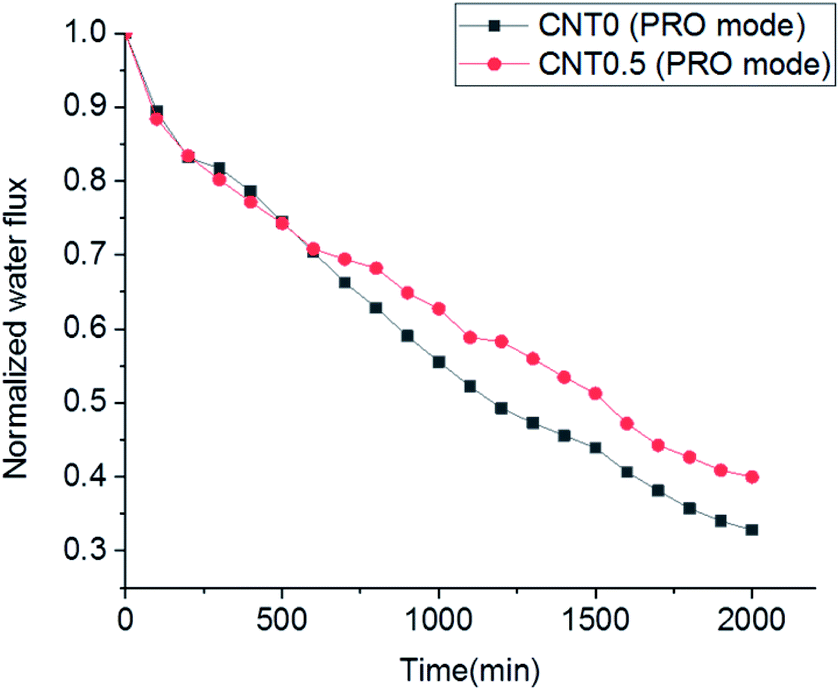
3.4 Biofouling test of the fabricated TFN membrane in the PRO mode
Biofouling test in the cross-flow operation mode was performed to understand the anti-biofouling effect of the 0.5 wt% fCNT composite TFN membrane for the PRO process. The biofouling formation between the CNT0.5 membrane and CNT0 membrane (i.e., bare TFC membrane) was compared in the PRO mode. Dynamic cross-flow possibly led to the increased bacteria detection by shear stress and to the low formation of biofouling on the bottom surface of the support layer in the fCNT0.5-TFN and bare TFC membranes. Even so, compared to the bare TFC membrane, the fCNT0.5-TFN membrane exhibited a low flux decrease (Fig. 6). First, bacteria in the feed solution entered the porous support layer and inevitably reduced the water flux until 500 min. After 500 min, the water flux of the membrane fabricated with 0.5 wt% of fCNTs exhibited a low decrease. After 2000 min, compared to the bare TFC membrane (CNT0), the 0.5 wt% fCNT membrane exhibited a low decline of ∼10%. This relatively less reduction of water flux might have several causes: high initial water flux of 0.5 wt% of fCNTs membrane, the reduced accumulation and growth of bacteria on the bottom surface of the support layer of the fCNT0.5-TFN membrane caused by the modified characteristic of the bottom surface – the high electrostatic repulsive force with surface charge, low roughness, and hydrophilicity of fCNT on the bottom side of the support layer.
 |
| | Fig. 6 Comparison of the biofouling flux decline of the bare TFC membrane and CNT0.5 TFN membrane in the PRO mode. | |
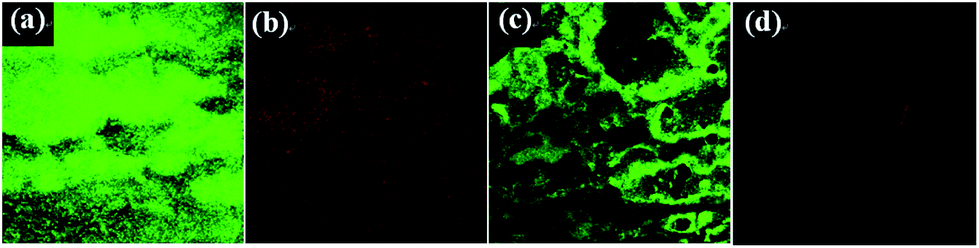
The reduced accumulation and growth of biomass on the bottom of the TFN support layer was observed by CLSM imaging. A sparser biofilm was developed on the fCNT0.5-TFN membrane compared to the bare TFC membrane (Fig. 7). Fluorescence images revealed green and red spots, corresponding to live bacteria and dead bacteria, respectively. As the biofouling test was processed in 2000 min, bacteria grew and died continuously, and it was difficult to examine the dead bacteria due to the membrane antibacterial property. Fig. 7(a and b) shows the biofilm formation on the bottom surface of the bare TFC membrane support layer: Green and red spots were observed almost everywhere, indicating that bacteria are easily attached on the bare TFC membrane support layer and grow and form a biofilm. In contrast, live or dead bacteria (E. coli) were randomly located on the bottom of the fCNT0.5 TFN support layer (Fig. 7c and d).
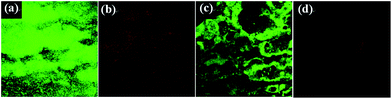 |
| | Fig. 7 Orthogonal view of the confocal laser scanning microscopy (CLSM) image of the biofouled layers on CNT0/CNT0.5 membrane in the PRO mode: (a and b) CNT0 membrane/(c and d) CNT0.5 membrane and (a and c) live bacteria on membrane/(b and d) dead bacteria on the membrane. | |
4. Conclusions
The TFN membrane with 0.5 wt% of fCNTs blended in the support layer exhibited enhanced membrane performance and anti-biofouling property in the PRO mode via the change in its bottom surface characteristic of the support layer. Compared to bare TFC membrane (CNT 0 wt%), the blended membrane exhibited an increase in the water flux, decrease in the roughness, increase in the negative surface charge, lower hydrophobic property, and decrease in the bacterial attachment. In the laboratory-scale biofouling test, compared to the bare TFC membrane, the fCNT0.5-TFN membrane exhibited a low flux decline in the PRO mode.
All things considered, CNT-composite TFN membranes demonstrate immense potential of improving the performance of membrane in the PRO process by overcoming the current biofouling problem via the decrease in the bacterial attachment and inhibition of bacterial growth as well as the increase in water flux. Furthermore, fCNT-blended membranes exhibited better performance in the anti-biofouling property via the additional functionalization of fCNTs with bio-toxic material.
Conflicts of interest
There are no conflicts to declare.
Acknowledgements
This work was supported by the project of “Development of key membranes for high efficiency seawater desalination” supported by the Korea Research Institute of Chemical Technology (KK1923-11).
References
- N. Y. Yip, A. Tiraferri, W. A. Phillip, J. D. Schiffman, L. A. Hoover, Y. C. Kim and M. Elimelech, Environ. Sci. Technol., 2011, 45, 4360–4369 CrossRef CAS PubMed.
- T. Y. Cath, A. E. Childress and M. Elimelech, J. Membr. Sci., 2006, 281, 70–87 CrossRef CAS.
- A. P. Straub, A. Deshmukh and M. Elimelech, Energy Environ. Sci., 2016, 9, 31–48 RSC.
- W. J. Lau, A. F. Ismail, N. Misdan and M. A. Kassim, Desalination, 2012, 287, 190–199 CrossRef CAS.
- B. Mi and M. Elimelech, J. Membr. Sci., 2010, 348, 337–345 CrossRef CAS.
- E. Bar-Zeev, F. Perreault, A. P. Straub and M. Elimelech, Environ. Sci. Technol., 2015, 49, 13050–13058 CrossRef CAS PubMed.
- Y.-Q. Wang, Y. L. Su, Q. Sun, X.-L. Ma and Z.-Y. Jiang, J. Membr. Sci., 2006, 286, 228–236 CrossRef CAS.
- S. T. Kang, A. Subramani, E. M. V. Hoek, M. A. Deshusses and M. R. Matsumoto, J. Membr. Sci., 2004, 244, 151–165 CrossRef CAS.
- D. Breite, M. Went, A. Prager and A. Schulze, Polymers, 2015, 7, 2017–2030 CrossRef CAS.
- N. Park, B. Kwon, I. S. Kim and J. Cho, J. Membr. Sci., 2005, 258, 43–54 CrossRef CAS.
- C. M. Magin, S. P. Cooper and A. B. Brennan, Mater. Today, 2010, 13, 36–44 CrossRef CAS.
- M. R. Hibbs, L. K. McGrath, S. Kang, A. Adout, S. J. Altman, M. Elimelech and C. J. Cornelius, Desalination, 2016, 380, 52–59 CrossRef CAS.
- I. Ihsanullah, Sep. Purif. Technol., 2019, 209, 307–337 CrossRef.
- E. Celik, H. Park, H. Choi and H. Choi, Water Res., 2011, 45, 274–282 CrossRef CAS PubMed.
- J.-H. Choi, J. Jegal and W.-N. Kim, J. Membr. Sci., 2006, 284, 406–415 CrossRef CAS.
- H. G. Choi, M. Son, S. H. Yoon, E. Celik, S. Kang, H. Park, C. H. Park and H. Choi, Chemosphere, 2015, 136, 204–210 CrossRef CAS PubMed.
- H. S. Hsieh, R. Wu and C. T. Jafvert, Environ. Sci. Technol, 2014, 48, 11330–11336 CrossRef CAS PubMed.
- C. D. Vecitis, K. R. Zodrow, S. Kang and M. Elimelech, ACS Nano, 2010, 4, 5471–5479 CrossRef CAS PubMed.
- S. Kang, M. Herzberg, D. F. Rodrigues and M. Elimelech, Langmuir, 2008, 24, 6409–6413 CrossRef CAS PubMed.
- G. Jia, H. Wang, L. Yan, X. Wang, R. Pei, T. Yan, Y. Zhao and X. Guo, Environ. Sci. Technol., 2005, 39, 1378–1383 CrossRef CAS PubMed.
- R. Zhang, Y. Liu, M. He, Y. Su, X. Zhao, M. Elimelech and Z. Jiang, Chem. Soc. Rev., 2016, 45, 5888–5924 RSC.
- A. S. Al-Hobaib, K. M. Al-Sheetan, M. R. Shaik and M. S. AI-Suhybani, Appl. Water Sci., 2017, 7, 4341–4350 CrossRef CAS.
- H. J. Kim, Y. Baek, K. Choi, D.-G. Kim, H. Kang, Y.-S. Choi, J. Yoon and J.-C. Lee, RSC Adv., 2014, 4, 32802–32810 RSC.
- M. Sianipar, S. H. Kim, Khoirddin, F. Iskandar and I. G. Wenten, RSC Adv., 2017, 7, 51175–51198 RSC.
- M. Amini, M. Jahanshahi and A. Rahimpour, J. Membr. Sci., 2013, 435, 233–241 CrossRef CAS.
- A. Kaniyoor, R. I. Jafri, T. Arockiadoss and S. Ramaprabhu, Nanoscale, 2009, 1, 382–386 RSC.
- U. J. Kim, C. A. Furtado, X. Liu, G. Chen and P. C. Eklund, J. Am. Chem. Soc., 2005, 127, 15437–15445 CrossRef CAS PubMed.
- M. Son, H. G. Choi, L. Liu, E. Celik, H. Park and H. Choi, Chem. Eng. J., 2015, 266, 376–384 CrossRef CAS.
- C. Rong, G. Ma, S. Zhang, L. Song, Z. Chen, G. Wang and P. M. Ajayan, Compos. Sci. Technol., 2010, 70, 380–386 CrossRef CAS.
- M. Rahimi, S. Dadari, S. Zeinaddini and E. Mohamadian, Korean J. Chem. Eng., 2017, 34, 1444–1455 CrossRef CAS.
- Y. Orooji, M. Faghih, A. Razmjou, J. Hou, P. Moazzam, N. Emami, M. Aghababaie, F. Nourisfa, V. Chen and W. Jin, Carbon, 2017, 111, 689–704 CrossRef CAS.
- S. Qiu, L. Wu, X. Pan, L. Zhang, H. Chen and C. Gao, J. Membr. Sci., 2009, 342, 165–172 CrossRef CAS.
- R. Rezaee, S. Nasseri, A. H. Mahvi, R. Nabizadeh, S. A. Mousavi, A. Rashidi, A. Jafari and S. Nazmara, J. Environ. Health Sci. Eng., 2015, 13, 61 CrossRef PubMed.
- K. J. Kubiak, M. C. T. Wilson, T. G. Mathia and Ph. Carval, Wear, 2011, 271, 523–528 CrossRef CAS.
- M. Arakha, M. Saleem, B. C. Mallick and S. Jha, Sci. Rep., 2015, 5, 9578 CrossRef CAS PubMed.
- C. S. Alves, M. N. Melo, H. G. Franquelim, R. Ferre, M. Planas, L. Feliu, E. Bardaju, W. Kowalczyk, D. Andreu, N. C. Santos, M. X. Fernandes and M. A. R. B. Castanho, J. Biol. Chem., 2010, 285, 27536–27544 CrossRef CAS PubMed.
- O. Rzhepishevska, S. Hakobyan, R. Ruhal, J. Gautrot, D. Barbero and M. Ramstedt, Biomater. Sci., 2013, 1, 589–602 RSC.
- G. T. Gray, J. R. McCutcheon and M. Elimelech, Desalination, 2006, 197, 1–8 CrossRef CAS.
- A. Tiraferri, N. Y. Yip, W. A. Phillip, J. D. Schiffman and M. Elimelech, J. Membr. Sci., 2011, 367, 340–352 CrossRef CAS.
- N. Widjojo, T.-S. Chung, M. Weber, C. Maletzko and V. Warzelhan, J. Membr. Sci., 2011, 383, 214–223 CrossRef CAS.
- Q. She, L. Zhang, R. Wang, W. B. Krantz and A. G. Fane, J. Membr. Sci., 2017, 542, 233–244 CrossRef CAS.
Footnote |
| † Electronic supplementary information (ESI) available. See DOI: 10.1039/c9ra08870a |
|
| This journal is © The Royal Society of Chemistry 2020 |
Click here to see how this site uses Cookies. View our privacy policy here. 
 Open Access Article
 This Open Access Article is licensed under a Creative Commons Attribution-Non Commercial 3.0 Unported Licence
 *b and
Heechul Choi
*b and
Heechul Choi