
 Open Access Article
 This Open Access Article is licensed under a Creative Commons Attribution-Non Commercial 3.0 Unported Licence
Physical properties of phospholipids and integral proteins and their biofunctional roles in pulmonary surfactant from molecular dynamics simulation
Nourddine Hadrioui,
Mohammed Lemaalem *,
Abdelali Derouiche and
Hamid Ridouane
*,
Abdelali Derouiche and
Hamid Ridouane
Laboratoire de Physique des Polymères et Phénomènes Critiques Sciences Faculty Ben M’Sik, Hassan II University, P.O. Box 7955, Casablanca, Morocco. E-mail: mohammedlemaalem@gmail.com
First published on 27th February 2020
Abstract
This work deals with a quantitative investigation of the physical properties of pulmonary surfactant near melting temperature. To this end, we make use of molecular dynamics simulations, using the MARTINI coarse-grained model, for determining the physical properties of the system, such as the potential energy, the specific heat, the microstructure, the diffusion laws, and the elastic properties of the surfactant. The microstructure is studied by computation of the radial-distribution-function upon varying the distance between constituents (lipid molecules or proteins). The diffusion phenomenon is investigated by determination of the mean-squared-displacement and the time dependent velocity-autocorrelation-function for various values of temperature. We show that the dynamics of lipids and proteins exhibit a subdiffusion regime (slow movement) due to the cage effect within pulmonary surfactant. From the obtained mean-squared-displacement, we get the values of the self-diffusion-coefficients and the anomalous exponents at different temperatures close to the melting temperature. For the mathematical description of the cage effect, we make use of the scale relations in terms of the waiting time probability distribution. The last study is concerned with determination of the dependence of the lateral stress upon the strain of pulmonary surfactant, which is found to be linear, and from which we deduce the lateral-elastic-modulus.
1 Introduction
Notions of the immaturity of the fetal lung and surface tension appeared in the twentieth century, maybe earlier. Thus, the concept of low surface tension in pulmonary alveoli became an interesting subject for scientists. In 1929, von Neergaard described1 the existence of low surface tension in the pulmonary alveoli, and in 1947, Gruenwald established2 a correlation between the surface tension and the pulmonary elasticity. In 1957, Clements discovered3 pulmonary surfactant, and in 1958, Craig et al. demonstrated4 the underlying cause of hyaline membrane disease, surfactant deficiency, fostering ever more vigorous efforts to reduce neonatal mortality in the burgeoning practice of neonatology. Fujiwara and Adams5 introduced surfactant substitution in Japan in 1980, for the treatment and prevention of respiratory distress syndrome.Pulmonary surfactant is a complex structure, composed of 90% lipids and 10% proteins, and is strikingly comparable across various species including humans.6 The majority of the surfactant lipids are phospholipids (80–90%), of which phosphatidylcholine (PC) is quantitatively the most important, accounting for 70–80% of the total lipids.7 Four surfactant proteins have so far been identified in pulmonary surfactant,8 namely, SP-A, SP-B, SP-C and SP-D, which have different functions. They are either exclusively lung associated or predominately found in the lung.8–10 The main function of the surfactant is to reduce the surface tension at the air–liquid interface in the alveoli, in a manner that depends on the alveolar surface area. The reduction of surface tension at the very extensive alveolar surface promotes lung expansion on inspiration and prevents lung collapse on expiration. Thus, the surfactant plays a major role in the pressure–volume characteristics of the lung and in gas exchange. However, the presence of the proteins, particularly SP-B and SP-C, is absolutely required for interfacial adsorption, film stability, and respreading capacities.11,12 SP-B and SP-C are small hydrophobic polypeptides that play crucial roles in the formation and stabilization of pulmonary surfactant films.13 In contrast to SP-B, the surfactant protein SP-C is not absolutely required for survival. However, targeted deletion of the SP-C gene in mice leads to the development of severe progressive pneumonitis depending on the genetic background.14,15 Experimental data suggest that SP-C would be required to maintain the association of the surfactant complexes (reservoirs) with the interfacial film in the most compressed states, i.e., those reached at the end of expiration.9 The SP-C-promoted attachment would then facilitate the reinsertion of the surface-active molecules from the reservoirs, with the probable critical participation of SP-B during the re-expansion.11,16–19 Some authors have suggested18,20 the existence of SP-C/cholesterol complexes within the bilayer membranes; however, both direct evidence and a model explaining the role of SP-C/cholesterol interactions in surfactant function are lacking. It has been proposed that cholesterol could contribute in preventing SP-C from aggregating, leading to better miscibility of the protein into the monolayers.20 On the other hand, a previous study suggested that concomitant changes in the concentrations of cholesterol and SP-C may occur in the surfactant of heterothermic animals, and therefore, the roles of these two molecules in the surfactant may be connected.21
The present study is motivated by the interest in pulmonary surfactant in many disciplines such as biological research and as an exogenous surfactant treatment to neonates in medicine. The aim is to rely on the physical properties of the pulmonary surfactant components to understand its physiological roles.
In recent years, molecular simulations have become an excellent tool for studying the physicochemical behavior of biological membranes, especially with the advancement in computational tools.22–24 Numerous studies in relation to pulmonary surfactant have been accomplished using simulation methods.
In this context, Wang and Frenkel have proposed25 a simple model of the amphiphilic bilayer, in order to reproduce the elastic properties, using Monte Carlo simulations. They have shown that such a model gives a good description of the elastic properties and agrees with experiments. Also, they have observed that the solid phase exists only at low temperature, whereas at ambient and high temperatures, the bilayer membrane is in the liquid state. Also, Freites et al. have performed26 an all-atom MD simulation on a model system, composed of a monolayer of palmitic acid and a surfactant protein B peptide SP-B. They have shown that the palmitic acid/SP-B monolayer is stable in a wide range of lipid specific areas in regions of the monolayer containing tilted and untilted condensed phases. S. Baoukina and D. P. Tieleman27 presented a review of recent simulation studies on the properties of lipid–protein interactions, and the effects of nanoparticles on lung surfactant. In another work, Q. Hu et al.28 investigated the interaction between nanoparticles and the pulmonary surfactant system in alveolar fluid, using coarse-grain molecular dynamics simulations. Their simulation results revealed that, when brought into contact with pulmonary surfactant, silver and polystyrene nanoparticles are immediately covered with a biomolecular corona composed of both lipids and proteins. In another recently published paper, K. Dutta et al.29 studied the paradoxical bactericidal effects of hydrophobic lung surfactant proteins and their peptide mimics using a molecular Trojan horse liposome. This study has alarming implications in using high dosage exogenous surfactant for treatment of respiratory distress syndrome, genetic knock-out abnormalities associated with these proteins, and the novel roles played by SP-B/C as bactericidal agents.
In the present work, we are interested in the study of several physical aspects of a pulmonary surfactant system near melting temperature. For the sake of simplification, we proposed a system composed of SP-B and SP-C integral proteins, and a phospholipid bilayer, with water as an explicit solvent at the interfaces. To determine the physical properties of the surfactant, we used MD simulations using the MARTINI coarse-grained force-field. These simulations allow us to determine the melting temperature, structure (through the radial-distribution-function), dynamics (subdiffusion laws via the mean-squared-displacement and velocity-autocorrelation-function), and mechanical properties of pulmonary surfactant by the lateral-elastic-modulus.
Our results show the importance of the phospholipids and integral proteins in the physiological role of pulmonary surfactant. The analysis of the simulation results suggests that, at human body temperature, the surfactant is in the gel phase, due to the presence of congested proteins and locally condensed lipids. These constituents are also characterized by slow diffusion, called subdiffusion, and significant stiffness against stretching and compression during the breathing cycle.
2 System model
Pulmonary surfactant exists as a bilayer membrane, composed of 90% phospholipids and 10% proteins. The phospholipid composition of pulmonary surfactant of different species has been elucidated by Veldhuizen and Haagsman.30 Thus, PC molecules represent approximately 80% of the total phospholipids, of which more than half are disaturated (in gel phase). DPPC represents approximately 40%. Other constituents are 16:0, 18:2 PC (18%), 16:0, 18:1 PC (20%) and 16:0, 16:1 PC (13%). Phosphatidylglycerol (PG) is approximately 10% of the lipid pool and small amounts of (lyso) phosphatidic acid (PA), phosphatidylinositol (PI) and phosphatidylethanolamine (PE) are found.31 However, dipalmitoylphosphatidylcholine (DPPC) is considered to be primarily responsible for the low surface tension of pulmonary surfactant.32 In contrast, fluid-phase phospholipids or charged phospholipids are good fluidizers that promote adsorption and spreading.32 It must be mentioned that fluidizers limit the minimum surface tension of pulmonary surfactant that can be obtained during its lateral compression (expiration). For this, during the compression, the fluidizers are selectively ejected into the aqueous sub-phase by a fold formation, which induces an increase in the DPPC concentration in the lung surfactant monolayer.32,33 Therefore, very low surface tensions keep the cell open and promote respiration. We recall that pulmonary surfactant contains other phospholipids, such as phosphatidylethanolamine (PE) and sphingomyelin (SM). These appear as minor components accounting for about 5% of pulmonary surfactant.34 These lipids most likely come from other cell membranes.35,36 Therefore, as noted in some experimental reports,37,38 PE and other minor lipids are not responsible for the biophysical function of pulmonary surfactant. Hence, for simplicity, they are not introduced in the proposed model.The proteins which exist in the structure of pulmonary surfactant are SP-A, SP-B, SP-C, and SP-D. These proteins can be divided into two groups: small hydrophobic proteins (SP-B and SP-C) and larger hydrophilic proteins (SP-A and SP-D).
Many experimental studies have been conducted to study the three-dimensional structure of SP-B as an atomic representation,39,40 giving rise to an overview of the SP-B conformation and disposition in pulmonary surfactant. According to these studies, SP-B is a hydrophobic protein consisting of 79 amino acids, with molecular weight of about 9 kDa. It is in the form of dimers and trimers (respectively two and three repetitive units). Because of its hydrophobicity, it will preferentially interact with the lipid-tails, as has been shown using the electron paramagnetic resonance technique.11 One of the most important roles of SP-B is the stabilization of lipid structures at the water–liquid interface. Thus, the presence of SP-B consolidates the lipid structures, and at the same time, improves their mechanical properties during the cyclic compression-expansion movements of the respiratory system. SP-C consists of 35 amino acids, and has a molecular weight between 3 and 5 kDa. Its three dimensional structure was determined by Johansson et al.41 using the nuclear magnetic resonance technique.
The structure showed a valyl-rich α-helix formed by amino acids. It was also well matched with the analysis of the secondary structure by circular dichroism and Fourier transform infrared spectroscopy. During the respiratory cycle, SP-C is required to maintain the combination of the pulmonary surfactant with the interfacial film at the end of exhalation. Then, SP-C facilitates the re-insertion of the surfactant molecules into the reservoir during re-expansion.16–19 The integral proteins SP-B and SP-C account for approximately 2% of the total surfactant weight.
SP-A and SP-D, which constitute approximately 6% of the total surfactant-weight,13 are surfactant-associated water-soluble proteins. These proteins play an important role in host defense but have little effect on the biophysical properties of the surfactant.42 We note that pulmonary surfactant can contain other proteins accounting for approximately 2% of the total surfactant weight.
In this study, we are interested in the biophysical properties of pulmonary surfactant. Thus, the proposed model for pulmonary surfactant used in this study consists only of phospholipids and integral proteins (SP-B and SP-C).
3 Simulation method
3.1 Coarse-grained model
Using a CG-model allows the extension of the spatial and temporal scales of the simulations, compared with an all-atom model. The MARTINI force field is one of the widely used CG-models in MD simulations.43,44 In this model, the PC head-group consists of two hydrophilic groups: choline (Q0 type) and a phosphate group (Qa type). The first carries a positive charge +e, and the second, a negative one −e. In addition, there are Na particles, which refer to the intermediate polarity glycerol moieties. The tail double bonds can be efficiently modeled using slightly less hydrophobic beads (C1), as well as a change in the angle interaction-potential that governs the rigidity and orientation of the lipid-tails. The coarse-grained representation of PG resembles that of PC, but PG has a P4 bead instead of a Q0 bead. The water bead uses the P4 model.43The two hydrophobic surfactant proteins, SP-B and SP-C, were constructed using their all-atom models obtained from the Protein Data Bank. The all-atom models were then transferred to the corresponding coarse-grained models with the martinize.py script provided by the MARTINI force field. This transformation gives a coarse-grained representation similar to the α-helix model. This model is adopted in several recent reports.13,27–29 In the MARTINI model, each amino acid is represented by a single bead that can be polar (sL), non-polar (sH) or neutral (tN). The sL and sH beads are mutually repulsive and differ only in the parameterization of their respective dihedral potentials. The coarse-grained protein scheme has also been well discussed in the literature by Monticelli et al.44 and in other work by Bellesia et al.45
3.2 Simulation details
To investigate quantitatively the physical properties of pulmonary surfactant using the MD simulation method, using the MARTINI CG-model, we have simulated a model of pulmonary surfactant, consisting of 10![[thin space (1/6-em)]](https://www.rsc.org/images/entities/char_2009.gif) 000 different phospholipid molecules, according to the percentages discussed in Section 2, doped with 64 integral proteins (32 SP-C and 32 SP-B), and hydrated by 93600 water beads at the interfaces. MD simulations were performed using the LAAMPS software package.22 Initially, the surfactant is centered in an orthogonal simulation box (length: lx = ly = 450 Å, lz = 180 Å), with an explicit water interface. After that, the system was subjected to an energy minimization, to correct the lengths of the bonds and to ensure the optimal particle distribution, for 50000 steps. Then, the system is equilibrated in the NPT-statistical ensemble, using the Berendsen barostat,46 at ambient conditions of temperature and pressure (T = 300 K, P = 1 bar) for 1000000 time-steps with a time-step length of 10 fs. Next, the system is equilibrated in the NVT-statistical ensemble using the Langevin thermostat for another 1000000 time-steps. We note that the area per lipid obtained after this equilibration is 0.46 nm2. This value is less than the area per lipid for the pure DPPC bilayer, which is around 0.63–0.65 nm2. In this context, Wolf et al. have shown48 that the inclusion of the protein molecules reduces the area per lipid following the behavior Alip = 2 × (Axy − Aprot)/nlip, where nlip is the number of lipids, Axy is the membrane area and Aprot is the protein area. Therefore, it seems reasonable to take into account the presence of the proteins and the other phospholipids. Generally, the presence of the included molecules in the lipid bilayer reduces the area per lipid.47,48 Once the system is balanced, we move to the production stage of the results. The physical properties that we will discuss in this article are determined as follows: first, we compute the melting temperature, using a heating process, for a temperature range from 100 to 600 K, with a heating rate of 1011 K s−1. Second, we determine the structure and dynamics properties in the canonical ensemble. To this end, a series of MD simulations in the NVT-ensemble have been carried out for various temperatures close to the melting temperature. The temperature was kept constant using the Nose–Hoover thermostat. MD simulations were performed for 2000000 time-steps and the motion equations were integrated using the Verlet integrator, giving a simulation time of 20 ns, with a time-step length of 10 fs. The results were written in the output files every 100 time-steps. Finally, from an initial configuration balanced in the NPT-ensemble, with P = 1 bar and T = 300 K, we perform a uniaxial strain MD simulation to determine the stretching-modulus.
000 different phospholipid molecules, according to the percentages discussed in Section 2, doped with 64 integral proteins (32 SP-C and 32 SP-B), and hydrated by 93600 water beads at the interfaces. MD simulations were performed using the LAAMPS software package.22 Initially, the surfactant is centered in an orthogonal simulation box (length: lx = ly = 450 Å, lz = 180 Å), with an explicit water interface. After that, the system was subjected to an energy minimization, to correct the lengths of the bonds and to ensure the optimal particle distribution, for 50000 steps. Then, the system is equilibrated in the NPT-statistical ensemble, using the Berendsen barostat,46 at ambient conditions of temperature and pressure (T = 300 K, P = 1 bar) for 1000000 time-steps with a time-step length of 10 fs. Next, the system is equilibrated in the NVT-statistical ensemble using the Langevin thermostat for another 1000000 time-steps. We note that the area per lipid obtained after this equilibration is 0.46 nm2. This value is less than the area per lipid for the pure DPPC bilayer, which is around 0.63–0.65 nm2. In this context, Wolf et al. have shown48 that the inclusion of the protein molecules reduces the area per lipid following the behavior Alip = 2 × (Axy − Aprot)/nlip, where nlip is the number of lipids, Axy is the membrane area and Aprot is the protein area. Therefore, it seems reasonable to take into account the presence of the proteins and the other phospholipids. Generally, the presence of the included molecules in the lipid bilayer reduces the area per lipid.47,48 Once the system is balanced, we move to the production stage of the results. The physical properties that we will discuss in this article are determined as follows: first, we compute the melting temperature, using a heating process, for a temperature range from 100 to 600 K, with a heating rate of 1011 K s−1. Second, we determine the structure and dynamics properties in the canonical ensemble. To this end, a series of MD simulations in the NVT-ensemble have been carried out for various temperatures close to the melting temperature. The temperature was kept constant using the Nose–Hoover thermostat. MD simulations were performed for 2000000 time-steps and the motion equations were integrated using the Verlet integrator, giving a simulation time of 20 ns, with a time-step length of 10 fs. The results were written in the output files every 100 time-steps. Finally, from an initial configuration balanced in the NPT-ensemble, with P = 1 bar and T = 300 K, we perform a uniaxial strain MD simulation to determine the stretching-modulus.
4 Results and discussion
4.1 Thermodynamical properties
The surfactant is very deformable, even under low mechanical stress. The water molecules of the aqueous medium at the interface are subjected to Brownian movement, distributing the heads of the lipids of the bilayer membrane. Such movement creates ripples on the surface of the surfactant. Each head in the bilayer membrane is then animated, with small rapid movements around its equilibrium position. The origin of these movements remained unclear until 1975 when Brochard and Lennon showed49 that the same movements may be caused by thermal agitation. In this context, Marrink et al. simulated50 the coarse-grained transition from a gel phase to a fluid phase in pure DPPC bilayers, using a heating process. Their observations were in agreement with experimental findings, and showed that the ordered phase obtained using the CG-model was a gel phase, rather than a crystalline phase. In this study, we present a CG-MD simulation for a phospholipid–protein mixture in aqueous solution, for an understanding of the physical aspects of pulmonary surfactant near melting temperature. The potential energy, denoted as Ep, of the pulmonary surfactant components (lipids and proteins) is the sum of all pairs of particles, bonds, angles, and dihedral energies. During the heating process, where the temperature is ranging from 100 to 600 K, the potential energy is temperature dependent. The specific heat (per particle) at a constant volume is given by the standard relation
 | (1) |
Fig. 1(a) illustrates pulmonary surfactant in the gel phase, for T = 293 K, which is below the melting temperature (about 320 K). But, above this temperature, the bilayer membrane begins to fluctuate. Beyond the melting temperature, as shown in Fig. 1(b), at T = 333 K, the bilayer membrane is in the liquid phase. Therefore, the transition from the gel phase to the liquid phase occurs at the melting temperature, TM.
 | ||
| Fig. 1 The simulated pulmonary surfactant model in an orthogonal simulation box of lengths lx = ly = 425 Å and lz = 100 Å, at two different temperatures: (a) T = 293 K and (b) T = 333 K. The structure was generated using the Moltemplate package (https://moltemplate.org/),24 and visualized using the Ovito software (https://ovito.org).23 The lipid tails C1 are represented in white, the different heads of each lipid are presented in yellow (Na), purple (Qa) and blue (Q0, P4), the water beads are presented in turquoise, and the protein beads are presented in black (sH), cyan (sL) and green (sN). More detailed information about the MARTINI coarse-grained representation and parametrization of the interaction potentials of lipids, proteins (amino acids) and water can be found on the MARTINI home page (http://cgmartini.nl/). | ||
In Fig. 2, we report the variation of the specific heat (solid line + triangles in blue) and potential energy (solid line + spheres in black) with temperature, calculated using a heating rate of 1011 K s−1. At fixed surfactant area, we find that the potential energy increases with increasing temperature, and its variation becomes steeper beyond the melting temperature. In particular, the energy exhibits a jump at this temperature, which is a signature of a first-order phase transition. The specific heat exhibits a peak at the melting temperature, which equals 320 K, marking the possibility of the appearance of a solid phase at physiological temperatures. Several experimental studies have been carried out on a pure DPPC bilayer and revealed that TM = 314 K.51,52 We note that the insertion of the proteins leads to an increase of the melting temperature, TM, since their presence has a tendency to rigidify the bilayer membrane. We expect that TM increases with the protein fraction, Φ, as: TM = T0M + AΦx, with exponent x > 1. Here, T0M represents the melting temperature relative to surfactant free from proteins.
 | ||
| Fig. 2 Potential energy (Ep) and specific heat (CV) of pulmonary surfactant versus temperature, for a heating rate of 1011 K s−1. | ||
From the literature, Yan et al. conducted an experimental study to determine the melting temperature of pulmonary surfactant.53 Thus, the authors found that TM is significantly higher in the lungs than in the lipid bilayer. Their results indicate that the change in pulmonary mechanics should occur in the range of 321–328 K.53 Our results are in good agreement with the experimental results discussed above. In addition, the present study provides a clear overview of other physical properties at temperatures near the melting point, including physiological temperatures. Also, it should be noted that the physical properties of pulmonary surfactant are still not completely understood and are different from those of simple lipid bilayers.
4.2 Structural properties
The study of the local structure of the lipids and proteins around the melting temperature is carried out by analyzing the radial-distribution-function (RDF) obtained from MD simulations. The RDF can be viewed as the probability of finding a particle distributed around a given (central) particle. In fact, the RDF provides information on the local structure of a group of coarse-grained beads among the various beads in the system. The RDF is defined, as usual, by the following thermal average
 | (2) |
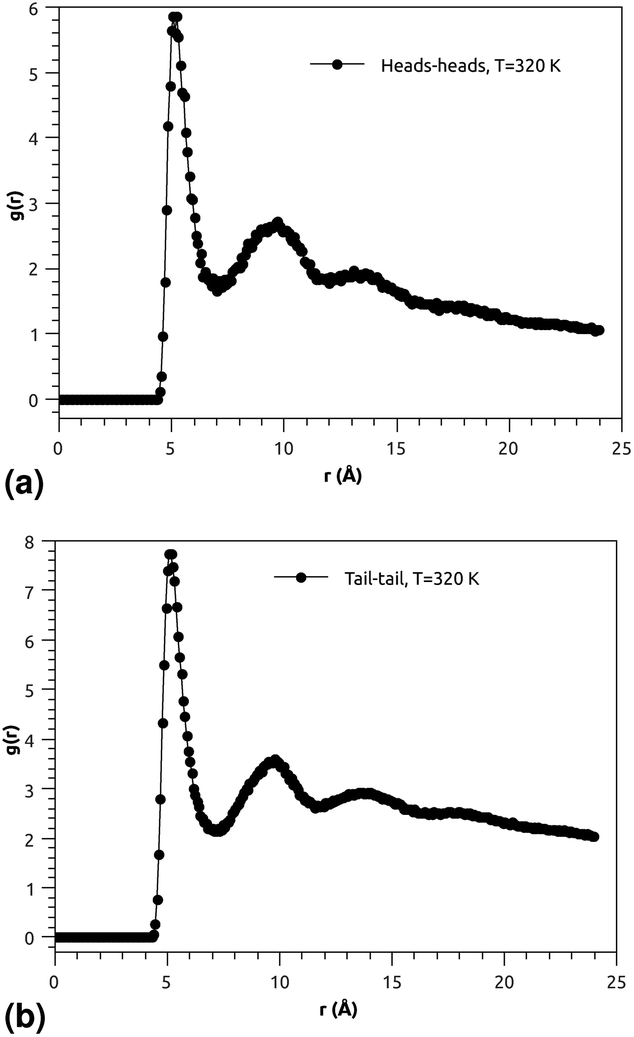 | ||
| Fig. 3 (a) RDF of the group of head molecules, and (b) RDF of the group of tail molecules. | ||
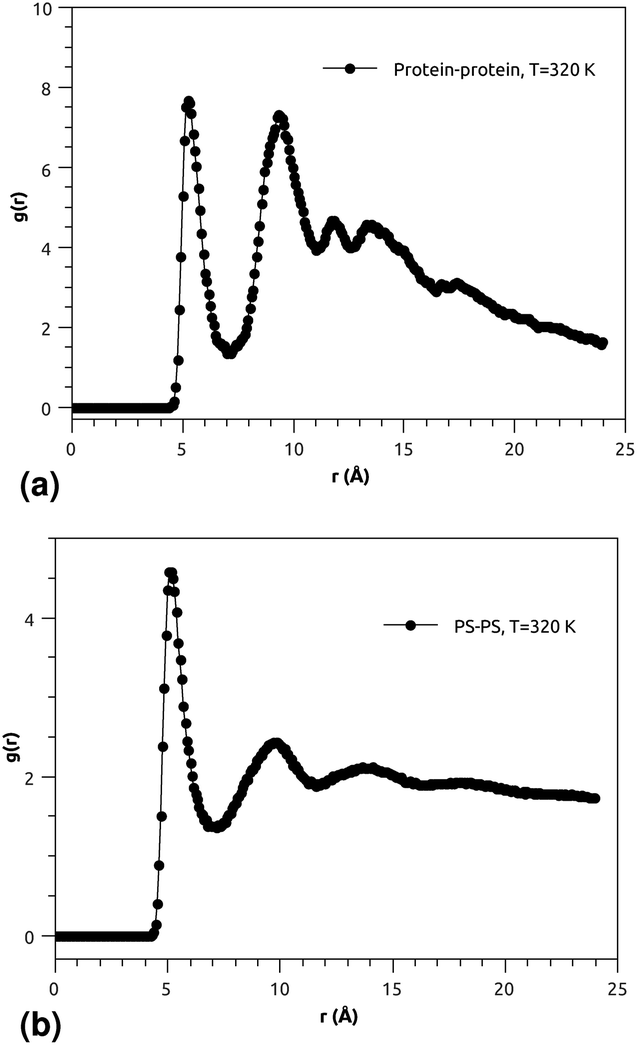 | ||
| Fig. 4 (a) RDF of the group of proteins, and (b) RDF of the group of pulmonary surfactant constituents (phospholipid molecules and proteins). | ||
Fig. 3(a) and (b) indicate that the phospholipid molecules exist in a condensed liquid phase, which is characterized by the presence of short-range order (for the closest neighbors). This liquid behavior has been shown experimentally54 for long-range lipids (heads and tails). Fig. 4(a) suggests that the proteins exhibit a congested structure, close to a solid, which manifests itself in the form of intense and narrow peaks (for the first and second closest neighbors) in the RDF. The position of the first peak is the average distance between the lipid head groups (about 5 Å), which are inside pores formed by the integral proteins, while the second peak accounts for the pore radius (about 9.5 Å), in agreement with the literature.55,56
Fig. 4(b) shows the RDF of the surfactant molecule group (phospholipid molecules and proteins). This figure reveals that the structure of pulmonary surfactant is almost identical to the lipid structure. This means that the inclusion of the proteins, with a small percentage of (10%), has a minor influence on the static structure of the surfactant. The computation of RDFs for temperatures close to the melting point suggests that there is no remarkable influence on the surfactant structure. These findings may be useful for theorists who are interested in the determination of the effective interactions between the proteins which are included in the bilayer membrane, where the latter may be considered a two dimensional continuum fluid. They can, therefore, consider the proteins as nanoparticles in a two dimensional solvent, but this ignores the fact that the proteins have slow dynamics in comparison with lipids, and a solid-like structure.
4.3 Dynamical properties
 | (3) |
In the expression above, rn(t) represents the two dimensional time position of a constituent n, which is a protein or a phospholipid molecule. Here, t denotes time and t0 is the initial time at which the tracer (random walker or target) starts moving. In our case, the tracer is a phospholipid molecule or a protein.
Due to thermal agitation, the proteins and phospholipids exhibit lateral diffusion. Their motion is hampered by the presence of other neighboring entities. As a consequence, a given tracer (a protein or a phospholipid molecule) exhibits an anomalous diffusion that we are interested in. In comparison to normal or Brownian diffusion, the anomalous diffusion is slower, due to the extreme difficulty with which a particle moves in a complex structure. This kind of diffusion is usually referred to as subdiffusion, and it is characterized by an MSD which behaves as
| W(t) = 2dDαtα, 0 < α < 1. | (4) |
|
logW(t) = log(2dDα) + αlogt.
| (5) |
This equality means that the anomalous exponent α is simply the slope of the logarithm of MSD, logW, as a function of logt, and the generalized-diffusion-coefficient, Dα, can be determined by extrapolation to the vertical axis.
We emphasize that subdiffusion is a feature of crowded systems, where the trajectories of the mobile constituents are strongly correlated. Notice that the above scaling relation is valid for long times, which are beyond some characteristic times depending on the specific details of the diffusion process and the structure of the host medium. In general, a particle is said to be subdiffusive if the condition W(t)/t → 0, for t → +∞, is satisfied (very slow diffusion). This explains why the anomalous exponent α must be in the interval 0 < α < 1.
Another interesting dynamic quantity to consider is the velocity-autocorrelation-function (VACF), denoted as cvv(t). The latter is simply the time-average: cvv(t) = 〈v(t) × v(0)〉, where v(t) is the velocity of the tracer at time t. We recall that the MSD and VACF are connected by67
 | (6) |
According to the asymptotic time behavior in eqn (4), the VACF then scales as
| cvv(t) = 2Dαα(α − 1)tα−2, 0 < α < 1, | (7) |
Quantitatively, the cage effect can be studied through the waiting time probability,69 denoted as P(τ). For the reasoning, we can assimilate the membrane surface to a regular two dimensional lattice on which the tracer moves at random and may diffuse from time to time, with Nc mobile traps forming a cage (a surface on the bilayer membrane) that confines this tracer. The latter has to wait for a time τ on each site before performing the next jump. In fact, this waiting time is a random variable independently chosen for each new jump according to a distribution, P(τ). The problem dealt with here is called a “continuous time random walk” in the literature.70
After a characteristic long time, tc, the tracer leaves its cage. Physically, this time is simply the stay duration in the cage formed by the neighbors. It is related to the mean waiting time, 〈τ〉, calculated with the probability, P(τ), by the following simple formula70
| tc = Nc〈τ〉. | (8) |
When the distribution, P(τ), is board, it behaves as70
| P(τ) ∼ τ−(1+α), τ < tc. | (9) |
At long times, that is for τ > tc, this distribution falls exponentially. Here, 0 < α < 1 is the anomalous exponent, characterizing the long-time behavior of the MSD, according to relation (4). Using relation (9), we find that the mean waiting time is given by
 | (9a) |
| tc ∼ τ0N1/αc. | (10) |
It is noted that both the tracer and the mobile traps diffuse normally among themselves and anomalously with the molecules of the host liquid (the bilayer membrane).
We emphasize that the above scaling-relation can be rapidly recovered by equating the linear-size of the confinement space (cage), aN1/2c, to the square-root of the MSD, taken at t = tc. Using eqn (4) for the MSD yields formula (10).
Now, if the mobile traps form an aggregate of fractal dimension, dF, we find that, in this case, the stay duration scales with Nc as
| tc ∼ τ0N2/αdcF. | (10a) |
Notice that, in order to get this scaling-relation, we have equated the linear size of the confinement space (aggregate), aN1/dcF, to the square-root of the MSD, at t = tc. The above behavior may be applied to proteins with high density, where these are aggregated due to the attractive van der Waals forces between them. Finally, notice that, if the tracer diffuses with the surrounding traps in Euclidean space, we would have dF = 2, and then, the scaling-relation (10) is recovered.
The next step consists of determining the dynamic characteristics of the constituents (lipid molecules or proteins) within the bilayer membranes, using MD simulations.
 | (11) |
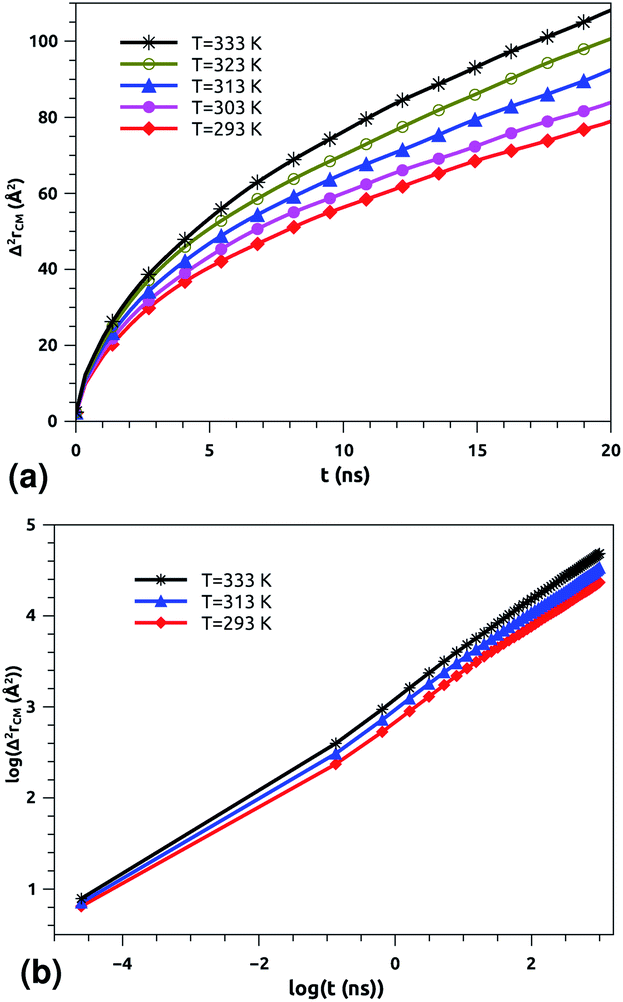 | ||
| Fig. 5 Lateral mean-squared-displacements of the phospholipid molecules versus time: (a) MSDs and (b) log–log plots of MSDs. | ||
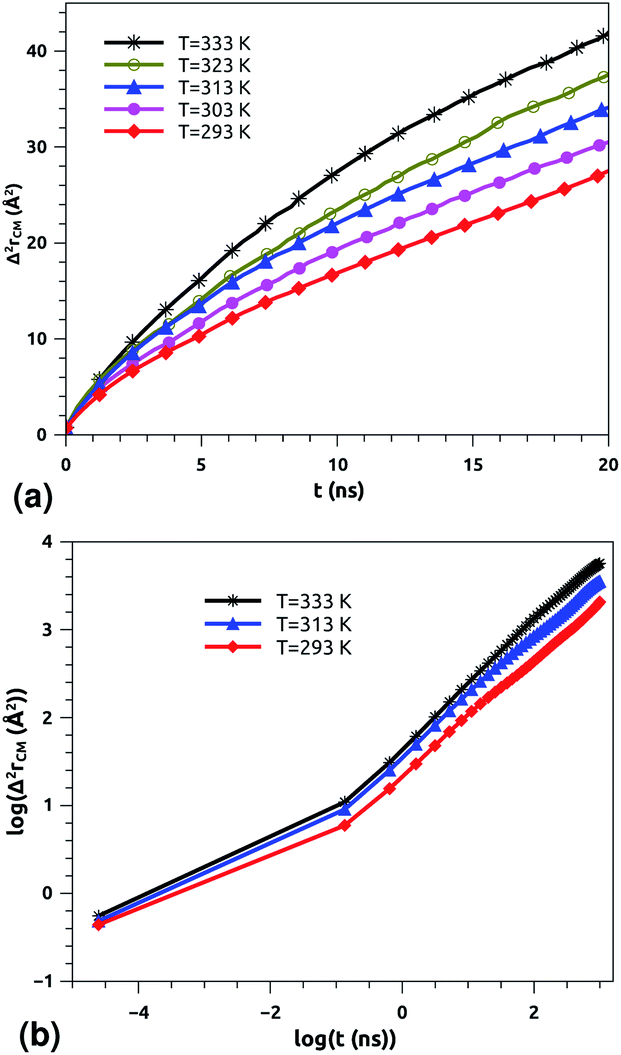 | ||
| Fig. 6 Lateral mean-squared-displacements of the proteins with time: (a) MSDs and (b) log–log plots of MSDs. | ||
Of course, this characteristic time is temperature dependent. Its temperature dependence will be discussed below. Tables 1 and 2 summarize the computed anomalous exponents and the associated generalized-diffusion-coefficients for the lipids and proteins for various values of temperature (near the melting point) and time-regimes R1 and R2. These tables clearly show that the anomalous exponent does not depend on temperature (around the melting point), while the generalized-diffusion-coefficient does. But, the values of these two quantities are naturally different for the time-regimes R1 and R2. We notice that the generalized-diffusion-coefficient increases with increasing temperature. Since this coefficient is essentially the inverse of the medium viscosity, we expect that this coefficient follows the following Arrhenius-like law:
| Dα(T) = Aαe−Bα/T. | (12) |
| log(Dα(T)) = log(Aα) − Bα/T, | (12a) |
| Aα1 ≃ 8.21 × 10⁻⁷, Bα1 ≃ 289.94 K, (R1), | (12b) |
| Aα2 ≃ 36.5 × 10⁻⁷, Bα2 ≃ 631.43 K, (R2) | (12c) |
| Aα1 ≃ 10.00 × 10⁻⁸, Bα1 ≃ 256.88 K, (R1), | (12c) |
| Aα2 ≃ 130.40 × 10⁻⁸, Bα2 ≃ 759.12 K, (R2) | (12d) |
| Regime | T (K) | α | Dα (cm2/tα) |
|---|---|---|---|
| R1 | 293 | 0.37 | 3.07 × 10⁻⁷ |
| 303 | 0.37 | 3.14 × 10⁻⁷ | |
| 313 | 0.37 | 3.23 × 10⁻⁷ | |
| 323 | 0.37 | 3.35 × 10⁻⁷ | |
| 333 | 0.37 | 3.45 × 10⁻⁷ | |
| R2 | 293 | 0.53 | 4.24 × 10⁻⁷ |
| 303 | 0.53 | 4.5 × 10⁻⁷ | |
| 313 | 0.53 | 4.85 × 10⁻⁷ | |
| 323 | 0.53 | 5.2 × 10⁻⁷ | |
| 333 | 0.53 | 5.45 × 10⁻⁷ |
| Regime | T (K) | α | Dα (cm2/tα) |
|---|---|---|---|
| R1 | 293 | 0.19 | 4.18 × 10⁻⁸ |
| 303 | 0.19 | 4.31 × 10⁻⁸ | |
| 313 | 0.19 | 4.44 × 10⁻⁸ | |
| 323 | 0.19 | 4.53 × 10⁻⁸ | |
| 333 | 0.19 | 4.65 × 10⁻⁸ | |
| R2 | 293 | 0.65 | 9.50 × 10⁻⁸ |
| 303 | 0.65 | 1.07 × 10⁻⁷ | |
| 313 | 0.65 | 1.16 × 10⁻⁷ | |
| 323 | 0.65 | 1.22 × 10⁻⁷ | |
| 333 | 0.65 | 1.31 × 10⁻⁷ |
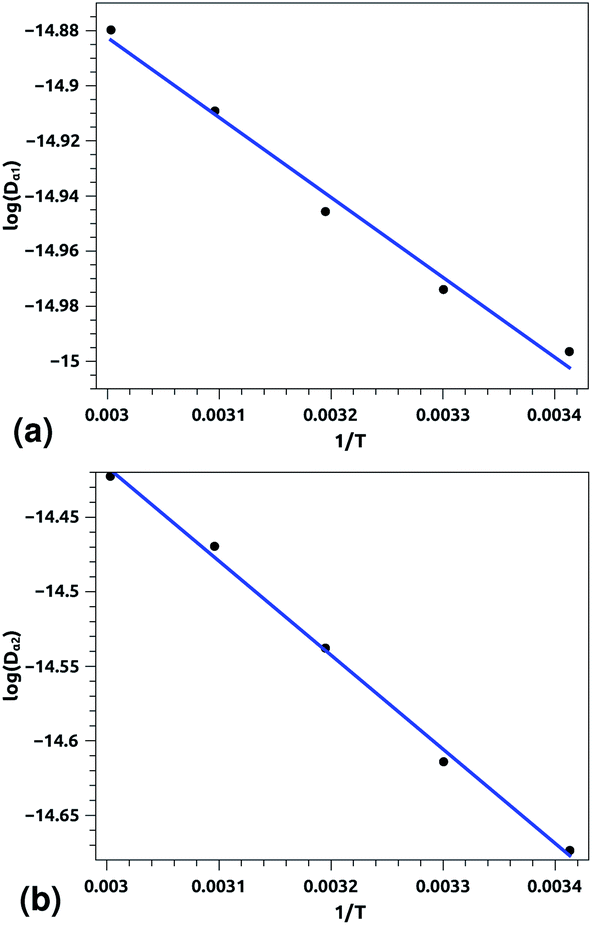 | ||
| Fig. 7 Arrhenius equation fits to the calculated diffusion coefficients Dα for the pulmonary surfactant lipids, for five values of temperature (293, 303, 313, 323, and 333 K). (a) Dα1 corresponding to the first regime, (b) Dα2 corresponding to the second regime. Inverse temperatures are given in K−1. | ||
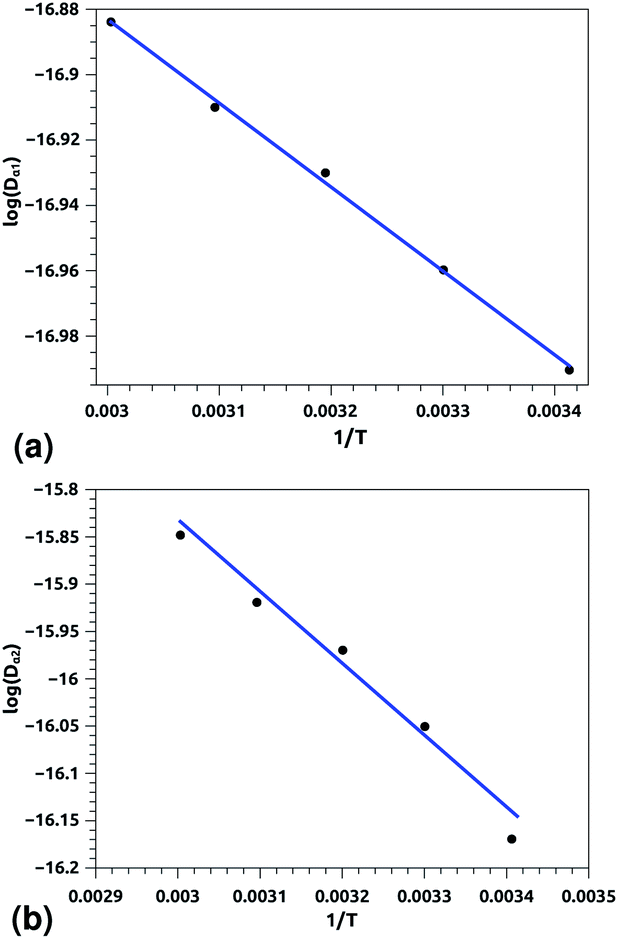 | ||
| Fig. 8 Arrhenius equation fits to the calculated diffusion coefficients Dα for the pulmonary surfactant proteins, for five values of temperature (293, 303, 313, 323 and 333 K). (a) Dα1 corresponding to the first regime, (b) Dα2 corresponding to the second regime. Inverse temperatures are given in K−1. | ||
In a recent series of reports, Matti Javanainen, Ralf Metzler and their coworkers71–77 studied the anomalous dynamics and subdiffusion in protein–lipid mixture bilayers, using all-atom and coarse-grained MD simulations and single-particle tracking experiments. For a pure lipid bilayer with different molar fractions of incorporated proteins, the authors observed anomalous diffusion of lipids with a scaling exponent α ≃ 0.8 below a crossover time of τc ≃ 10 ns,71,72 which is a long subdiffusion time. Also, they found that the calculated diffusion coefficient of lipids is of the order of 10−7 cm2 s−1 and decreases proportionally to the protein molar fraction. In this work, we found that the scaling exponent for the phospholipid mixture in pulmonary surfactant is α ≃ 0.53. This value is slightly lower than the value found in the work of R. Metzler et al. (α ≃ 0.8), and this can be explained by the fact that the variety of lipids with different tail lengths and the proteins included in the surfactant may form cage-like environments.78 Thus, this heterogeneity causes slower and more pronounced anomalous diffusion of lipids in pulmonary surfactant. The calculated diffusion coefficient of lipids is also found to be in good agreement with previous MD simulations and experimental work.71,72,79
According to Matti Javanainen et al.,71,72 the protein–lipid mixture in the crowded case corresponding to a molar fraction of 1:50, which is close to the pulmonary surfactant protein–lipid molar fraction (10:100), is characterized by slow diffusion with a scaling exponent α ≃ 0.65 and a diffusion coefficient of the order of 10−8 cm2 s−1. From the present study, the subdiffusion exponent of the proteins in pulmonary surfactant was found to be α = 0.65. These results are in the order of those found by Matti Javanainen et al.71,72 Also, the obtained diffusion coefficient of proteins, which is in the order of 10−8 cm2 s−1, agrees with the experimental findings.80–82 Thus, anomalous diffusion is an inherent property of both lipids and proteins in pulmonary surfactant. The time scales of the anomalous diffusion coefficients depend on temperature, following an Arrhenius law, whereas the anomalous diffusion exponents do not. It should be noted that the generalized-diffusion-coefficients, Dα, of proteins are less than those of phospholipid molecules. Thus, the proteins diffuse slowly compared to the lipid molecules in pulmonary surfactant.
According to Tables 1 and 2, invoked above, the crossover-time, τ*, decreases on increasing the temperature toward the melting point. Also, it follows the Arrhenius law:
 | (13) |
Since α2 > α1 and Bα2 > Bα1, τ*(T) is a decreasing function of temperature. Explicitly, we have the closer forms
| τ*(T) = 1.91 × 10⁻⁴ × e1924.20/T, phospholipid molecules, | (13a) |
| τ*(T) = 7.70 × 10⁻³ × e943.44/T, proteins. | (13b) |
Table 3 summarizes the crossover-times, τ*, for the lipid molecules and proteins, for three values of temperature close to the melting point. This table indicates that the second time-regime, R2, is reached later by the proteins, in comparison with the lipids.
| Molecules | T (K) | τ* (ns) |
|---|---|---|
| Phospholipid molecules | 293 | 0.1358 |
| 313 | 0.0893 | |
| 333 | 0.0617 | |
| Proteins | 293 | 0.1927 |
| 313 | 0.1568 | |
| 333 | 0.1308 |
4.4 Mechanical properties
Canham,83 Helfrich,84 Evans,85 and Needham and Evans86 have noted that the mechanical properties of bilayer membranes can be described in terms of the curvature energy. Thanks to this pertinent discovery, it was possible to investigate the various forms of vesicles and their interaction with soft or hard interfaces. Thus, the elastic properties of pulmonary surfactant made it possible to explain some properties of the alveolar cells and their ability to perform specific movements.From an initial configuration balanced in the NPT-ensemble, with P = 1 bar and T = 300 K, we perform a uniaxial tensile strain MD simulation. We find that the stress increases linearly with the strain (Fig. 9), and a linear fit to the data gives the elastic-constant Ka = 10 N m−2. This computed value agrees with previous experimental work on bilayer membranes.87,88
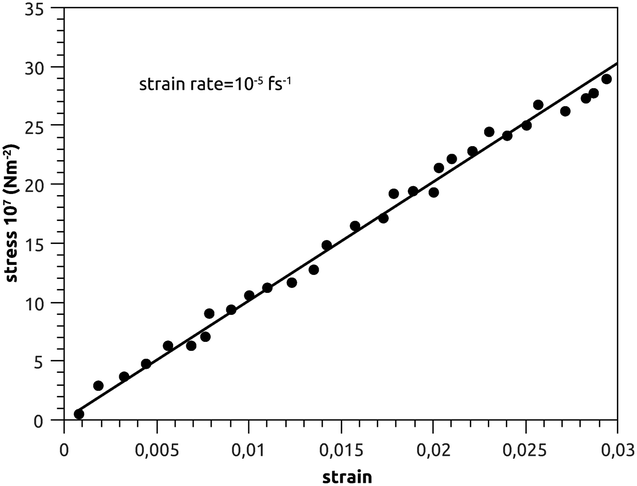 | ||
| Fig. 9 Stress–strain plot of pulmonary surfactant, with a strain-rate of 10−5 fs−1. | ||
In Fig. 9, we show the stress–strain plot of pulmonary surfactant, with a strain rate of 10−5 fs−1. During respiratory cycles, the elasticity-modulus describes qualitatively the effectiveness of pulmonary surfactant, that is to say, its ability to oppose the decrease of the volume of the pulmonary cavity. In fact, this decreases the work of the respiratory muscles and then prevents alveolar collapse. The presence of the lipids in the gel phase induces a phase separation, which is translated by the presence of the condensed domains. Pulmonary surfactant contains two phases (condensed and expanded) and has an elasticity-modulus between those of the condensed and expanded phases. Indeed, the presence of the lipids, which fluidify and thus reduce the elasticity-modulus of the pulmonary surfactant in the pulmonary alveoli compared to the DPPC monolayer, is a compromise between the rigidity necessary for good efficiency and the fluidity necessary for good adsorption at the air–liquid interface. These two conditions are a prerequisite for the proper functioning of pulmonary surfactant under certain dynamic conditions (respiratory cycles).
5 Conclusion
We have investigated several physical properties of a pulmonary surfactant system, within the framework of molecular dynamics simulations, based on the MARTINI coarse-grained model and an efficient equilibration algorithm. The transition of the studied system from a gel phase to a liquid phase occurs at a melting temperature of around 320 K. Pulmonary surfactant is found to be in a two-dimensional liquid state for temperatures close to the melting temperature, including physiological ones. On increasing the temperature, the bilayer membrane appears to go through a continuous ordered–disordered fluid phase transition. The phospholipid molecules exist in a condensed liquid phase characterized by the existence of short-range order. But, the integral proteins exhibit a congested structure, close to the solid state. The elasticity-modulus of pulmonary surfactant is found to be between those of the condensed and expanded phases. The lipids and proteins are subject to a subdiffusion phenomenon. In the long time expression of the mean-squared-displacement, a generalized-diffusion-coefficient and an anomalous exponent (power of time) appear. These two pertinent dynamical quantities are found to be slightly smaller compared to those calculated for pure lipid bilayers. All calculated physical properties are found to be in good agreement with the available experimental findings. Finally, we notice that the physical properties of pulmonary surfactant are found to be different to those of a pure lipid bilayer. But despite that, many previous studies considered pulmonary surfactant as a simple lipid bilayer, especially for studying its interaction with nanoparticles absorbed during the respiration process. And therefore, various environmental and medical subjects related to pulmonary surfactant could be re-investigated, taking into account its particularity.Conflicts of interest
There are no conflicts to declare.Acknowledgements
The authors would like to express their sincere gratitude to Professor Mabrouk Benhamou, from Moulay Ismail University, for his valuable contribution to the finalization of the manuscript.Notes and references
- K. Von Neergaard, Z. Gesamte Exp. Med., 1929, 66, 373–394 CrossRef.
- P. Gruenwald, Am. J. Obstet. Gynecol., 1947, 53, 996–1007 CrossRef CAS PubMed.
- J. A. Clements, Proc. Soc. Exp. Biol. Med., 1957, 95, 170–172 CrossRef CAS PubMed.
- M. Craig, F. Kevin and G. David, Pediatrics, 1958, 22, 847–856 Search PubMed.
- T. Fujiwara and F. H. Adams, Pediatrics, 1980, 66, 795–798 CAS.
- A. N. Hunt, F. J. Kelly and A. D. Postle, Early Hum. Dev., 1991, 25, 157–171 CrossRef CAS PubMed.
- V. P. Carnielli, L. J. Zimmermann, A. Hamvas and P. E. Cogo, J. Perinatol., 2009, 29, S29–S37 CrossRef CAS PubMed.
- H. P. Haagsman and R. V. Diemel, Comp. Biochem. Physiol., Part A: Mol. Integr. Physiol., 2001, 129, 91–108 CrossRef CAS.
- L. J. Zimmermann, D. J. Janssen, D. Tibboel, A. Hamvas and V. P. Carnielli, Biol. Neonate, 2005, 87, 296–307 CrossRef CAS PubMed.
- A. H. Jobe and M. Ikegami, Clin. Perinatol., 2001, 28, 655–669 CrossRef CAS PubMed.
- A. G. Serrano and J. Perez-Gil, Chem. Phys. Lipids, 2006, 141, 105–118 CrossRef CAS PubMed.
- H. L. Halliday, J. Perinat. Med., 1996, 24, 417–426 CrossRef CAS PubMed.
- E. L. Rodriguez and J. Pérez-Gil, Biochim. Biophys. Acta, Biomembr., 2014, 1838, 1568–1585 CrossRef PubMed.
- S. W. Glasser, M. S. Burhans, T. R. Korfhagen, C. L. Na, P. D. Sly, G. F. Ross, M. Ikegami and J. A. Whitsett, Proc. Natl. Acad. Sci. U. S. A., 2001, 98, 6366–6371 CrossRef CAS PubMed.
- S. W. Glasser, E. A. Detmer, M. Ikegami, C. L. Na, M. T. Stahlman and J. A. Whitsett, J. Biol. Chem., 2003, 278, 14291–14298 CrossRef CAS PubMed.
- A. von Nahmen, M. Schenk, M. Sieber and M. Amrein, Biophys. J., 1997, 72, 463–469 CrossRef CAS PubMed.
- L. Gómez-Gil, D. Schürch, E. Goormaghtigh and J. Pérez-Gil, Biophys. J., 2009, 97, 2736–2745 CrossRef PubMed.
- S. Malcharek, A. Hinz, L. Hilterhaus and H. J. Galla, Biophys. J., 2005, 88, 2638–2649 CrossRef CAS PubMed.
- L. Wang, P. Cai, H. J. Galla, H. He, C. R. Flach and R. Mendelsohn, Eur. Biophys. J., 2005, 34, 243–254 CrossRef CAS PubMed.
- S. Taneva and K. M. Keough, Biochemistry, 1997, 36, 912–922 CrossRef CAS PubMed.
- C. J. Ormond, Coping with the cold: Heterothermic mammals provide a new paradigm for surfactant composition and function, PhD thesis, University of Adelaide, Adelaide, Australia, 2004.
- S. Plimpton, LAMMPS-large-scale atomic/molecular massively parallel simulator, Sandia National Laboratories, 2007 Search PubMed.
- A. Stukowski, Modell. Simul. Mater. Sci. Eng., 2010, 18, 015012 CrossRef.
- A. Jewett, Moltemplate Manual, Jensen Lab (Caltech), Shea Lab (UCSB), 2016 Search PubMed.
- Z. J. Wang and D. Frenkel, J. Chem. Phys., 2005, 122, 234711–234719 CrossRef PubMed.
- J. A. Freites, Y. Choi and D. J. Tobias, Biophys. J., 2003, 84, 2169–2180 CrossRef CAS PubMed.
- S. Baoukina and D. P. Tieleman, Biochim. Biophys. Acta, 2016, 1858, 2431–2440 CrossRef CAS PubMed.
- Q. Hu, X. Bai, G. Hu and Y. Y. Zuo, ACS Nano, 2017, 11, 6832–6842 CrossRef CAS PubMed.
- K. Dutta, K. Nag, V. Booth, E. Smyth, H. Dueck, M. Fritzen-Garcia, C. Ghosh and A. K. Panda, J. Oleo Sci., 2018, 67, 1043–1057 CrossRef CAS PubMed.
- V. E. J. Aeldhuizen and H. P. Haagsman, Biochim. Biophys. Acta, Biomembr., 2000, 1467, 255–270 CrossRef.
- J. C. Watkins, Biochim. Biophys. Acta, Lipids Lipid Metab., 1968, 152, 293–306 CrossRef CAS.
- R. K. Harishchandra, S. Saleem and H. J. Galla, J. R. Soc., Interface, 2009, 7, S15–S26 Search PubMed.
- B. Pastrana-Rios, C. R. Flach, J. W. Brauner, A. J. Mautone and R. Mendelsohn, Biochemistry, 1994, 33, 5121–5127 CrossRef CAS PubMed.
- A. Akella and S. B. Deshpande, Indian J. Exp. Biol., 2013, 51, 5–22 CAS.
- J. Goerke, Biochim. Biophys. Acta, Mol. Basis Dis., 1998, 1408, 79–89 CrossRef CAS.
- R. Veldhuizen, K. Nag, S. Orgeig and F. Possmayer, Biochim. Biophys. Acta, Mol. Basis Dis., 1998, 1408, 90–108 CrossRef CAS.
- S. Han and R. K. Mallampalli, Ann. Am. Thorac. Soc., 2015, 12, 765–774 CrossRef PubMed.
- K. Kuronuma, H. Mitsuzawa, K. Takeda, C. Nishitani, E. D. Chan, Y. Kuroki, M. Nakamura and D. R. Voelker, J. Biol. Chem., 2009, 284, 25488–25500 CrossRef CAS PubMed.
- M. Andersson, T. Curstedt, H. Jörnvall and J. Johansson, FEBS Lett., 1995, 362, 328–332 CrossRef CAS.
- B. Pastrana-Rios, S. Taneva, K. M. Keough, A. J. Mautone and R. Mendelsohn, Biophys. J., 1995, 69, 2531–2540 CrossRef CAS.
- J. Johansson, T. Szyperski, T. Curstedt and K. Wuethrich, Biochemistry, 1994, 33, 6015–6023 CrossRef CAS PubMed.
- T. E. Weaver and J. A. Whitsett, Biochem. J., 1991, 273, 249–264 CrossRef CAS PubMed.
- S. J. Marrink, H. J. Risselada, Y. S. Mov, D. P. Tieleman and A. H. de Vries, J. Phys. Chem. B, 2007, 111, 7812–7824 CrossRef CAS PubMed.
- L. Monticelli, S. K. Kandasamy, X. Periole, R. G. Larson, D. P. Tieleman and S. J. Marrink, J. Chem. Theory Comput., 2008, 4, 819–834 CrossRef CAS PubMed.
- G. Bellesia, A. I. Jewett and J. E. Shea, Protein Sci., 2011, 20, 818–826 CrossRef CAS PubMed.
- M. Arienti, W. Pan, X. Li and G. Karniadakis, J. Chem. Phys., 2011, 134, 204114–204125 CrossRef PubMed.
- O. S. Ollila, H. J. Risselada, M. Louhivuori, E. Lindahl, I. Vattulainen and S. J. Marrink, Phys. Rev. Lett., 2009, 102, 078101 CrossRef PubMed.
- M. G. Wolf, M. Hoefling, C. Aponte-Santamaría, H. Grubmüller and G. Groenhof, J. Comput. Chem., 2010, 31, 2169–2174 CrossRef CAS PubMed.
- F. Brochard and J. F. Lennon, J. Phys., 1975, 36, 1035–1047 CrossRef.
- S. J. Marrink, J. Risselada and A. E. Mark, Chem. Phys. Lipids, 2005, 135, 223–244 CrossRef CAS PubMed.
- D. Marsh, CRC Handbook of Lipid Bilayers, CRC Press, Boca Raton, FL, 1990 Search PubMed.
- D. A. Brown and E. London, J. Biol. Chem., 2000, 275, 17221–17224 CrossRef CAS PubMed.
- W. Yan, S. C. Biswas, T. G. Laderas and S. B. Hall, J. Appl. Physiol., 2007, 102(5), 1739–1745 CrossRef CAS PubMed.
- M. Zhernenkov, D. Bolmatov, D. Soloviov, K. Zhernenkov, B. P. Toperverg, A. Cunsolo, A. Bosak and Y. Q. Cai, Nat. Commun., 2016, 7, 11575 CrossRef CAS PubMed.
- D. Constantin, B. Pansu, M. Impéror, P. Davidson and F. Ribot, Phys. Rev. Lett., 2008, 101, 098101–098105 CrossRef PubMed.
- L. Heontiadou, A. E. Mark and S. J. Marrink, Biophys. J., 2004, 86, 2156–2164 CrossRef.
- M. J. Saxton and K. Jacobson, Annu. Rev. Biophys. Biomol. Struct., 1997, 26, 373–399 CrossRef CAS PubMed.
- R. Simson, E. D. Sheets and K. Jacobson, Biophys. J., 1995, 69, 989–993 CrossRef CAS PubMed.
- A. Kusumi, C. Nakada, K. Ritchie, K. Murase, K. Suzuki, H. Murakoshi, R. S. Kasai, J. Kondo and T. Fujiwara, Annu. Rev. Biophys. Biomol. Struct., 2005, 34, 351–378 CrossRef CAS PubMed.
- P. Schwille, J. Korlach and W. W. Webb, Cytometry, 1999, 36, 176–182 CrossRef CAS PubMed.
- N. Kahya, D. Scherfeld, K. Bacia, B. Poolman and P. Schwille, J. Biol. Chem., 2003, 278, 28109–28115 CrossRef CAS PubMed.
- K. Bacia, D. Scherfeld, N. Kahya and P. Schwille, Biophys. J., 2004, 87, 1034–1043 CrossRef CAS PubMed.
- J. Yguerabide, J. A. Schmidt and E. E. Yguerabide, Biophys. J., 1982, 40, 69–75 CrossRef CAS PubMed.
- E. A. J. Reits and J. J. Neefjes, Nat. Cell Biol., 2001, 3, E145–E147 CrossRef CAS PubMed.
- M. Lemaalem, N. Hadrioui, A. Derouiche and H. Ridouane, RSC Adv., 2020, 10, 3745–3755 RSC.
- M. Badia, S. El-Moudny, M. Benhamou and M. El Ossmani, J. Mol. Liq., 2017, 240, 1–13 CrossRef CAS.
- R. Kubo, M. Toda and N. Hashitsume, Statistical Physics II: Nonequilibrium Statistical Mechanics, Springer Science Business Media, 2012 Search PubMed.
- S. Stachura, Processus de diffusion dans des membranes biologiques étudiés par simulation moléculaire et modèles analytiques, PhD thesis, Université Pierre et Marie Curie, Paris, France, 2014.
- J. P. Bouchaud and A. Georges, Phys. Rep., 1990, 195, 127–293 CrossRef.
- E. W. Montroll and G. H. Weiss, J. Math. Phys., 1965, 6, 167–181 CrossRef.
- R. Metzler, J. H. Jeon and A. G. Cherstvy, Biochim. Biophys. Acta, Biomembr., 2016, 1858, 2451–2467 CrossRef CAS PubMed.
- M. Javanainen, H. Hammaren, L. Monticelli, J.-H. Jeon, R. Metzler and I. Vattulainen, Faraday Discuss., 2013, 161, 397–417 RSC.
- E. Barkai, Y. Garini and R. Metzler, Phys. Today, 2012, 65(8), 29 CrossRef CAS.
- R. Metzler, J.-H. Jeon, A. G. Cherstvy and E. Barkai, Phys. Chem., 2014, 16, 24128 CAS.
- A. Godec and R. Metzler, Phys. Rev. E: Stat., Nonlinear, Soft Matter Phys., 2015, 92, 010701(R) CrossRef PubMed.
- M. Bauer and R. Metzler, PLoS One, 2013, 8, e53956 CrossRef CAS PubMed; O. Pulkkinen and R. Metzler, Phys. Rev. Lett., 2013, 110, 198101 CrossRef PubMed.
- M. Javanainen, et al., Langmuir, 2010, 26, 15436 CrossRef CAS PubMed.
- S. K. Ghosh, A. G. Cherstvy, D. S. Grebenkov and R. Metzler, New J. Phys., 2016, 18, 013027 CrossRef.
- H. G. Döbereiner, G. Gompper, C. K. Haluska, D. M. Kroll, P. G. Petrov and K. A. Riske, Phys. Rev. Lett., 2003, 91, 048301–048305 CrossRef PubMed.
- M. Frick, K. Schmidt and B. J. Nichols, Curr. Biol., 2007, 17, 462–467 CrossRef CAS PubMed.
- S. Ramadurai, A. Holt, V. Krasnikov, G. van den Bogaart, J. A. Killian and B. Poolman, J. Am. Chem. Soc., 2009, 131, 12650–12656 CrossRef CAS PubMed.
- D. F. Kusic, E. L. Elson and M. P. Sheetz, Biophys. J., 1999, 76, 314–322 CrossRef.
- P. B. Canham, J. Theor. Biol., 1970, 26, 61–76 CrossRef CAS.
- W. Helfrich, Z. Naturforsch., C: Biochem., Biophys., Biol., Virol., 1973, 28, 693–703 CAS.
- E. Evans, Biophys. J., 1974, 14, 923–931 CrossRef CAS PubMed.
- D. Needham and E. Evans, Biochemistry, 1988, 27, 8261–8269 CrossRef CAS PubMed.
- K. Olbrich, W. Rawicz, D. Needham and E. Evans, Biophys. J., 2000, 79, 321–327 CrossRef CAS PubMed.
- H. G. Döbereiner, G. Gompper, C. K. Haluska, D. M. Kroll, P. G. Petrov and K. A. Riske, Phys. Rev. Lett., 2003, 91, 048301–048305 CrossRef PubMed.
| This journal is © The Royal Society of Chemistry 2020 |