 Open Access Article
Creative Commons Attribution 3.0 Unported Licence
A nitronyl nitroxide and its two 1D chain Cu–Tb complexes: synthesis, structures, and magnetic properties†
Meng Yang *,
Xiaohong Liang,
Yandie Zhang,
Zhijian Ouyang and
Wen Dong*
Guangzhou Key Laboratory for Environmentally Functional Materials and Technology, School of Chemistry and Chemical Engineering, Guangzhou University, Guangzhou Higher Education Mega Center, 230 Wai Huan Xi Road, Guangzhou 510006, P. R. China. E-mail: yangmeng@gzhu.edu.cn; dw320@aliyun.com
First published on 27th February 2020
Abstract
A new nitronyl nitroxide, namely NIT-Ph-p-OCH2trz (1), and two types of one-chain Cu–Tb complexes, namely [TbCu(hfac)5NIT-Ph-p-OCH2trz·0.5C6H14]n (2a) and [LnCu(hfac)5NIT-Ph-p-OCH2trz]n (2b) (NIT-Ph-p-OCH2trz = 2-(4-((1H-1,2,4-triazol-1-yl)methoxy)phenyl)-4,4,5,5-tetramethylimidazoline-1-oxyl-3-oxide; hfac = hexafluoroacetylacetonate), have been successfully synthesized simultaneously through reacting nitronyl nitroxide radical NIT-Ph-p-OCH2trz with Cu(hfac)2 and Ln(hfac)3, and the molecular structures have been elucidated via single-crystal X-ray structural analysis. 2a features a ‘ladder-like’ chain structure, while 2b displays a linear chain structure built up by Ln(hfac)3 units bridged with the NO groups of radical ligands. The additional Cu(II) ions are coordinated to the nitrogen atoms of the triazole units. Nonzero out-of-phase signals are observed for the Tb derivatives (2a and 2b) and they exhibit frequency-dependent out-of-phase signals indicating a single-chain magnet behavior.
Introduction
Paramagnetic nitronyl nitroxide radicals (NITRs) are promising building blocks for the synthesis of novel heterospin molecular magnetic materials.1,2 First, the NO groups of the nitronyl nitroxides coordinate directly to metal ions, resulting in a strong magnetic coupling that reduces the quantum tunneling of the magnetization (QTM).3–5 Second, nitronyl nitroxide radicals are stable in air and are easily modified with functional groups to enhance the chemical properties of the material. A number of metal complexes based on nitronyl nitroxides, including 2p–3d, 2p–4f heterobispin and 2p–3d–4f heterotrispin complexes, have been synthesized in recent years.6–8 Moreover, metal-radical complexes are good derivatives for studying magneto-structural correlation, which not only is important to understand the magnetic exchange interactions between the metal and the radical, but also for the design of novel nitronyl nitroxide radical ligands for the development of new molecular magnetic materials. To design more complexes with topological structures, special attention has been paid to functionalized radicals. Nitronyl nitroxide radicals that contain a triazole ring are good derivatives because these free radicals can bond to the metal ions via the triazole nitrogen atoms and the radical oxygen atoms, allowing for the formation of polynuclear clusters.9,10 Herein, a functional NITR containing triazole ring named NIT-Ph-p-OCH2trz (NIT-Ph-p-OCH2trz = 2-(4-((1H-1,2,4-triazol-1-yl)methoxy)phenyl)-4,4,5,5-tetramethylimidazoline-1-oxyl-3-oxide, Scheme 1) was synthesized. Using this radical, two types of one-chain 2p–3d–4f complexes, namely [TbCu(hfac)5NIT-Ph-p-OCH2trz·0.5C6H14]n and [LnCu(hfac)5NIT-Ph-p-OCH2trz]n, were obtained. Complex 2a exhibits a ladder-type chain structure, while complex 2b features a 1D Ln chain bridged by the NO moieties of the radical ligands. Both 2a and 2b show frequency-dependent out-of-phase signals in a zero field with an oscillation of 3 Oe, indicating single-chain magnet behaviors.Experimental section
Materials and physical measurements
All reagents were purchased from commercial sources and used without further purification. Elemental analysis for C, H, and N was performed using a PerkinElmer elemental analyzer model 240. Powder X-ray diffraction (PXRD) data for all seven complexes were collected at room temperature on a Rigaku Ultima IV diffractometer using graphite monochromated Cu-Kα radiation. Magnetic measurements were measured on a SQUID VSM and PPMS-9 magnetometer. The magnetic susceptibilities were corrected for the diamagnetic contribution of the constituent atoms using Pascal's constants.Synthesis
Results and discussion
Crystal structures
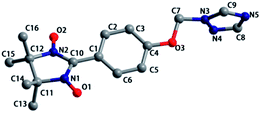
Compound 1 crystallized in the orthorhombic space group Pbca. The molecular structure is shown in Fig. 1, and the summary of the detailed crystallographic data and structure refinement are given in Table 1. Selected bond lengths and angles are given in Table S1.† The bond lengths of O–N are 1.275(3) and 1.290(2) Å, and the corresponding N–O distances in the nitroxides range from 1.25 to 1.32 Å. The dihedral angle between the benzene ring and the NO–C–NO group is 21.786(72)°, while the dihedral angle between the benzene ring and the triazole ring is 88.420(67)°. As shown in Fig. S1,† a 1-D chain structure with ‘head-to-head’ and ‘tail-to-tail’ is formed by hydrogen bonding, and the distances of C⋯O are 3.566 and 3.662 Å. The compound packing along the b-axis displays a wavelike form.| R1 = Σ(||Fo| − |Fc||)/Σ|Fo|. wR2 = [Σw(|Fo|2 − |Fc|2)2/Σw(|Fo|2)2]1/2. | |||
|---|---|---|---|
| Complex | 1 | 2a | 2b |
| Formula | C16H20N5O3 | C44H32CuF30N5O13Tb | C123H72Cu3F90N15O39Tb3 |
| Formula weight | 330.37 | 1631.23 | 4761.40 |
| T (K) | 113(2) | 113(2) | 113(2) |
| Crystal system | Orthorhombic | Triclinic | Monoclinic |
| Space group | Pbca | P![[1 with combining macron]](https://www.rsc.org/images/entities/char_0031_0304.gif) |
P21/c |
| a (Å) | 9.2257(18) | 12.654(3) | 18.785(3) |
| b (Å) | 16.713(3) | 13.533(3) | 17.138(3) |
| c (Å) | 21.020(6) | 18.382(4) | 52.309(10) |
| α (deg) | 90 | 83.29(3) | 90 |
| β (deg) | 90 | 87.52(3) | 96.852(4) |
| γ (deg) | 90 | 71.40(3) | 90 |
| θ/(deg) | 1.94–27.92 | 1.60–27.99 | 3.0–27.5 |
| V (Å3) | 3241(11) | 2962.9(13) | 16![[thin space (1/6-em)]](https://www.rsc.org/images/entities/char_2009.gif) 720(5) 720(5) |
| Z | 8 | 2 | 4 |
| Dc (g cm−3) | 1.354 | 1.828 | 1.891 |
| μ (mm−1) | 0.097 | 1.699 | 1.804 |
| Unique reflns, Rint | 3880 | 10![[thin space (1/6-em)]](https://www.rsc.org/images/entities/char_2009.gif) 301 301 |
36![[thin space (1/6-em)]](https://www.rsc.org/images/entities/char_2009.gif) 573 573 |
| 0.0789 | 0.0318 | 0.1375 | |
| GOF | 1.010 | 1.002 | 1.053 |
| R1 | 0.0696 | 0.0508 | 0.0686 |
| wR2 (I > 2σ(I)) | 0.1615 | 0.1360 | 0.1577 |
| R1 | 0.1059 | 0.0595 | 0.1084 |
| wR2 (all data) | 0.1875 | 0.1460 | 0.1857 |
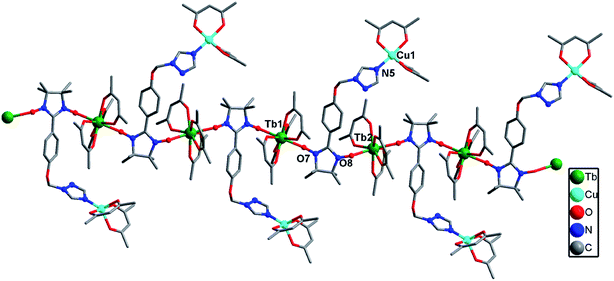
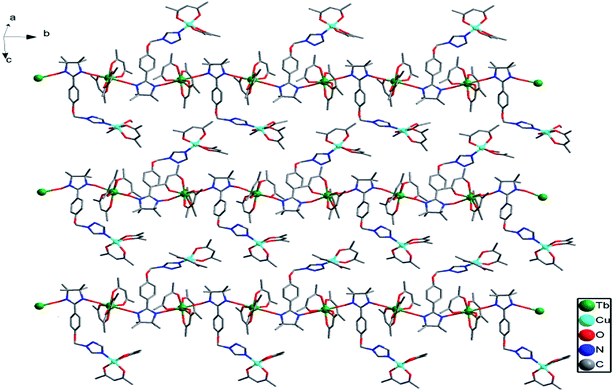
Complex 2a crystallized in the triclinic P![[1 with combining macron]](https://www.rsc.org/images/entities/char_0031_0304.gif) group space. As shown in Fig. 2, each Tb(III) ion is coordinated to one N atom from the triazole ring of the ligand, six O atoms from the three hfac ligands and one O atom from the NO group of the nitronyl nitroxide radical, resulting in a distorted square-antiprismatic geometry (D4d; Table S3†). The data was analyzed using the SHAPE software.13 The Tb–O(radical) and Tb–N distances are 2.346(5) and 2.578(6) Å, respectively, while the Tb–O(hfac) distances range from 2.327(4) to 2.363(3) Å. The Cu(II) ion is in a {NO5} coordinate environment in which the axial positions are occupied by one O atom (O1) from the NO group and one N atom from the triazole ring of another molecule. The Cu–O and Cu–N bond distances are 2.408(5) and 2.467(6) Å in the axis positions, while the Cu–O bond lengths range from 1.941(6) to 1.953(5) Å. The paramagnetic organic ligand is linked to two Tb(III) and two Cu(II) ions via its two NO groups and two N atoms of the triazole ring in a tetradentate μ4-η1:η1:η1:η1 mode, resulting in a ladder-like arrangement in which the anisole moieties form the rungs of the ladder. The Tb⋯Cu separations through the NIT motif and triazole ring are 8.50 and 6.93 Å, respectively. The Tb⋯Tb and Cu⋯Cu distances across the rungs are 8.67 and 11.09 Å, respectively (Fig. 3).
group space. As shown in Fig. 2, each Tb(III) ion is coordinated to one N atom from the triazole ring of the ligand, six O atoms from the three hfac ligands and one O atom from the NO group of the nitronyl nitroxide radical, resulting in a distorted square-antiprismatic geometry (D4d; Table S3†). The data was analyzed using the SHAPE software.13 The Tb–O(radical) and Tb–N distances are 2.346(5) and 2.578(6) Å, respectively, while the Tb–O(hfac) distances range from 2.327(4) to 2.363(3) Å. The Cu(II) ion is in a {NO5} coordinate environment in which the axial positions are occupied by one O atom (O1) from the NO group and one N atom from the triazole ring of another molecule. The Cu–O and Cu–N bond distances are 2.408(5) and 2.467(6) Å in the axis positions, while the Cu–O bond lengths range from 1.941(6) to 1.953(5) Å. The paramagnetic organic ligand is linked to two Tb(III) and two Cu(II) ions via its two NO groups and two N atoms of the triazole ring in a tetradentate μ4-η1:η1:η1:η1 mode, resulting in a ladder-like arrangement in which the anisole moieties form the rungs of the ladder. The Tb⋯Cu separations through the NIT motif and triazole ring are 8.50 and 6.93 Å, respectively. The Tb⋯Tb and Cu⋯Cu distances across the rungs are 8.67 and 11.09 Å, respectively (Fig. 3).
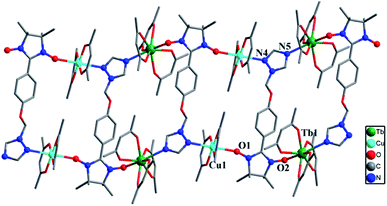 | ||
| Fig. 2 Molecular structure of complex 2a (hydrogen and fluorine atoms are not shown for the sake of clarity). | ||
Complex 2b was solved in the monoclinic system with the space group P21/c and the asymmetric unit contains one [TbCu(hfac)5(NIT-Ph-p-OCH2trz)]2 and a [TbCu(hfac)5 (NIT-Ph-p-OCH2trz)] unit, which results in two crystallographically independent 1D chains in the crystal lattice. Compared to complex 2a, the linear chain in 2b is constructed from the radical ligand and Tb(III) spin carriers, and the Cu(II) ions are located on the side-chain. In complex 2b, each radical behaves as a tridentate ligand and binds two ions and one Cu(II) ion in the μ3-η1:η1:η1 mode. The NO groups of the NIT-Ph-p-OCH2trz radical bridges two Tb(hfac)3 units to construct a 1D chain. Each Tb(III) ion is coordinated to two O atoms from two radical ligands and six O atoms from three hfac ligands (Fig. 4). Shape analysis indicated that all of the Tb(III) ions are located in distorted square-antiprismatic geometries (D4d; Table S3†). The Tb–O(hfac) bond lengths are in the same range as those of 2b (Table S5†). The Cu(II) ions in 2b are all five-coordinated (Fig. S3†). The Cu1 and Cu3 atoms are both in the distorted square-pyramidal geometry (Table S4†). The equatorial planes are occupied by three O atoms from hfac ligands and one N atom from the triazole unit, while one O atom from the hfac ligand occupies the apical site. The Cu–N bond distances are 1.979(7) Å for Cu1 and 1.968(7) Å for Cu3. The Cu–O bonds in the equatorial plane range from 1.911(6) to 1.957(6) Å for Cu1 and Cu3, while the apical Cu–O bond distances are 2.158(9) and 2.167(10) Å for Cu1 and Cu3, respectively. The Cu2 atom is located in a trigonal bipyramidal environment (Table S4†). Its equatorial plane is formed by two O atoms (O23 and O25) from two hfac ligands and one N atom (N10) from the triazole unit; the apical positions are occupied by two hfac O atoms (O24 and O26). The axial Cu–O distances are 2.158(9) and 1.908(7) Å. The packing of the chains in complex 2b is shown in Fig. 5. The shortest intrachain Tb⋯Tb distance bridged by two NO groups is 8.57 Å, while the nearest interchain Tb⋯Tb, Cu⋯Tb, and Cu⋯Cu separations were found to be 10.05, 9.24, and 9.34 Å, respectively.
Magnetic properties
The magnetic susceptibilities of complexes 2 were measured on polycrystalline samples. The phase purity of the samples was verified by comparing experimental and simulated PXRD pattern XRD analyses (Fig. S4†). The variable temperature magnetic susceptibility data for compounds 1 and 2 were measured in the 2–300 K range. As shown in Fig. 6, the χmT product of 1 at 300 K is 0.366 cm3 K mol−1, which is a little lower than the theoretical value of 0.375 cm3 K mol−1 for an isolated S = 1/2. With decreasing temperature, the χmT value gradually decreases to a minimum value of 0.141 cm3 K mol−1 at 2 K. The 1/χm versus T curve in the 2–300 K range follows the Curie–Weiss law with a Curie constant of C = 0.365 cm3 K mol−1 and a Weiss constant of θ = −0.72 K, which indicate that there is weak antiferromagnetic coupling between the NIT-Ph-p-OCH2trz radicals arising from two types of hydrogen bonding (3.566 and 3.6628 Å) between the radical ligands. According to the structure, the magnetic behavior of compound 1 can be treated as alternating 1D chains with S = 1/2. The magnetic data was analyzed using a theoretical expression1 deduced from the spin Hamiltonian Ĥ = −[J(Ŝ1 + Ŝ2) + αJ(Ŝ2 + Ŝ3)]. The experimental data was a good fit with J = −2.71 cm−1, g = 1.99, and α = 0.36. The negative value of J confirms the antiferromagnetic activity of the ligands.
 | (1) |
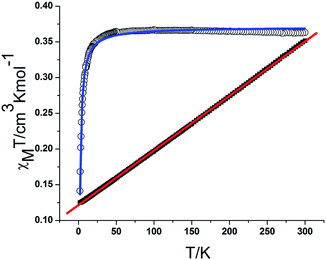 | ||
| Fig. 6 Plot of χmT and χm−1 versus T for 1. The blue and red solid lines represent the fit of the experimental data to eqn (1) in the text and the Curie–Weiss law, respectively. | ||
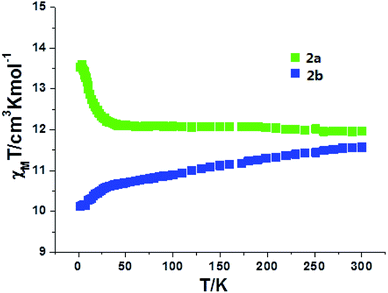
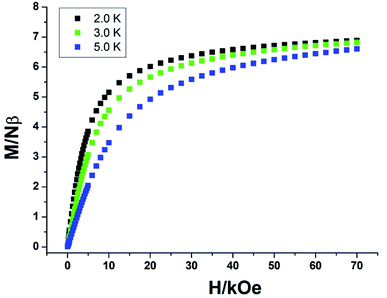
For complexes 2a and 2b, as shown in Fig. 7, the χmT values are 12.10 and 11.58 cm3 K mol−1 at room temperature, slightly lower than the expected value of 12.57 cm3 K mol−1 for one uncorrelated Tb(III) ion (7F6, S = 3, L = 3, and g = 3/2) plus one isolated Cu(II) ion (S = 1/2, g = 2.0) and one radical (S = 1/2, g = 2.0). For 2a, the χmT value is constant from 300 K to 25 K, then the value sharply increases to a maximum of 13.60 cm3 K mol−1 at 4 K. The value decreases to 13.52 cm3 K mol−1 at 2 K. The increase in the χmT value at low temperatures confirms the ferromagnetic interactions between the Tb(III) ions and the coordinated NO groups of the organic radicals, while the decrease in the χmT value is attributed to the crystal field effects of the Tb(III) ion. For 2b, the value of χmT decreases slowly to a value of 10.52 cm3 K mol−1 at 25 K, and then steeply decreases to 9.94 cm3 K mol−1 at 2 K. This can be ascribed to the stronger crystal field effect of the Tb ion, which overwhelms the ferromagnetic radical-Tb contributions on the χmT curve.14 Both complexes 2a and 2b show linear regions ranging from 9 K to 26 K and 4 K to 9 K, and the values of Δξ are 1.04 K and 0.22 K, confirming the 1D Ising-like character of these complexes (Fig. S5†). The M versus H curves of 2a and 2b at 2.0, 3.0, and 5.0 K show that the values of the magnetization increase with the applied dc field and do not reach saturation (Fig. 8 and S6†). The observation suggests that there exists significant magnetic anisotropy in 2a and 2b.
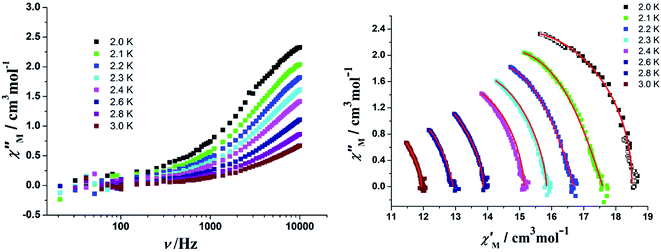
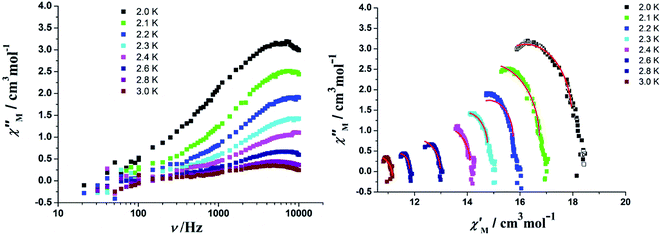
In order to assess the relaxation dynamics of 2a and 2b, ac magnetic susceptibility measurements were performed with and without a static magnetic field. For complexes 2a and 2b, the frequency dependence of the out-of phase  signals are observed under zero dc fields, revealing slow relaxation of its magnetization (Fig. 9 and 10). However, no peak maxima are observed for
  above 2 K. The anisotropic energy barrier and τ0 values can be obtained from the fits of the ac susceptibility data using the equation ln(χ′′/χ′) = ln(ωτ0) + Δeff/kBT.15 The best fit produced τ0 ≈ 1.90 × 10⁻⁵ s and Δeff/kB ≈ 5.93 K for 2a and τ0 ≈ 6.38 × 10⁻⁶ s and Δeff/kB ≈ 3.84 K for 2b (Fig. S9†). A static magnetic field of 2 kOe was applied to suppress the quantum tunneling process and the in-phase and out-phase susceptibility curves displayed obvious peaks for 2a. Unfortunately, there was no peak for complex 2b.
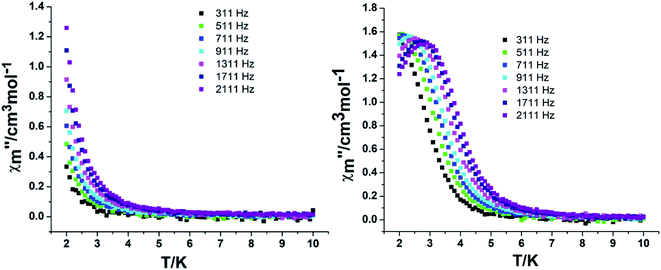 | ||
| Fig. 9 Temperature dependence of the out-phase in a zero (left) and 2 kOe field (right) for complex 2a. | ||
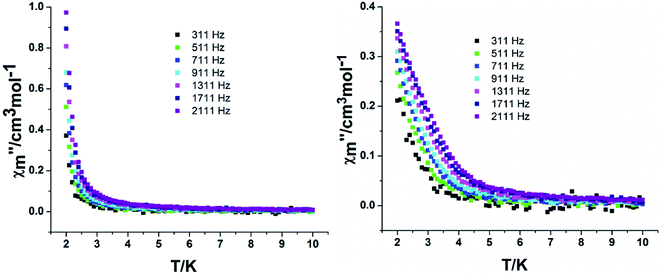 | ||
| Fig. 10 Temperature dependence of the out-phase in a zero (left) and 2 kOe field (right) for complex 2b. | ||
In order to perform an in-depth study on the relaxation dynamics of 2a and 2b, the frequency dependence of the χ′ and χ′′ signals were also examined in a frequency range of 10–10![[thin space (1/6-em)]](https://www.rsc.org/images/entities/char_2009.gif) 000 Hz without applying a dc field. For complexes 2a and 2b, both the χ′ and χ′′ components of the alternating-current (ac) susceptibility feature strong frequency-dependent phenomena (Fig. 11, 12, and S10†). The Cole–Cole plots are shown in Fig. 11 and 12, and they were analyzed using the generalized Debye model.16 The obtained α values vary from 0.04 to 0.24 for 2a and 0.14 to 0.68 for 2b, indicating a rather broad distribution of relaxation times.
000 Hz without applying a dc field. For complexes 2a and 2b, both the χ′ and χ′′ components of the alternating-current (ac) susceptibility feature strong frequency-dependent phenomena (Fig. 11, 12, and S10†). The Cole–Cole plots are shown in Fig. 11 and 12, and they were analyzed using the generalized Debye model.16 The obtained α values vary from 0.04 to 0.24 for 2a and 0.14 to 0.68 for 2b, indicating a rather broad distribution of relaxation times.
Conclusions
A new functional nitronyl nitroxide, namely NIT-Ph-p-OCH2trz (1), and its Tb complexes (2) were successfully obtained. Complexes 2a and 2b displayed two different 1D chains. In particular, 2a showed a rare ladder-like arrangement of alternating 2p–3d–4f spins with exchange interactions propagating along the rails. Both 2a and 2b exhibit a slow magnetic relaxation behavior below 3.0 K. This study illustrates that functionalized nitronyl nitroxide radicals are promising building blocks for synthesizing 2p–3d–4f heterotrispin systems.Conflicts of interest
There are no conflicts to declare.Acknowledgements
This work was supported by the National Natural Science Foundation of China (No. 21271052) and Science and Technology Program Foundation of Guangdong Province (No. 2015A030313502).References
- V. I. Ovcharenko and R. Z. Sagdeev, Russ. Chem. Rev., 1999, 68, 345–363 CrossRef CAS.
- C. Benelli and D. Gatteschi, Chem. Rev., 2002, 102, 2369–2388 CrossRef CAS PubMed.
- M. L. Kahn, J. P. Sutter, S. Golhen, P. Guionneau, L. Ouahab, O. Kahn and D. Chasseau, J. Am. Chem. Soc., 2000, 122, 3413–3421 CrossRef CAS.
- M. T. Lemaire, Pure Appl. Chem., 2004, 76, 277–293 CAS.
- D. Luneau and P. Rey, Coord. Chem. Rev., 2005, 249, 2591–2611 CrossRef CAS.
- (a) A. Caneschi, D. Gatteschi and N. C. Lalioti, Angew. Chem., Int. Ed., 2001, 40, 1760–1763 CrossRef CAS; (b) J. Sun, L. Xi, J. Xie, K. Wang, L. C. Li and J. P. Sutter, Dalton Trans., 2018, 47, 14630–14635 RSC.
- (a) N. Zhou, Y. Ma, C. Wang, G. F. Xu, J. K. Tang, J. X. Xu, S. P. Yan, P. Cheng, L. C. Li and D. Z. Liao, Dalton Trans., 2009, 8489–8492 RSC; (b) J. Wang, H. Miao, Z. X. Xiao, Y. Zhou, L. D. Deng, Y. Q. Zhang and X. Y. Wang, Dalton Trans., 2017, 31, 10452–10461 RSC; (c) K. Bernot, L. Bogani, A. Caneschi, D. Gatteschi and R. Sessoli, J. Am. Chem. Soc., 2016, 128, 7947–7956 CrossRef; (d) H. D. Li, J. Sun, M. Yang, Z. Sun, J. Xie, Y. Ma and L. C. Li, New J. Chem., 2017, 41, 10181–10188 RSC; (e) J. Sun, M. Yang, L. Xi, Y. Ma and L. C. Li, Dalton Trans., 2018, 47, 8142–8148 RSC.
- (a) X. F. Wang, P. Hu, Y. G. Li and L. C. Li, Chem.–Asian J., 2015, 2, 325–328 CrossRef PubMed; (b) X. F. Wang, P. Hu, L. C. Li and J. P. Sutter, Inorg. Chem., 2015, 54, 9664–9669 CrossRef CAS PubMed; (c) M. Zhu, Y. G. Li, Y. Ma, L. C. Li and D. Z. Liao, Inorg. Chem., 2013, 52, 12326–12328 CrossRef CAS; (d) M. Yang, J. Sun, J. N. Guo, G. F. Sun and L. C. Li, CrystEngComm, 2016, 18, 9345–9356 RSC; (e) M. Zhu, J. J. Wang, M. Yang, Y. Ma and L. C. Li, Dalton Trans., 2015, 44, 9815–9822 RSC; (f) G. F. Sun, J. N. Guo, M. Yang, L. Xi, L. C. Li and J. P. Sutter, Dalton Trans., 2018, 47, 4672–4677 RSC; (g) M. Zhu, L. C. Li and J. P. Sutter, Inorg. Chem. Front., 2016, 3, 994–1003 RSC; (h) A. A. Patrascu, S. Calancea, M. Briganti, S. Soriano, A. M. Madalan, R. A. A. Cassaro, A. Caneschi, F. Totti, M. G. F. Vaz and M. Andruh, Chem. Commun., 2017, 53, 6504–6507 RSC; (i) A. A. Patrascu, M. Briganti, S. Soriano, S. Calancea, R. A. A. Cassaro, F. Totti, M. G. F. Vaz and M. Andruh, Inorg. Chem., 2019, 58, 13090–13101 CrossRef CAS PubMed.
- T. Li, X. J. Shi, P. Y. Chen, S. J. Yu and L. Tian, Inorg. Chim. Acta, 2017, 461, 206–212 CrossRef CAS.
- J. Y. Shi, M. Z. Wu, P. Y. Chen, T. Li, L. Tian and Y. Q. Zhang, Inorg. Chem., 2019, 58, 14285–14288 CrossRef CAS PubMed.
- (a) E. F. Ullman, J. H. Osiecki, D. Boocock and R. Darcy, J. Am. Chem. Soc., 1972, 94, 7049–7059 CrossRef CAS; (b) I. N. Nnamania, G. S. Joshib, R. Danso-Danquahb, O. Abdulmalik, T. Asakura, D. J. Abraham and M. K. Safo, Chem. Biodiversity, 2008, 5, 1762–1769 CrossRef.
- (a) G. M. Sheldrick, SHELXS-2014, Program for structure solution, Universität of Göttingen, Germany, 2014 Search PubMed; (b) G. M. Sheldrick, SHELXL-2014, Program for structure refinement, Universität of Göttingen, Göttingen, Germany, 2014 Search PubMed.
- (a) D. Casanova, M. Llunell, P. Alemany and S. Alvarez, Chem.–Eur. J., 2005, 11, 1479–1494 CrossRef CAS; (b) M. Llunell, D. Casanova, J. Cirera, P. Alemany and S. Alvarez, Shape 2.0, Program for the Stereochemical Analysis of Molecular Fragments by Means of Continuous Shape Measures and Associated Tools, 2010 Search PubMed.
- J. P. Sutter, M. L. Kahn and O. Kahn, Adv. Mater., 1999, 11, 863–865 CrossRef CAS.
- (a) F. Luis, J. Bartolomé, J. F. Fernández, J. Tejada, J. M. Hernández, X. X. Zhang and R. Ziolo, Phys. Rev. B: Solid State, 1997, 55, 11448–11456 CrossRef CAS; (b) J. Bartolomé, G. Filoti, V. Kuncser, G. Schinteie, V. Mereacre, C. E. Anson, A. K. Powell, D. Prodius and C. Turta, Phys. Rev. B: Condens. Matter Mater. Phys., 2009, 80, 014430 CrossRef.
- K. S. Cole and R. H. J. Cole, Chem. Phys., 1941, 9, 341–351 CAS.
Footnote |
| † Electronic supplementary information (ESI) available. CCDC 1973720–1973722. For ESI and crystallographic data in CIF or other electronic format see DOI: 10.1039/d0ra00018c |
| This journal is © The Royal Society of Chemistry 2020 |


