
 Open Access Article
 This Open Access Article is licensed under a Creative Commons Attribution-Non Commercial 3.0 Unported Licence
Atomistic structure generation of covalent triazine-based polymers by molecular simulation†
Ce Songac,
Fangyuan Hu *b,
Zhaoliang Menga,
Shengming Lid,
Wenlong Shaoc,
Tianpeng Zhangb,
Siyang Liub and
Xigao Jian*abc
*b,
Zhaoliang Menga,
Shengming Lid,
Wenlong Shaoc,
Tianpeng Zhangb,
Siyang Liub and
Xigao Jian*abc
aSchool of Mathematical Sciences, Dalian University of Technology, Dalian 116024, China. E-mail: jian4616@dlut.edu.cn
bSchool of Materials Science and Engineering, State Key Laboratory of Fine Chemicals, Dalian University of Technology, Dalian 116024, China. E-mail: hufangyuan@dlut.edu.cn
cState Key Laboratory of Fine Chemicals, Liaoning Province Engineering Research Centre of High Performance Resins, Dalian University of Technology, Dalian 116024, China
dSchool of Innovation and Entrepreneurship, Dalian University of Technology, Dalian 116024, China
First published on 27th January 2020
Abstract
The structures of amorphous materials are generally difficult to characterize and comprehend due to their unordered nature and indirect measurement techniques. However, molecular simulation has been considered as an alternative method that can provide molecular-level information supplementary to experimental techniques. In this work, a new approach for modelling the atomistic structures of amorphous covalent triazine-based polymers is proposed and employed on two experimentally synthesized covalent triazine-based polymers. To examine the proposed modelling approach, the properties of the established models, such as surface areas, pore volumes, structure factors and N2 adsorption isotherms, were calculated and compared with the experimental data. Excellent consistencies were observed between the simulated models and experimental samples, consequently validating the proposed models and the modelling approach. Moreover, the proposed modelling approach can be applied to new covalent triazine-based polymers for predictive purposes and to provide design strategies for future synthesis works.
Introduction
Porous organic materials have been regarded as promising candidates for gas storage and separation, catalysis, energy storage and other extensive applications, due to their large specific surface areas, tuneable pore architectures, and favourable thermal stability.1–3 The tremendous application demands prompt numerous developments of various porous organic materials, including covalent organic frameworks (COFs)4 with well-defined crystalline structures and amorphous porous organic polymers (POPs), such as hyper-crosslinked polymers (HCPs),5 polymers of intrinsic microporosity (PIMs),6 porous aromatic frameworks (PAFs)7 and conjugated microporous polymers (CMPs).8 Covalent triazine-based frameworks (CTFs) are a distinctive and emerging class of POPs with sustained porosity and high thermal and chemical stabilities; they are developed through the cyclotrimerization reaction of nitrile compounds along with s-triazine rings formed.9 The first crystalline CTF, namely CTF-1, was prepared from ionothermal trimerization of 1,4-dicyanobenzene (DCB) in molten ZnCl2 under 400 °C with the BET surface area of 791 m2 g−1.10 Modifying the monomer/ZnCl2 ratio, high reaction temperatures, varying reaction times and different monomer structures can alter the experimental BET surface areas, however, the obtained triazine-based polymers exhibit amorphous nature.10–13 In addition, an alternative synthesis scheme using trifluoromethanesulfonic acid (TFMS) as the catalyst under room temperature or microwave-assisted heating conditions can produce amorphous triazine-based polymers.14 Most reported CTF-type materials are manifested to be amorphous.15Crystalline frameworks possessing long-range ordered pore structures can be precisely characterized by experimental techniques, such as X-ray diffraction (XRD). However, the characterizations of amorphous networks are comparatively indirect. In particular, the porosity of porous materials is generally depicted by the specific surface area and the pore volume evaluated from gas sorption isotherm on the basis of several theories, such as BET theory.16 These theories provide many assumptions, which would inevitably reduce the certainty for the amorphous and porous structure. Hence, the porosities of amorphous materials are difficult to understand due to the scarcity of detailed and direct descriptions from experimental measurements. However, molecular simulations can impart useful and essential structural information to supplement the experimental techniques and consequently improve the comprehension of the structures and properties of amorphous materials. Moreover, the valid representative models obtained from simulations may rationalize the structure–property relationships despite the complex amorphous nature and ideally achieve the purposeful structural design for new materials owing to the predictive power of the simulated models.
Recently, great efforts have been made on modelling amorphous materials. For instance, Colina et al. developed the Polymatic code as a “mimetic” approach17,18 to construct the atomistic structures following the synthesis process. The approach has been successfully implemented for a broad class of amorphous polymers such as HCPs,19,20 CMPs,21 and PIMs.22,23 Another automated computational code for network generations called AMBUILD was proposed by Abbie et al. and applied for model constructions of the PAF-1 framework,24,25 aza-CMP26 and other amorphous polymer networks.27 However, the simulation research on the structures of CTF-type materials is rare,28 especially for amorphous ones.
In the present study, a new modelling approach for the atomistic structure generation of CTF-type polymers is presented and used on two CTF-type multiheteroatom porous carbon frameworks (MPCFs),12 namely MPCF-1 and MPCF-2, which were synthesized by ionothermal trimerization of 4,4′-(1,3,5,7-tetraoxo-5,7-dihydropyrrolo[3,4-f]isoindole-2,6(1H,3H)-diyl)dibenzonitrile (TDDN) and 4,4′-(4-oxophthalazine-1,3(4H)-diyl)dibenzonitrile (OPDN) (Fig. 1), respectively. Subsequently, the proposed atomistic models were examined comparing the calculated structural properties of the models with the accessible experimental data. The consistency between the structural properties of the experimental samples and the simulated models demonstrated the validity of the proposed modelling algorithm.
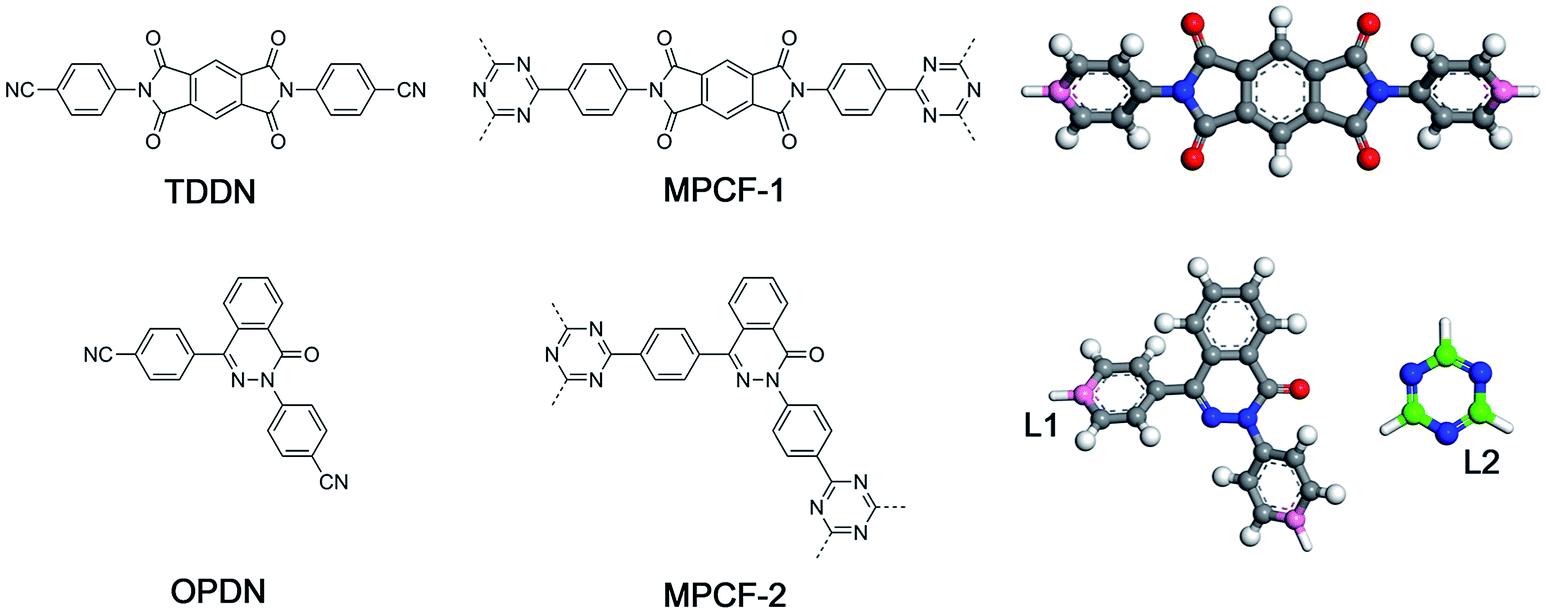 | ||
| Fig. 1 Chemical structures of monomers (left), CTF-type polymers (middle), and the building unit structures for the proposed modelling approach (right). | ||
Simulation method
Generally, the modelling algorithm for CTF-type polymers presented in this work treats the monomers and triazine rings produced from the nitrile trimerization as two groups of building units with linking sites. These building units of the stoichiometric quantities are randomly packed into the simulation box. Subsequently, the simulation box is submitted to the linking cycles, among which the potential bonds are added, accompanied by the geometry optimization and molecular dynamics (MD) simulations for structure relaxation and optimization. After the accomplishment of the linking cycles, further modifications and relaxations for the systems are conducted to obtain more realistic models. This modelling algorithm attempts to obtain the amorphous model in a simplified manner by adding a single bond during each linking step. Moreover, many aspects of the CTF network formation mechanism are unclear. For example, synthetic schemes that apply different catalysts under various conditions can substantially alter the network structures albeit with the same monomer (i.e., the BET surface areas of CTF-1 originating from ionothermal trimerization of DCB in molten ZnCl2 (catalyst) under 400 °C and TFMS catalyzed at room temperature are 791 and 2 m2 g−1, respectively).10,14 An increase in the pore volume and mesoporosity was detected with raising the reaction temperature of the ionothermal synthesis,11 which can be roughly ascribed to the probable side reactions and carbonization effects at relatively high temperatures.29 However, it is difficult to take these aforementioned factors into consideration during the simulation of the CTF networks. Hence, for simplicity, the CTF networks derived from ionothermal reactions at relatively low temperature are primarily concerned in this work, and the complicated side reactions and carbonization effects are not taken into account.The starting configuration for the linking cycles is obtained by randomly packing the building units into a cubic simulation box at a density of 0.4 g cm−3 with periodic boundary conditions. Note that the low initial density has been considered to be favourable for the pore formation.30 Moreover, five independent initial configurations are established for each CTF-type polymer in this work. The chemical structures of the CTF polymers MPCF-1 and MPCF-2 and their corresponding building units are shown in Fig. 1. The building units are defined according to the resulting networks and monomer structures. Specifically, the carbon atoms bonded to the cyano groups in the monomers are assigned as linking atom L1 (coloured pink in Fig. 1), and the cyano groups are replaced by hydrogen atoms for defining the building units. And the carbon atoms in the triazine rings are designated as the linking atom L2 (coloured green in Fig. 1) and bonded with H atoms, allowing for electroneutrality.
After the initial simulation box is established, the linking cycles start to seek and bond the pairs of linking atoms L1 and L2, thereby satisfying a set of bonding criteria to generate the amorphous networks. The elaborated bonding criteria are used to prevent the generation of unreasonable or unrealistic structures upon the addition of bonds, which cannot be fully relaxed and optimized through subsequent geometry optimization and MD simulations. The details of the bonding criteria are as follows. Firstly, the distance between the L1 and L2 atoms should be within 6 Å to avoid the addition of unrealistic bond lengths that cannot be fully optimized. Secondly, the angle between the vectors v1 and v2 (Fig. 2a) should be between 150° and 180°. Specifically, vector v1 is constructed by the candidate L1 atom and the carbon atom in the benzene ring located on its opposite site. Thirdly, another orientational criterion demands the angle between the planes of the triazine ring and the benzene ring with L1 atom to be smaller than 40°. Finally, the angle between vectors m1 and m2 (Fig. 2b) needs to be smaller than 40°. Specifically, vector m1 is identical to vector v1, and vector m2 is defined by the candidate L1 and L2 atoms.
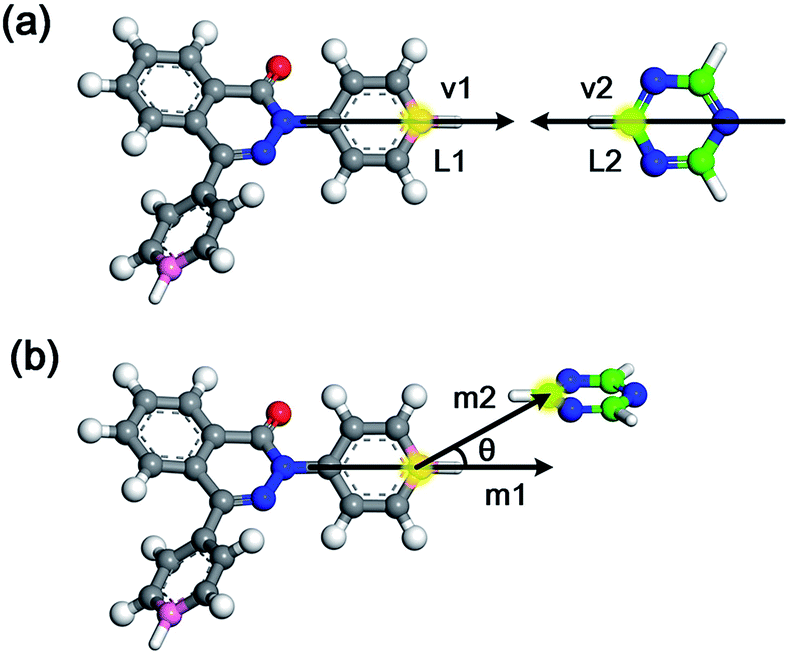 | ||
| Fig. 2 Diagram of the bonding criteria. | ||
During each linking cycle, the system searches for the closest pair that satisfies the bonding criteria. If the satisfied pair is found, then a single bond will be added between the corresponding linking atoms L1 and L2. In the meantime, the redundant H atoms will be removed from the system, and a geometry optimization will be immediately performed to relax and optimize the new bond and the system as well. If no pair in the system satisfies the bonding criteria, a short NVT MD simulation (i.e., md1 type MD simulation in Fig. 3) will be applied to refresh the system for another search. This searching approach is iterated until the satisfied pair of L1 and L2 atoms is found or the designated maximum number of attempts (i.e., 40 in this study) is reached. This manner is analogous to the algorithm in the Polymatic code embedded in pysimm package.31 Furthermore, additional NVT MD steps (i.e., md2 type MD simulation in Fig. 3) are inserted into the linking cycles to further relax and equilibrate the system. Specifically, an NVT MD simulation is performed after each formation of three bonds. The linking cycles are ceased when the desired number of bonds is successfully formed or the maximum number of pair searching attempts arrives.
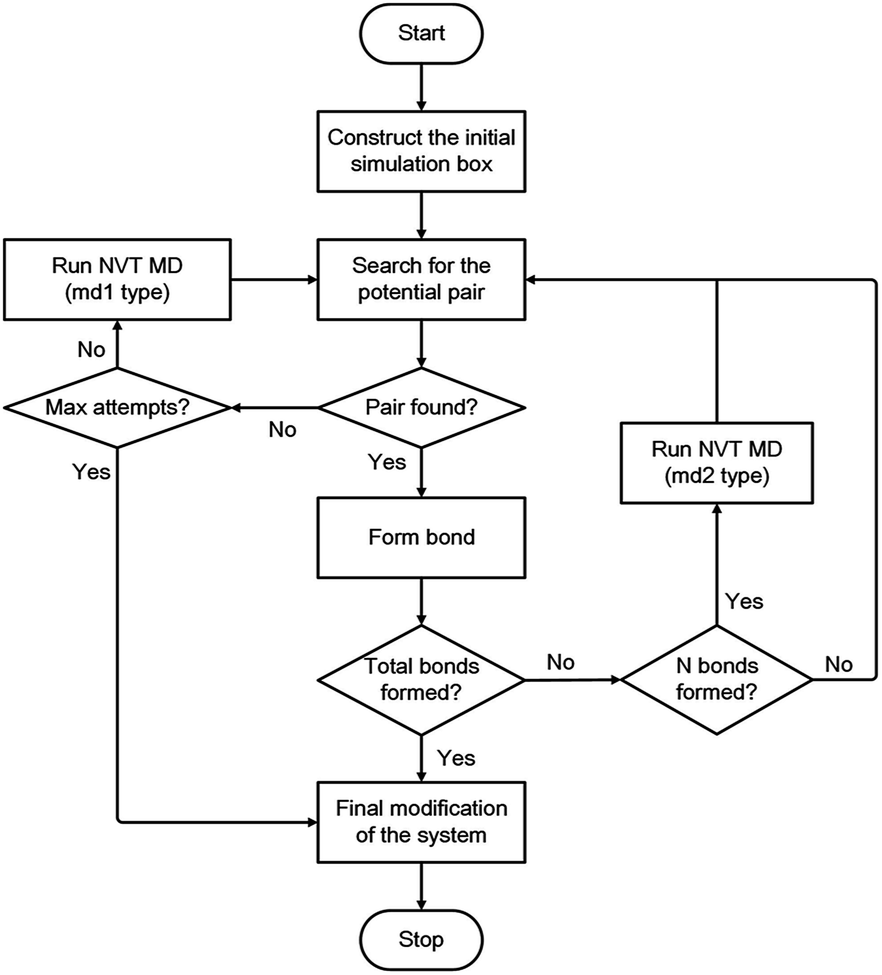 | ||
| Fig. 3 Flowchart of the modelling algorithm. | ||
The triazine rings produced from the actual reactions are used as a group of building units in this study. Therefore, unlinked L1 and L2 atoms still remain in the system. Under this circumstance, the network obtained after the accomplishment of the linking cycles demands additional modification for the chemically realistic structure. The detailed description of this modification approach is presented in the ESI.† Following the final modification process, a geometry optimization is performed and a gradual compression and relaxation scheme depicted in Table 1 is utilized to finally optimize and equilibrate the system. The flowchart of the proposed modelling algorithm is displayed in Fig. 3. Further details of the modelling algorithm and the simulation method are supplied in the ESI.†
| Step | Ensemble | Conditions | Length (ps) |
|---|---|---|---|
| 1 | NVT | 300 K | 500 |
| 2 | NPT | 300 K, 1 bar | 50 |
| 3 | NVT | 300 K | 500 |
| 4 | NPT | 300 K, 1 bar | 50 |
| 5 | NVT | 300 K | 500 |
| 6 | NPT | 300 K, 1 bar | 2000 |
| 7 | NVT | 300 K | 2000 |
Results and discussion
The proposed modelling algorithm was applied for the two CTF-type MPCFs, namely MPCF-1 and MPCF-2. This reconstruction approach aims to establish the representative models for the experimental samples, which can reproduce a set of experimentally measured properties, such as surface area, pore volume, powder XRD (PXRD) data, and nitrogen adsorption isotherm results. Note that the experimental data that can be used for comparison with the simulated models are limited. However, this comparison method offers an imperfect yet useful way to validate the simulated models of amorphous materials to date.32The surface area and pore volume of the simulated atomistic model can be calculated directly by geometric methods. Generally, the two types of geometric surfaces commonly used for characterizing the porosities of the simulated models are accessible surface area (ASA) and Connolly surface area (CSA). These geometric surfaces are determined by rolling a probe over the surface of the frameworks. The CSA is obtained from the boundary between the probe and the framework atoms, whereas the ASA is defined by the locus of the probe center.33 A previous work has demonstrated that the ASA is more favourable for depicting the surface areas of the porous solids, however, the CSA is more appropriate for the pore volumes.34 Therefore, the surface areas of the simulated models in this work were obtained by calculating the ASA using the Atom Volumes & Surfaces tool in BIOVIA Materials Studio 2017R2 software, and the pore volumes were calculated from the CSA. Moreover, given that the surface areas and pore volumes are derived from the nitrogen sorption isotherm experimentally, the probe radius for the calculations was 1.82 Å, which is consistent with the kinetic radius of the N2 molecule.
The average calculated surface areas and pore volumes of five independent simulated models of MPCF-1 and MPCF-2 along with the corresponding experimental results are presented in Table 2. The simulated results of surface areas and pore volumes are in acceptable agreement with the experimental results. An exact consistency between the theoretical and experimental results is unexpected because the results are based on different theories and assumptions and derived from distinct techniques. Nevertheless, the comparison of these properties as a validation for the simulated models of porous solids is generally accepted.32,34 Although minor differences exist between the simulated and experimental values, the tendency of the simulated results is in accordance with the experiments. Specifically, the experimental sample of MPCF-1 obtains higher surface area and larger pore volume than that of MPCF-2, and the simulated results manifest the same trend. Furthermore, the average density of the MPCF-1 models is lower than that of MPCF-2, implying that MPCF-2 is denser than MPCF-1 and exhibits less accessible surface and pores. The simulated ASAs for MPCF-1 and MPCF-2 are displayed in Fig. S4 in the ESI.†
| Density (g cm−3) | Surface area (m2 g−1) | Pore volume (cm3 g−1) | |
|---|---|---|---|
| a Average values and standard deviations for five independent simulated models.b The suffix “-exp” denotes the experimental sample. | |||
| MPCF-1a | 0.73 ± 0.02 | 1081 ± 25 | 0.69 ± 0.04 |
| MPCF-1-expb | — | 1236 | 0.70 |
| MPCF-2a | 0.80 ± 0.03 | 875 ± 67 | 0.51 ± 0.06 |
| MPCF-2-expb | — | 1009 | 0.52 |
Further characterization and validation of the simulated models were conducted by comparing the calculated structure factors of the simulated models with the PXRD patterns of the experimental samples. This comparison approach has been considered as the first and most important validation method for the simulated models.18 The structure factor is provided by the Fourier transform of the radial distribution function g(r) and depicted in the following equation:
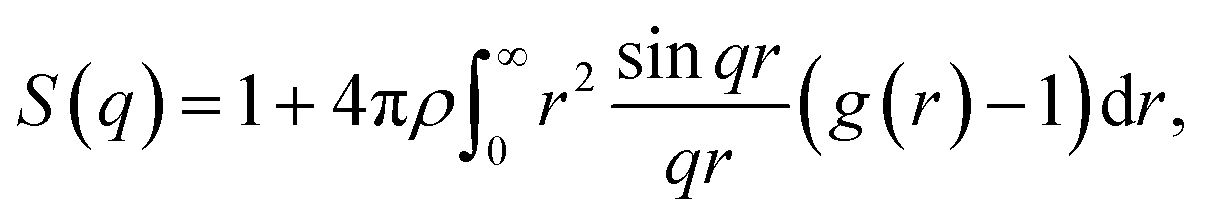 | (1) |
The structure factors of the simulated models were calculated using ISAACS software,36 and the total scattering structure factors of the experimental samples were obtained by PDFgetX3 (ref. 37) from the PXRD results. The detailed parameters of these calculations are provided in the ESI.† The average simulated structure factors for MPCF-1 and MPCF-2 compared with the corresponding experimental data are displayed in Fig. 4. For MPCF-1, the calculated structure factors of simulated models are in good agreement with the experimental data. For MPCF-2, the peak positions, number of peaks, and the relative peak intensities of the simulated models are also in conformity with the experimental result despite the variation in the relative intensities of troughs. The low values of q indicate long distances because the scattering vector q is inversely proportional to the distance d. However, the size of the simulated models is limited by the simulation box, which is considerably smaller than the experimental samples. Therefore, discrepancy between the structure factors of simulated MPCF-2 models and the experimental sample is observed in the low q region. Nevertheless, on the basis of the acceptable consistencies in the structure factors of the simulated models and experimental samples for both MPCF-1 and MPCF-2, we believe that the proposed simulated models can represent the structures of the experimental samples to some extent.
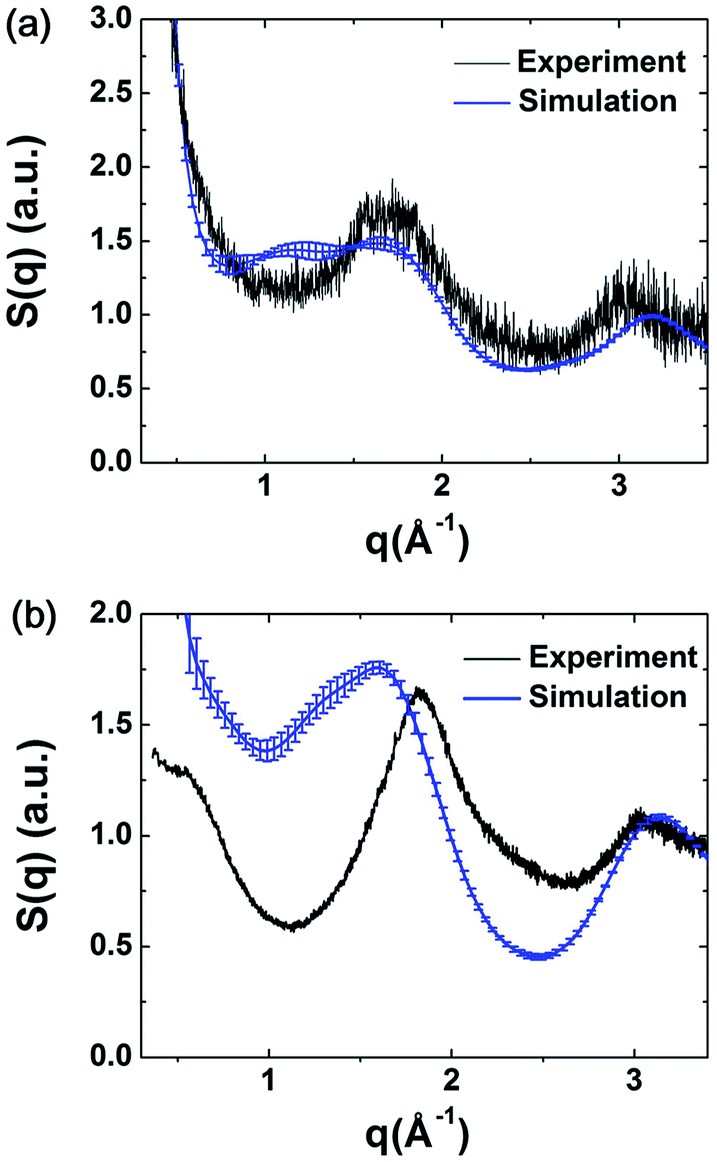 | ||
| Fig. 4 Average simulated structure factors for (a) MPCF-1 and (b) MPCF-2 displayed in comparison with experimental results. | ||
The pore structures of the experimental samples are commonly characterized by the specific surface area and the pore volume which can be derived from the nitrogen adsorption measurement at 77 K on the basis of certain theories. Furthermore, the N2 adsorption isotherms for the simulated models can also be obtained by the grand canonical Monte Carlo simulations. Consequently, the adsorption isotherms can be deemed as a further validation approach for the presented models despite the relatively expensive computation.
In this work, the adsorption isotherms for nitrogen at 77 K were simulated by the sorption module in BIOVIA Materials Studio 2017R2 software. The Metropolis Monte Carlo method was used for all the simulations with 105 steps for the equilibration stage followed by the 106 production steps. Moreover, Dreiding force field38 was used to calculate the non-bond interactions between the framework atoms and the N2 molecules, and the TraPPE model was used for N2 molecule.39 In addition, the electrostatic interactions were calculated by Ewald sums, and the summation method for van der Waals interactions was set to be atom based both with “fine” quality settings.
Adsorption isotherm simulations were implemented for MPCF-1 and MPCF-2 samples, and the average simulated results are plotted in Fig. 5 in comparison with the experimental data. Evidently, the simulated results for both MPCF-1 and MPCF-2 can reproduce the shape of the experimental isotherms especially with quantitative consistency. Thus, the excellent agreement further validates the presented simulated models.
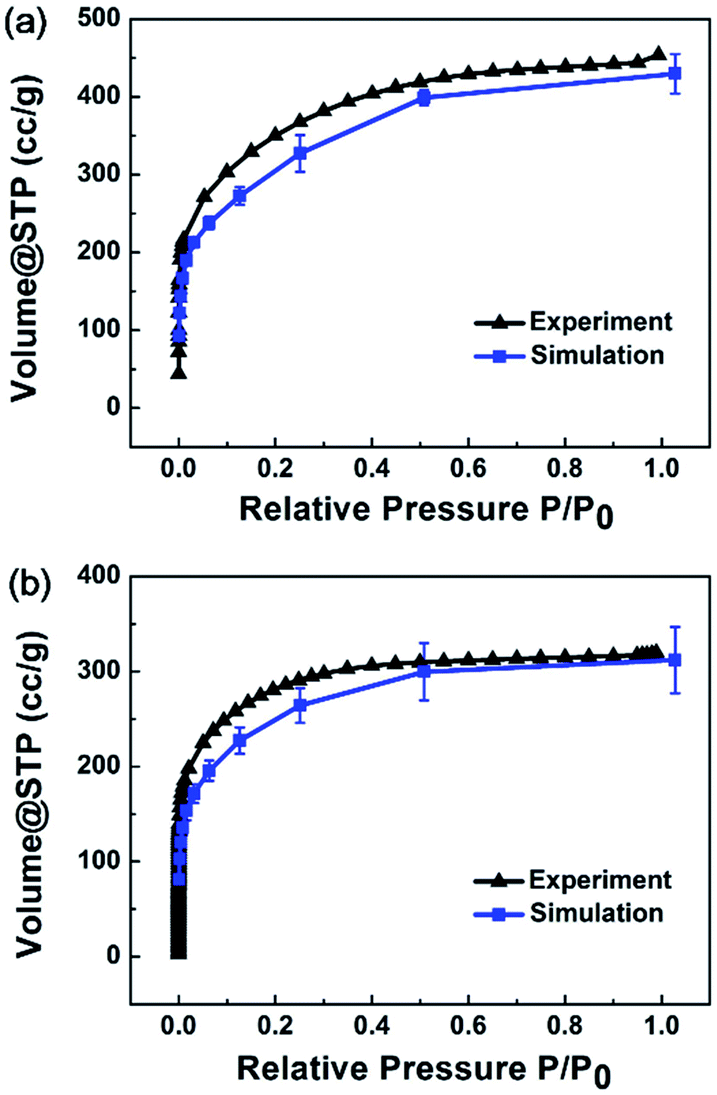 | ||
| Fig. 5 Average simulated N2 adsorption isotherms for (a) MPCF-1 and (b) MPCF-2 compared with experimental data. | ||
The agreement in surface areas, pore volumes, structure factors and N2 adsorption isotherms of the simulated models and experimental samples suggests that the simulated models can represent the structures of the experimental samples to some extent, and consequently validates the efficiency of the proposed modelling algorithm.
Conclusion
A new approach for constructing the atomistic structures of CTF-type polymers is presented in this work. To validate the proposed modelling approach, two synthesized CTF-type polymers, namely MPCF-1, and MPCF-2, were used, and the properties of the simulated models were calculated. Specifically, the surface areas and pore volumes, structure factors and N2 adsorption isotherms of the simulated models were obtained and compared with the corresponding experimental results. Notably, all the simulated properties exhibit acceptable consistencies with the experimental data, thereby suggesting the validation and efficiency of the proposed modelling approach. Therefore, the validated structural models of the amorphous CTF-type polymers would provide molecular-level information, complementary to the experimental techniques, and consequently improve the characterization and comprehension of the complex amorphous structures. Furthermore, the proposed modelling approach can be applied to new CTF-type polymers prior to the experimental synthesis, suggesting its predictive capacity.Conflicts of interest
There are no conflicts to declare.Acknowledgements
The authors acknowledge the Supercomputer Center of Dalian University of Technology for providing computing resources and the support from the National Key Research and Development Program (No. 2018YFB1107500), the National Natural Science Foundation of China (No. 51503024), the Fundamental Research Funds for the Central Universities (No. DUT17RC(3)003, No. DUT18RC(4)033), the National Natural Science Foundation of the Joint Fund Key Projects (No. U1663226), Dalian Youth Science and Technology Star Project Support Program (No. 2017RQ104), the Scientific Research Foundation for Doctor, Liaoning Province of China (No. 20170520083).Notes and references
- S. Das, P. Heasman, T. Ben and S. Qiu, Chem. Rev., 2017, 117, 1515–1563 CrossRef CAS PubMed.
- Y. Zhao, K. X. Yao, B. Teng, T. Zhang and Y. Han, Energy Environ. Sci., 2013, 6, 3684 RSC.
- W. Shao, F. Hu, C. Song, J. Wang, C. Liu, Z. Weng and X. Jian, J. Mater. Chem. A, 2019, 7, 6363–6373 RSC.
- N. Zhang, T. Wang, X. Wu, C. Jiang, F. Chen, W. Bai and R. Bai, RSC Adv., 2018, 8, 3803–3808 RSC.
- B. Meng, H. Li, S. M. Mahurin, H. Liu and S. Dai, RSC Adv., 2016, 6, 110307–110311 RSC.
- B. Ghanem, F. Alghunaimi, N. Alaslai, X. Ma and I. Pinnau, RSC Adv., 2016, 6, 79625–79630 RSC.
- H. Zhang, C. Zhang, X. Wang, Z. Qiu, X. Liang, B. Chen, J. Xu, J.-X. Jiang, Y. Li, H. Li and F. Wang, RSC Adv., 2016, 6, 113826–113833 RSC.
- Q. Wang, R. Li, X. Ouyang and G. Wang, RSC Adv., 2019, 9, 40531–40535 RSC.
- M. Liu, L. Guo, S. Jin and B. Tan, J. Mater. Chem. A, 2019, 7, 5153–5172 RSC.
- P. Kuhn, M. Antonietti and A. Thomas, Angew. Chem., Int. Ed., 2008, 47, 3450–3453 CrossRef CAS PubMed.
- P. Kuhn, A. Forget, D. Su, A. Thomas and M. Antonietti, J. Am. Chem. Soc., 2008, 130, 13333–13337 CrossRef CAS PubMed.
- F. Hu, J. Wang, S. Hu, L. Li, W. Shao, J. Qiu, Z. Lei, W. Deng and X. Jian, ACS Appl. Mater. Interfaces, 2017, 9, 31940–31949 CrossRef CAS PubMed.
- F. Hu, J. Wang, S. Hu, L. Li, G. Wang, J. Qiu and X. Jian, Nanoscale, 2016, 8, 16323–16331 RSC.
- S. Ren, M. J. Bojdys, R. Dawson, A. Laybourn, Y. Z. Khimyak, D. J. Adams and A. I. Cooper, Adv. Mater., 2012, 24, 2357–2361 CrossRef CAS PubMed.
- J. Artz, ChemCatChem, 2018, 10, 1753–1771 CrossRef CAS.
- S. Brunauer, P. H. Emmett and E. Teller, J. Am. Chem. Soc., 1938, 60, 309–319 CrossRef CAS.
- G. Kupgan, L. J. Abbott, K. E. Hart and C. M. Colina, Chem. Rev., 2018, 118, 5488–5538 CrossRef CAS PubMed.
- L. J. Abbott, K. E. Hart and C. M. Colina, Theor. Chem. Acc., 2013, 132, 1334 Search PubMed.
- L. J. Abbott and C. M. Colina, Macromolecules, 2014, 47, 5409–5415 CrossRef CAS.
- G. Kupgan, T. P. Liyana-Arachchi and C. M. Colina, Polymer, 2016, 99, 173–184 CrossRef CAS.
- L. J. Abbott and C. M. Colina, J. Chem. Eng. Data, 2014, 59, 3177–3182 CrossRef CAS.
- S. J. Rukmani, T. P. Liyana-Arachchi, K. E. Hart and C. M. Colina, Langmuir, 2018, 34, 3949–3960 CrossRef CAS PubMed.
- K. E. Hart, L. J. Abbott, N. B. McKeown and C. M. Colina, Macromolecules, 2013, 46, 5371–5380 CrossRef CAS.
- P. Fayon and A. Trewin, Phys. Chem. Chem. Phys., 2016, 18, 16840–16847 RSC.
- J. M. H. Thomas and A. Trewin, J. Phys. Chem. C, 2014, 118, 19712–19722 CrossRef CAS.
- P. Fayon, J. M. H. Thomas and A. Trewin, J. Phys. Chem. C, 2016, 120, 25880–25891 CrossRef CAS.
- A. Yassin, M. Trunk, F. Czerny, P. Fayon, A. Trewin, J. Schmidt and A. Thomas, Adv. Funct. Mater., 2017, 27, 1700233 CrossRef.
- C. Reece, D. J. Willock and A. Trewin, Phys. Chem. Chem. Phys., 2015, 17, 817–823 RSC.
- D. Y. Osadchii, A. I. Olivos-Suarez, A. V. Bavykina and J. Gascon, Langmuir, 2017, 33, 14278–14285 CrossRef CAS PubMed.
- L. J. Abbott and C. M. Colina, Macromolecules, 2011, 44, 4511–4519 CrossRef CAS.
- M. E. Fortunato and C. M. Colina, SoftwareX, 2017, 6, 7–12 CrossRef.
- S. Jiang, K. E. Jelfs, D. Holden, T. Hasell, S. Y. Chong, M. Haranczyk, A. Trewin and A. I. Cooper, J. Am. Chem. Soc., 2013, 135, 17818–17830 CrossRef CAS PubMed.
- M. L. Connolly, J. Appl. Crystallogr., 1983, 16, 548–558 CrossRef CAS.
- T. Düren, F. Millange, G. Férey, K. S. Walton and R. Q. Snurr, J. Phys. Chem. C, 2007, 111, 15350–15356 CrossRef.
- M. T. Dove, M. G. Tucker and D. A. Keen, Eur. J. Mineral., 2002, 14, 331–348 CrossRef CAS.
- S. Le Roux and V. Petkov, J. Appl. Crystallogr., 2010, 43, 181–185 CrossRef CAS.
- P. Juhas, T. Davis, C. L. Farrow and S. J. L. Billinge, J. Appl. Crystallogr., 2013, 46, 560–566 CrossRef CAS.
- S. L. Mayo, B. D. Olafson and W. A. Goddard, J. Phys. Chem., 1990, 94, 8897–8909 CrossRef CAS.
- J. J. Potoff and J. I. Siepmann, AIChE J., 2001, 47, 1676–1682 CrossRef CAS.
Footnote |
| † Electronic supplementary information (ESI) available. See DOI: 10.1039/c9ra11035f |
| This journal is © The Royal Society of Chemistry 2020 |