
 Open Access Article
 This Open Access Article is licensed under a Creative Commons Attribution-Non Commercial 3.0 Unported Licence
Experimental study on the kinetic effect of N-butyl-N-methylpyrrolidinium tetrafluoroborate and poly(N-vinyl-caprolactam) on CH4 hydrate formation
Jun-Jie Renabcd,
Zhi-Lin Luabce,
Zhen Long *abc and
Deqing Liangabc
*abc and
Deqing Liangabc
aCAS Key Laboratory of Gas Hydrate, Guangzhou Institute of Energy Conversion, Chinese Academy of Sciences, Guangzhou 510640, China. E-mail: longzhen@ms.giec.ac.cn
bGuangdong Provincial Key Laboratory of New and Renewable Energy Research and Development, Guangzhou, Guangdong 510640, China
cGuangzhou Center for Gas Hydrate Research, Guangzhou Institute of Energy Conversion, Chinese Academy of Sciences, Guangzhou 510640, China
dUniversity of Chinese Academy of Sciences, Beijing 100049, China
eNano Science and Technology Institute, University of Science and Technology of China, Suzhou, Jiangsu 215123, China
First published on 17th April 2020
Abstract
In this work, a series of experiments were carried out to study the kinetic inhibition performance of N-butyl-N-methylpyrrolidinium tetrafluoroborate ([BMP][BF4]), poly(N-vinylcaprolactam) (PVCap) and compound inhibitor systems on methane hydrate from both macroscopic and microscopic perspectives. In the macroscopic experiments, the influence of the concentration, the ratio of inhibitors, the subcooling on the induction time and gas consumption rate of methane hydrate were studied. The results indicated that [BMP][BF4] could inhibit the growth rate of CH4 hydrate, but failed to delay the nucleation. An improved inhibitory effect was observed by combining [BMP][BF4] and PVCap, and the optimal ratio of the two inhibitors was obtained to gain the best inhibition performance. Furthermore, the microstructure and morphology of methane hydrate crystals formed in different inhibitor systems were investigated through powder X-ray diffraction (PXRD), Raman spectroscopy and scanning electron cryomicroscopy (Cryo-SEM) methods. It was found that [BMP][BF4] and PVCap had different influences on the large cage occupancy by CH4 and the morphology of methane hydrate.
1. Introduction
Gas hydrate, also referred to as clathrate hydrate, is an ice-like solid in which the gas molecules (guest) are trapped in different-size polyhedral cavities composed of hydrogen-bonded water molecules (host).1 Components of natural gases, such as methane, ethane, propane, and carbon dioxide, could form gas hydrates under relatively low temperature and high pressure. There are three common hydrate structures, namely cubic structure I (sI), cubic structure II (sII) and hexagonal structure H (sH), differing from each other in the size of the guest molecules and the shape of the hydrate cages.2,3 Despite the worldwide discovery of the abundance of naturally occurring gas hydrates as potential energy, gas hydrates have been regarded as a hazard in the oil and gas industry since the 1930s, because the formation of gas hydrate gives rise to serious engineering accidents, huge economic losses and ecological risks.4–6Many methods have been adopted to prevent the formation of gas hydrate, among which injecting chemicals such as thermodynamic hydrate inhibitors (THIs) and low dosage hydrate inhibitors (LDHIs) is the most common methods.7 Methanol or glycol, representative as traditional THIs, can shift the hydrate equilibrium phase boundary to a lower temperature and higher pressure, which is unfavourable for hydrate formation.8,9 However, great amount of THIs are needed to be effective (up to 50 vol%), which can cost a lot for post processing and be a burden to the environment.8,10,11 LDHIs, consisting of kinetic hydrate inhibitors (KHIs) and anti-agglomerates (AAs), are effective at low concentrations (usually less than 1.0 wt%). KHIs retard the formation kinetics of hydrate crystals by prolonging the nucleation time and/or slowing down the growth rate of crystals.12 In contrast, AAs allow hydrate to form, but keep the particles small and well dispersed in the hydrocarbon liquid.13,14 Kinetic inhibitors usually are some water soluble polymers, such as poly(N-vinylpyrrolidone) (PVP) and poly(N-vinylcaprolactam) (PVCap). These chemicals are often used as standards to compare the performance of other inhibitors.15–20 However, KHIs are strictly limited by low subcooling (usually less than 10 K) and lose their effectiveness when the ultra-low temperature is encountered.1,5 It was found that the performance of KHIs could be efficiently boosted when some chemicals were used in conjunction with KHIs.21–24 Such chemicals are called synergists, which are effective and of great value. However, they have not got corresponding attention.21 Ionic liquids (ILs), a kind of liquid salts at room temperature, comprise bulky and asymmetric organic cations and organic or inorganic anions. Most of them are thermally stable, non-flammable, non-toxic and environmentally friendly. They can be designed into a specific structure deliberately to achieve the applications in various fields.25,26,27 Considering the aforementioned properties of ionic liquids, they may have the potential to be thermodynamic inhibitors. Xiao et al.25 first reported that five imidazolium-based ILs (dual function inhibitors) could not only act as THIs, but also as KHIs on the formation of gas hydrate. Xiao et al. reported that the inhibitory effect of ILs depended on the anions and the length of alkyl chain substituents of the cations.28 Behzad Partoon et al.29 experimentally studied the performances of [EMIM][Cl] and [OH-EMIM][Cl] as LDHIs and found that [EMIM][Cl] could act as synergist in the presence of monoethylene glycol (MEG) at pressures above 35.3 MPa. In addition, Xiao et al. found that tetrafluoroborate ILs performed better than other ILs due to their stronger hydrogen bond, and they were much better than poly(N-vinylpyrrolidone) (PVP), which was generally considered to be an effective KHI. Shen et al.30 investigated several kinds of ILs on the formation of methane hydrate and found that the inhibition performance of [BMP][BF4] was better than PVP at the same concentration. Lee et al.31–33 found that adding ILs to the PVCap system could enhance the inhibition effect on the hydrate formation.
Amounts of data on the thermodynamic inhibitory effect of ILs have been revealed.34 However, there are limited researches on the kinetic synergetic effect of ILs in the presence of KHIs, especially from the microscopic level. In this work, the kinetic synergetic effect of N-butyl-N-methylpyrrolidinium tetrafluoroborate ([BMP][BF4]) on the formation of methane hydrate in the presence of poly(N-vinylcaprolactam) (PVCap) was studied. The chemical structures of [BMP][BF4] and PVCap are drawn in Fig. 1. The nucleation rate and the growth rate of methane hydrate were represented by the induction time and the gas consumption rates, respectively. These two parameters could be used to evaluate the inhibitory performance. The powder X-ray diffraction (PXRD), Raman spectroscopy (Raman) and scanning electron microscopy (SEM) were used to investigated the inhibitory effects of the inhibitors from a microscopic viewpoint and the related inhibition mechanism was proposed.
 | ||
| Fig. 1 Chemical structure of [BMP][BF4] and PVCap. | ||
2. Experimental methods
2.1 Experimental materials
The chemicals used in the experiments are listed in Table 1. The ionic liquid [BMP][BF4] was purchased from Lanzhou Institute of Chemical Physics with a purity of 0.99 mass fraction. PVCap was synthesized in the laboratory and the gel permeation chromatography (GPC) indicated that the number average molecular weight (Mn) was 10![[thin space (1/6-em)]](https://www.rsc.org/images/entities/char_2009.gif) 522 g mol−1 and weight average molecular weight (Mw) was 15275 g mol−1, which indicated the polydispersity index (PDI) was 1.36. Deionized water was made in the laboratory and used to prepare solutions. The mass of the materials was weighed using an electronic analytical balance with an uncertainty of ±0.1 mg.
522 g mol−1 and weight average molecular weight (Mw) was 15275 g mol−1, which indicated the polydispersity index (PDI) was 1.36. Deionized water was made in the laboratory and used to prepare solutions. The mass of the materials was weighed using an electronic analytical balance with an uncertainty of ±0.1 mg.
| Chemicals | Abbreviation | Molecular weight (g mol−1) | Purity (%) | Supplier |
|---|---|---|---|---|
| N-Butyl-N-methylpyrrolidinium tetrafluoroborate | [BMP][BF4] | 229.07 | ≥99 | Lanzhou Institute of Chemical Physics |
| Poly(N-vinylpyrrolidone) K90 | PVP K90 | 360000 |
— | Tokyo Chemical Industry Co., Ltd |
| Poly(N-vinylcaprolactam) | PVCap | 15275 |
— | Laboratory-made |
| Methane gas | CH4 | 16 | 99.99 | Foshan Kodi Gas Chemical Industry Co., Ltd. |
| Deionized water | H2O | 18 | — | Laboratory-made |
2.2 Apparatus and procedures
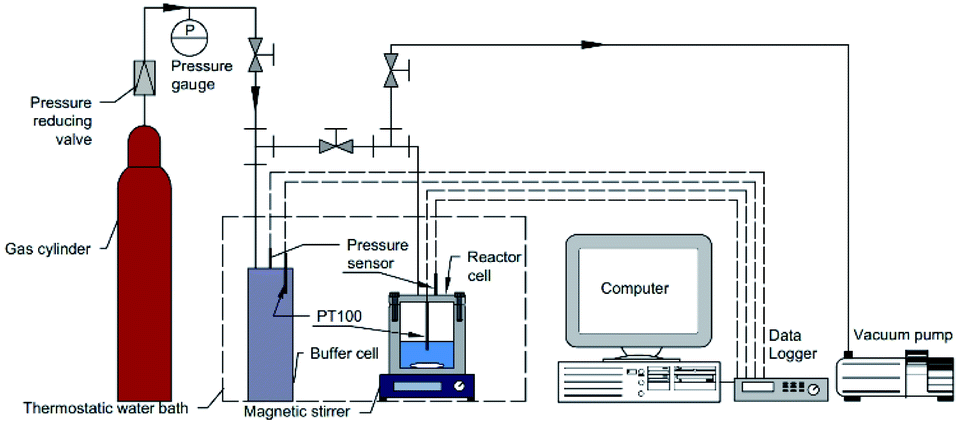 | ||
| Fig. 2 Schematic diagram of experimental apparatus. | ||
The macroscopic experimental procedure was as follows. First, the cell was thoroughly washed with deionized water and the experimental aqueous solution three times. Then 30 mL of the experimental aqueous solution or pure water were added into the cell. Secondly, the thermostatic water bath was turned on to adjust the temperature to the set value. During this time, the magnetic stirrer was turned on to enhance heat transfer. Then the system was evacuated by a vacuum pump for about 5 min and washed with methane gas three times. When the temperature was stable, the magnetic stirrer was turned off and then methane gas was introduced into the system from the gas buffer cell until the desired pressure was reached. Finally, when the pressure and temperature were both reached and stabilized at the set value, the magnetic stirrer was turned on at a rate of 800 rpm and the recording of experimental data was commenced.
Induction time was usually defined as a period range from the time that the system reached hydrate equilibrium conditions to the formation of hydrate nucleus of critical size.35 In this work, it was defined as the period from the start of the agitation after the experimental conditions were stable to the moment at which catastrophic hydrate was formed and was remarked by an abrupt pressure drop accompanied with a sharp increase of the temperature. Due to the stochastic hydrate nucleation, each run was repeated for at least three times with fresh inhibitor aqueous solution. A statistical method was used to obtain the averaged induction time and error. The consumption rate of methane gas was also analysed by the collected experimental data. In an isochoric reactor, the moles of consumed methane gas could be calculated with the change of the pressure and the temperature of the gas. For all the macroscopic experimental runs, the cumulative moles of consumed CH4 at time t were calculated from the following equation:
 | (1) |
PXRD (X'Pert Pro MPD, PANalytical) was used to determine the type of hydrate crystal. The instrument was performed by using Cu Kα radiation (λ = 1.5406 Å) and parallel beam optics in the θ/2θ step scan mode. The scanning range was 5–80° and the scanning step width was 0.017°. About 0.5 g of hydrate sample was fully grounded into a fine powder under liquid nitrogen, and transferred to the precooled sample table quickly. The sample was pressed and smoothed with a flat spade, and was covered quickly. The experimental temperature was kept constant at 183.15 K during the experiment.
Raman spectra were collected by a confocal Raman spectrometer (LabRAM HR800, Horiba) equipped with a high-performance CCD detector and Olympus microscope. An Ar+ laser emitting a wavelength of 532 nm was used as the excitation source at a maximum output power of 50 mW. In this work, the device temperature was operated at 183.15 K with an ambient pressure N2 atmosphere. Hydrate samples for Raman analyses were prepared in the same way as those for PXRD analyses. After they were loaded into a quartz crucible which was placed in a cooling and heating stage (Linkam BCS), the laser was focused on their surface. The spectra were detected at regular time intervals. Structure and cage occupation information of hydrate samples can be determined by Raman spectrum analysis.38,39
Cryo-SEM (S-4800, Hitachi) could provide high-precision microscopic surface morphology information of hydrate samples formed in different systems. A small amount of gas hydrate samples were wrapped in tin foil on the sample holder. The prepared hydrate samples were then loaded on the SEM sample chamber via a refrigerated delivery system. The hydrate samples were observed and photographed at 100 K. It is worth noting that a built-in metal cutter was used to cut or crack the surface of the hydrate sample in the pre-treatment room of the freezing transmission system in order to expose the fresh and clean parts, thus reducing the impact of frosting ice on the image of the sample surface.
3. Results and discussion
3.1 Experimental results for macroscopic experiments
:1 mass ratio of [BMP][BF4] to PVP) and [BMP][BF4] + PVCap (1:1) on the formation of methane hydrate were experimentally investigated at 275.15 K and 6.95 MPa with two mass fractions of 1.0 and 2.0 wt%. The subcooling was about 8.0 K. The averaged induction time and statistical error was illustrated in Fig. 3. The phase equilibrium diagram of CH4 hydrate was calculated by the CSMGem program.1
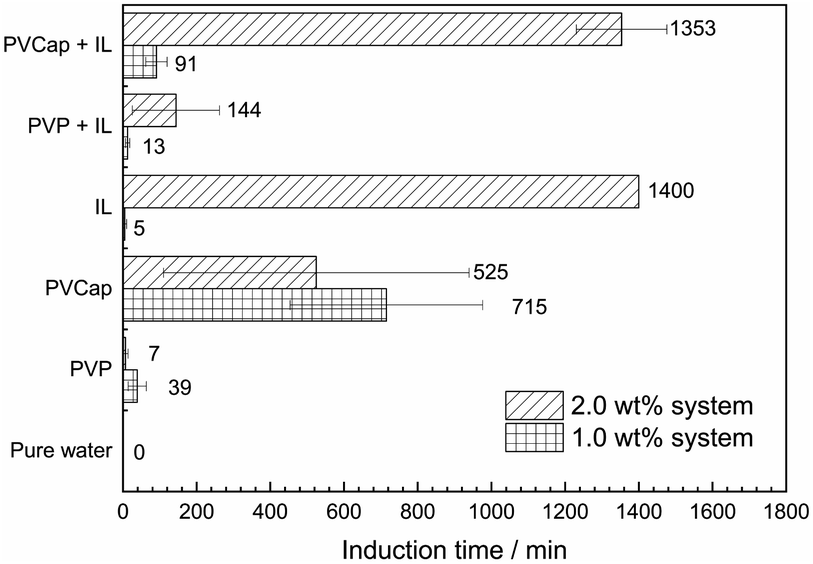 | ||
| Fig. 3 Induction time of methane hydrate formation in different inhibitor systems. | ||
Seen from Fig. 3, the averaged induction time for each inhibitor system at 2.0 wt% was significantly longer than that at 1.0 wt%, while such an opposite trend happened to single PVCap. However, PVCap-containing mixed systems stilled exhibited stronger inhibition performance than other systems at the same concentrations of 1.0 and 2.0 wt%. According to the pressure change curve with time in Fig. 4, it was interestingly found that there was almost no hydrate formed for the 2.0 wt% [BMP][BF4] system, and the growth rate of gas hydrate was extremely low without sudden temperature rise or pressure drop. Due to the dissolution of methane gas in water agitated by the magnetic stirrer, the gas pressure initially decreased slightly. Noticeably, the value of pressure drop still achieved 0.16 MPa in the end. Although being undetectable from the pressure and temperature changes, small quantity of hydrate formed was still observed after opening the reactor, possibly because of very slow formation rate and quick removing reaction heat by water bath. Meanwhile, it was suggested that the [BMP][BF4] may well hinder the growth rate of gas hydrate, but it was unable to effectively inhibit the hydrate nucleation.
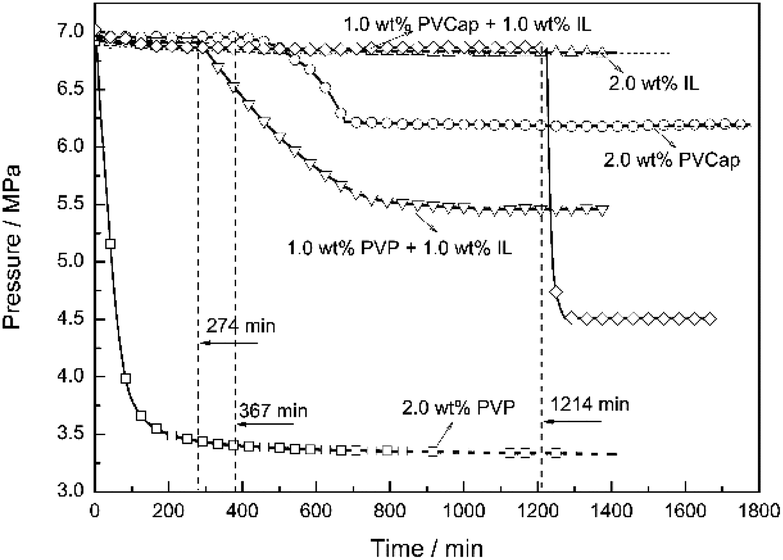 | ||
| Fig. 4 Curves of pressures varying with time for methane hydrate formed in the presence of 2.0 wt% different inhibitor solutions at 275.15 K and 6.95 MPa. | ||
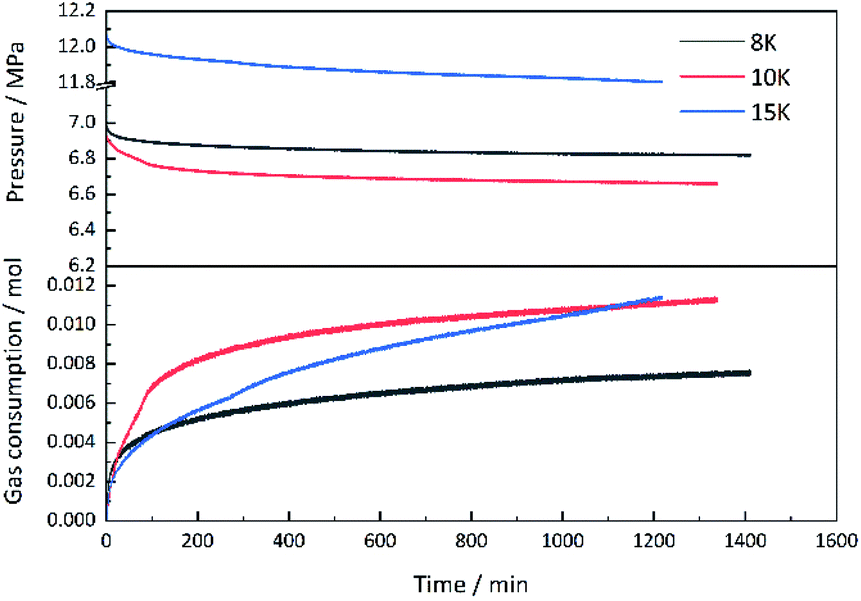 | ||
| Fig. 5 Curves of pressure and gas consumption varying with time for methane hydrate formation with 2.0 wt% [BMP][BF4] solution at different subcooling temperatures. | ||
As [BMP][BF4] was hydrophilic and hygroscopic, it had strong electrostatic charges inducing interaction between ions and dipoles. Besides, BF4−, a representative hydrophilic group, helped [BMP][BF4] to dissolve into water. The ions produced by [BMP][BF4] in the solution might be adsorbed on some active nucleation sites, thereby reducing the number of available sites for hydrate nucleation and growth. In this way, the amount of gas, which could be consumed during this period, would decrease. An adsorption mechanism for inhibiting hydrate nucleation has been proposed in earlier study.40–42 The hydrophilic carbonyl group in the 7-membered ring could enable PVCap to easily interact with water by forming hydrogen bonds, while the alkyl group in the backbone chain could interact with dissolved CH4 gas through hydrophobic interaction.43 Recently, Xu et al.42 verified that PVCap prevented CH4 hydrate nucleation and/or growth by adsorption onto the hydrate surface through molecular simulation. The unstable adsorption caused the hydrate destruction phenomenon and slowed down the hydrate growth. In addition, ILs might effectively penetrate deep into the space where the polymer chain was too large to reach, thereby hindering the hydrate formation. The result indicated a synergistic inhibitory effect by adding [BMF][BF4] in PVCap. Since the mixture of [BMP][BF4] and PVCap performed the best inhibitory effect, they were chosen for further investigation.
:1) at different concentrations on the formation of CH4 hydrate was investigated. The changes in the pressure and temperature with the elapse of time at 273.65 K and 6.0 MPa (8.0 K subcooling) at 1.0 wt%, 1.5 wt% and 2.0 wt% mass concentrations were drawn in Fig. 6. The induction time for the 0.5 wt% [BMP][BF4] + 0.5 wt% PVCap system was just about 86 min. For comparison, the systems of 0.75 wt% [BMP][BF4] + 0.75 wt% PVCap and 1.0 wt% [BMP][BF4] + 1.0 wt% PVCap prolonged the induction time up to 440 and 1290 min, respectively. This indicated that the inhibitory effect of the combined inhibitors was concentration dependent. As expected, the inhibitory effect increased with the increase of the concentration.15,44
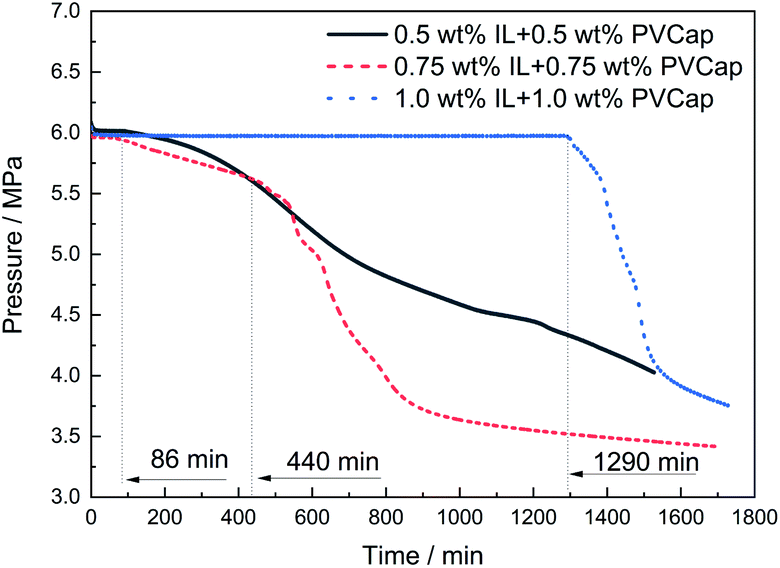 | ||
| Fig. 6 Changes in pressure with elapse of time at different concentrations. | ||
:1, 2:1, 1:2 and 1:3 were investigated. At a low proportion of PVCap, the inhibition performance was almost negligible. The pressure dropped evidently at a very short induction time. Conversely, as shown in Fig. 7, the inhibitory effect of the compound inhibitor enhanced with the increase in the concentration of PVCap. From the perspective of induction time, the solution of compound inhibitor at 1:3 mass ratio of [BMP][BF4] to PVCap exhibited an induction time of 103 min. The inhibitory effect of the compound inhibitor at 1:2 mass ratio of [BMP][BF4] to PVCap was the best, and no hydrate formed during 1800 min. Solution of other ratios did not show significant induction time. From the perspective of pressure drop and CH4 gas consumption rate, it was found that in the beginning each system showed similar pressure drop caused by the dissolution of CH4 in aqueous solution. Subsequently, a solution with an increase in PVCap proportion could more remarkably suppress the methane gas consumption rate. When the ratio of [BMP][BF4] to PVCap was 1:2, the gas consumption rate was almost zero. In summary, there was an optimal ratio 1:2 of [BMP][BF4] to PVCap corresponding to the strongest inhibition performance of the mixture within our studied ratio range.
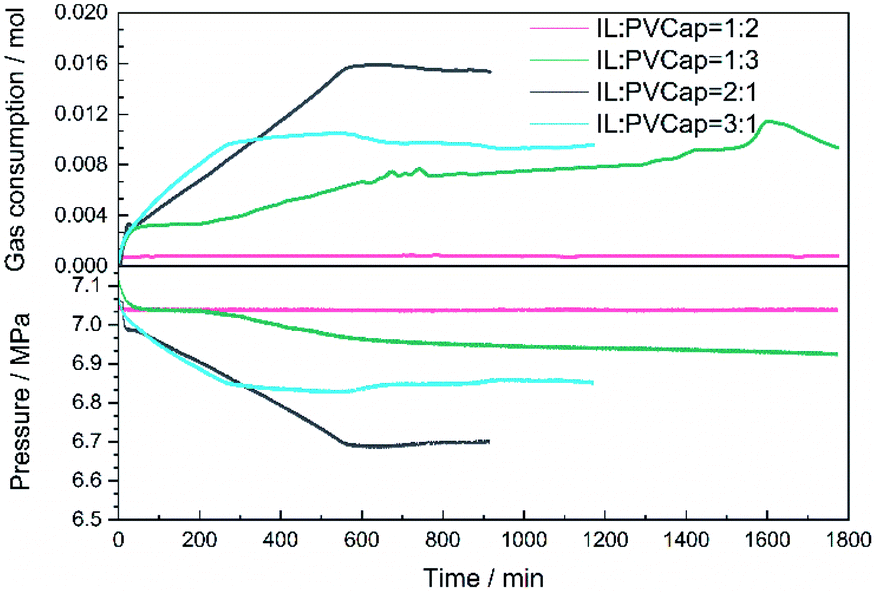 | ||
| Fig. 7 Changes in pressure and gas consumption with elapse of time for methane hydrate formation in 2.0 wt% mixed systems of IL and PVCap at different mass ratios. | ||
3.2 Microscopic experiment analyses
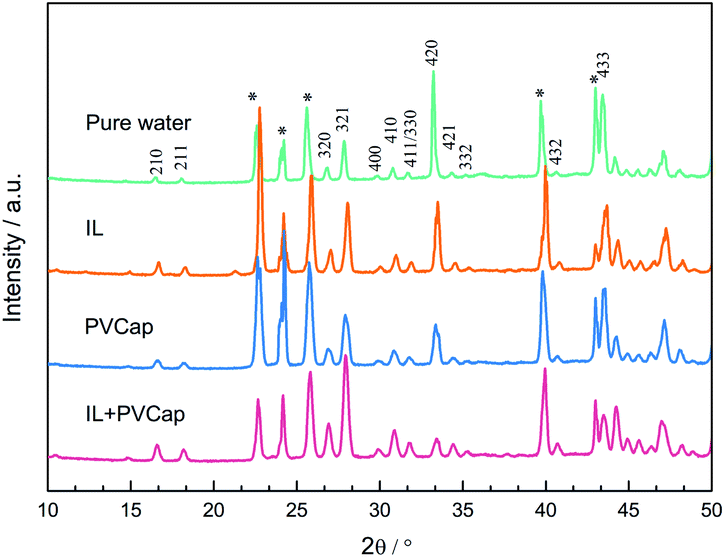 | ||
| Fig. 8 PXRD patterns of hydrate formed in different systems. | ||
:1, indicating that the gas content in the large cages was higher. The results confirmed the evidence from the PXRD analyses that the structure of the hydrate didn't change. The peak intensities had been used to reflect the gas occupancy in large and small cages.47–49 Cage occupancy values by CH4 and hydration number obtained in the presence of inhibitors from Raman spectra analyses were listed in Table 2.
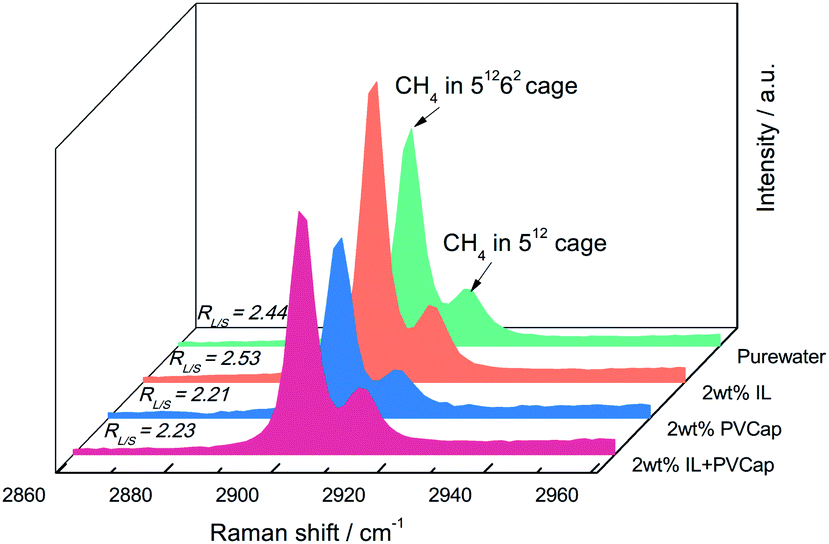 | ||
| Fig. 9 Raman spectra of hydrate formed in different systems. | ||
| Inhibitor systems | Concentration (wt%) | Small cage occupancy, ΘS | Large cage occupancy, ΘL | Hydration number |
|---|---|---|---|---|
| Pure water (control group) | — | 0.9997 | 0.81209 | 6.6939 |
| [BMP][BF4] (IL) | 2.0 | 0.99951 | 0.84141 | 6.5272 |
| PVCap | 2.0 | 0.99989 | 0.73733 | 7.1609 |
| IL + PVCap | 2.0 | 0.99988 | 0.74374 | 7.1183 |
Seen from Fig. 9, the relative ratios of large to small cage occupancies by CH4 in the PVCap-containing systems were smaller than that in pure water except for single [BMP][BF4] solution. This was because the presence of PVCap significantly reduced the absolute occupancy of methane molecules in the large cage, while [BMP][BF4] played an opposite effect (see Table 2). The small cage occupancy was basically the same. It also directly led to the hydration number in [BMP][BF4] system become the smallest.
For all the solution systems, the occupancy of methane molecules in the small cage was basically the same and higher than that in the large cage. This was because kinetic inhibitors interacted with water molecules or hydrate crystals to inhibit the formation or further growth of hydrate.5,22 The small cages could form more easily, because a smaller number of water clusters was required than the large cages.31 Combing the macroscopic kinetic experimental results with the Raman spectra analyses, it was found that [BMP][BF4] at 2.0 wt% could continuously inhibit the growth of hydrates. However, their ability to inhibit the formation of large cages was weaker than PVCap. PVCap may inhibit the nucleation and growth process of hydrate for a period of induction time, and then lost its inhibitory effect. The results showed the different inhibition mechanisms of [BMP][BF4] and PVCap, and further confirmed the results of the macroscopic experiment. When adding [BMP][BF4] in PVCap, the influence of the mixture on the hydrate microstructure was very close to that of pure PVCap. This indicated that PVCap played a major role in the compound inhibitor and [BMP][BF4] acted as a synergist in the presence of PVCap. The compound inhibitor could reduce the amount of PVCap without weakening its inhibitory performance.
:2) system, exhibited both disorder and order as seen in Fig. 10(e). On the one hand, most of the hydrate surfaces became smooth and dense like that of pure water system. On the other hand, many cylindrical hydrates protruded on the surface, causing the hydrate surface to become rough.
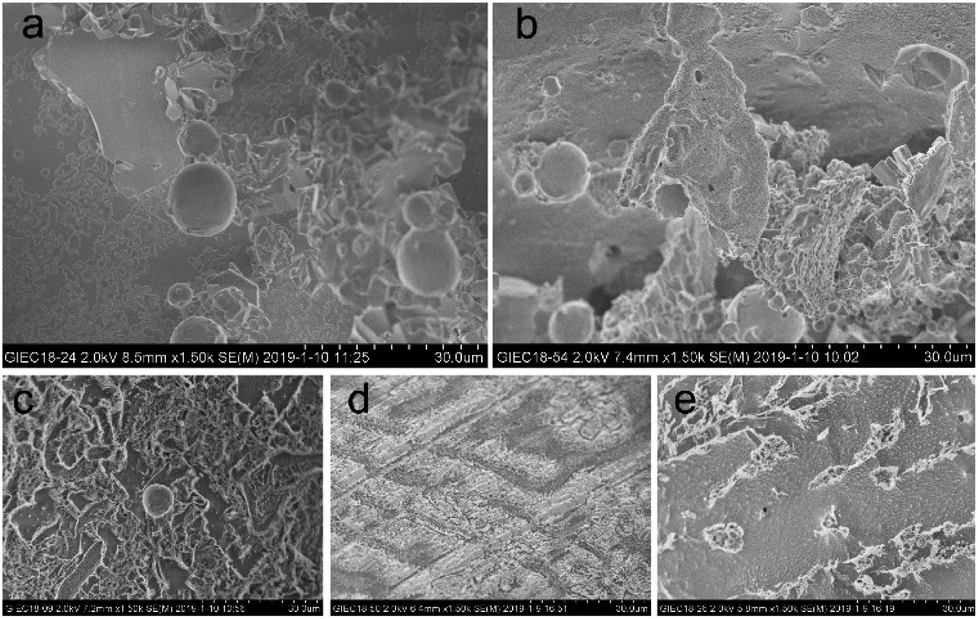 | ||
| Fig. 10 SEM images of CH4 hydrates formed in the presence of different solutions: (a) ice only; (b) pure water; (c) 2.0 wt% PVCap; (d) 2.0 wt% [BMP][BF4]; (e) 2.0 wt% [BMP][BF4] + PVCap (1:2). | ||
4. Conclusion
In this work, the inhibitory effect of single [BMP][BF4] and commercial kinetic inhibitor PVCap as well as their mixture on methane hydrate formation was investigated. The kinetic experimental data obtained in a high pressure reactor showed that [BMP][BF4] could significantly inhibit the growth rate of hydrate, but was unable to delay the hydrate nucleation when used alone. Then, the inhibition performance of the compound inhibitors of [BMP][BF4] with PVCap was tested at different concentrations and mass ratios. [BMP][BF4] was found to exhibit excellent synergistic effect in the presence of PVCap on CH4 hydrate. When the mixed inhibitor concentration was 2.0 wt% at a mass ratio 1:2 of [BMP][BF4] to PVCap, the best inhibitory effect was obtained. Microscopic results measured by PXRD and Raman spectrometers revealed that each inhibitor system had no obvious effect on the crystal structure of methane hydrate. Cryo-SEM images indicated that [BMP][BF4] and PVCap systems had distinct effect on the morphology of hydrate. Furthermore, similar to other studies, such as in dye-sensitized solar cells,51 energy storage,52 biomass energy,53 sodium-ion batteries,54 sensors,55 etc, it is necessary to perform a multivariate study in order to obtain the optimum conditions in future work, taking into account all the relevant variables and their interactions and exploring the internal law to strengthen inhibitory ability.
Conflicts of interest
There are no conflicts to declare.Acknowledgements
This work was supported by the National Natural Science Foundation of China (No. 51506202), project of Guangzhou Science and Technology-Pearl River S&T Nova Program of Guangzhou (No. 201806010114), and National Key Research and Development Plan of China (No. 2016YFC0304002).References
- E. D. Sloan Jr and C. A. Koh, Clathrate Hydrates of Natural Gases, CRC Press, 2007 Search PubMed.
- C. Gutt, B. Asmussen, W. Press, M. R. Johnson, Y. P. Handa and J. S. Tse, J. Chem. Phys., 2000, 113, 4713–4721 CrossRef CAS.
- E. D. Sloan, Nature, 2003, 426, 353–359 CrossRef CAS PubMed.
- T. Kuznetsova, A. Sapronova, B. Kvamme, K. Johannsen and J. Haug, in Macromolecular Symposia, Wiley Online Library, 2010, vol. 287, pp. 168–176 Search PubMed.
- M. A. Kelland, Energy Fuels, 2006, 20, 825–847 CrossRef CAS.
- Y. h. Sohn, J. Kim, K. Shin, D. Chang, Y. Seo, Z. M. Aman and E. F. May, Chem. Eng. Sci., 2015, 126, 711–718 CrossRef CAS.
- J. D. Lee and P. Englezos, Chem. Eng. Sci., 2005, 60, 5323–5330 CrossRef CAS.
- A. K. Sum, C. A. Koh and E. D. Sloan, Ind. Eng. Chem. Res., 2009, 48, 7457–7465 CrossRef CAS.
- C. B. Bavoh, B. Partoon, B. Lal and L. Kok Keong, J. Nat. Gas Sci. Eng., 2017, 37, 425–434 CrossRef CAS.
- L. U. Udegbunam, J. R. DuQuesnay, L. Osorio, V. K. Walker and J. G. Beltran, J. Chem. Thermodyn., 2018, 117, 155–163 CrossRef CAS.
- C. B. Bavoh, O. Nashed, M. S. Khan, B. Partoon, B. Lal and A. M. Sharif, J. Chem. Thermodyn., 2018, 117, 48–53 CrossRef CAS.
- J. H. Yang and B. Tohidi, Chem. Eng. Sci., 2011, 66, 278–283 CrossRef CAS.
- V. Thieu and L. M. Frostman, in Proceedings – SPE International Symposium on Oilfield Chemistry, Society of Petroleum Engineers, 2005, pp. 703–709 Search PubMed.
- P. C. Chua and M. A. Kelland, Energy Fuels, 2018, 32, 1674–1684 CrossRef CAS.
- Z. Long, Y. He, X. B. Zhou, D. L. Li and D. Q. Liang, Fluid Phase Equilib., 2017, 439, 1–8 CrossRef CAS.
- M. R. Talaghat, J. Nat. Gas Sci. Eng., 2014, 19, 215–220 CrossRef CAS.
- W. Ke, T. M. Svartaas and H. K. Abay, in ICGH 2011, 2011, vol. 324, pp. 17–21 Search PubMed.
- B. J. Anderson, J. W. Tester, G. P. Borghi and B. L. Trout, J. Am. Chem. Soc., 2005, 127, 17852–17862 CrossRef CAS PubMed.
- W. Ke and M. A. Kelland, Energy Fuels, 2016, 30, 10015–10028 CrossRef CAS.
- D. Lovell, C. Canada and M. Pakulski, in SPE Proceedings – Gas Technology Symposium, Society of Petroleum Engineers, 2002, pp. 309–315 Search PubMed.
- A. Perrin, O. M. Musa and J. W. Steed, Chem. Soc. Rev., 2013, 42, 1996–2015 RSC.
- M. A. Kelland, F. Gausland and K. Tsunashima, Chem. Eng. Sci., 2013, 98, 12–16 CrossRef CAS.
- J. Hu, S. J. Li, Y. H. Wang, X. M. Lang, Q. P. Li and S. S. Fan, J. Nat. Gas Chem., 2012, 21, 126–131 CrossRef CAS.
- P. C. Chua and M. A. Kelland, Energy Fuels, 2013, 27, 1285–1292 CrossRef CAS.
- C. W. Xiao and H. Adidharma, Chem. Eng. Sci., 2009, 64, 1522–1527 CrossRef CAS.
- K. N. Marsh, A. Deev, A. C. T. Wu, E. Tran and A. Klamt, Korean J. Chem. Eng., 2002, 19, 357–362 CrossRef CAS.
- J. P. Hallett and T. Welton, Chem. Rev., 2011, 111, 3508–3576 CrossRef CAS PubMed.
- C. W. Xiao, N. Wibisono and H. Adidharma, Chem. Eng. Sci., 2010, 65, 3080–3087 CrossRef CAS.
- B. Partoon, N. M. S. Wong, K. M. Sabil, K. Nasrifar and M. R. Ahmad, Fluid Phase Equilib., 2013, 337, 26–31 CrossRef CAS.
- X. D. Shen, X. B. Zhou and D. Q. Liang, Energy Fuels, 2019, 33, 1422–1432 CrossRef CAS.
- S. P. Kang, T. Jung and J. W. Lee, Chem. Eng. Sci., 2016, 143, 270–275 CrossRef CAS.
- J. W. Lee, J. Y. Shin, K. S. Kim and S. P. Kang, Energy Fuels, 2016, 30, 9162–9169 CrossRef.
- J. W. Lee, J. Y. Shin, K. S. Kim and S. P. Kang, Energy Fuels, 2016, 30, 3879–3885 CrossRef.
- M. Tariq, D. Rooney, E. Othman, S. Aparicio, M. Atilhan and M. Khraisheh, Ind. Eng. Chem. Res., 2014, 53, 17855–17868 CrossRef CAS.
- X. D. Shen, L. L. Shi, Z. Long, X. B. Zhou and D. Q. Liang, J. Mol. Liq., 2016, 223, 672–677 CrossRef CAS.
- C. Coquelet, A. Chapoy and D. Richon, Int. J. Thermophys., 2004, 25, 133–158 CrossRef CAS.
- D. Y. Peng and D. B. Robinson, Ind. Eng. Chem. Fundam., 1976, 15, 59–64 CrossRef CAS.
- S. Y. Hong, J. Il Lim, J. H. Kim and J. D. Lee, Energy Fuels, 2012, 26, 7045–7050 CrossRef CAS.
- X. B. Zhou, Z. Long, S. Liang, Y. He, L. Z. Yi, D. L. Li and D. Q. Liang, Energy Fuels, 2016, 30, 1279–1286 CAS.
- L. Jensen, K. Thomsen and N. von Solms, Chem. Eng. Sci., 2008, 63, 3069–3080 CrossRef CAS.
- L. Jensen, H. Ramloøv, K. Thomsen and N. Von Solms, Ind. Eng. Chem. Res., 2010, 49, 1486–1492 CrossRef CAS.
- J. F. Xu, L. W. Li, J. X. Liu, X. P. Wang, Y. G. Yan and J. Zhang, Phys. Chem. Chem. Phys., 2018, 20, 8326–8332 RSC.
- S. P. Kang, E. S. Kim, J. Y. Shin, H. T. Kim, J. W. Kang, J. H. Cha and K. S. Kim, RSC Adv., 2013, 3, 19920–19923 RSC.
- Z. Long, X. B. Zhou, D. Q. Liang and D. L. Li, J. Chem. Eng. Data, 2015, 60, 2728–2732 CrossRef CAS.
- J. M. Schicks, M. Luzi and B. Beeskow-Strauch, J. Phys. Chem. A, 2011, 115, 13324–13331 CrossRef CAS PubMed.
- S. Takeya and J. A. Ripmeester, ChemPhysChem, 2010, 11, 70–73 CrossRef CAS PubMed.
- J. A. Ripmeester and C. I. Ratcliffe, J. Phys. Chem., 1988, 92, 337–339 CrossRef CAS.
- J. H. van der Waals and J. C. Platteeuw, Adv. Chem. Phys., 2007, 1–57 Search PubMed.
- H. L. Lu, I. Moudrakovski, M. Riedel, G. Spence, R. Dutrisac, J. Ripmeester, F. Wright and S. Dallimore, J. Geophys. Res.: Solid Earth, 2005, 110, 1–9 CrossRef.
- Q. Zhang, X. D. Shen, X. B. Zhou and D. Q. Liang, Energy Fuels, 2017, 31, 839–846 CrossRef CAS.
- F. Bella, M. Imperiyka and A. Ahmad, J. Photochem. Photobiol., A, 2014, 289, 73–80 CrossRef CAS.
- D. L. Cao, G. Hong and A. T. Le, J. Energy Storage, 2020, 28, 101311 CrossRef.
- A. Narani, P. Coffman, J. Gardner, C. Li, A. E. Ray, D. S. Hartley, A. Stettler, N. V. S. N. M. Konda, B. Simmons, T. R. Pray and D. Tanjore, Bioresour. Technol., 2017, 243, 676–685 CrossRef CAS PubMed.
- F. Bella, A. B. Muñoz-García, F. Colò, G. Meligrana, A. Lamberti, M. Destro, M. Pavone and C. Gerbaldi, ACS Omega, 2018, 3, 8440–8450 CrossRef CAS PubMed.
- B. Miccoli, V. Cauda, A. Bonanno, A. Sanginario, K. Bejtka, F. Bella, M. Fontana and D. Demarchi, Sci. Rep., 2016, 6, 29763 CrossRef CAS PubMed.
| This journal is © The Royal Society of Chemistry 2020 |