 Open Access Article
Conductive polyurethane elastomer electrolyte (PUEE) materials for anodic bonding
Haocheng Zhaoab,
Weixuan Zhangc,
Xu Yina,
Yuling Wu c,
Chao Dua,
Weigang Zhaoa,
Li Zhaoab and
Cuirong Liu*a
aCollege of Materials Science and Engineering, Taiyuan University of Science and Technology, Taiyuan, 030024, China. E-mail: lcr@tyust.edu.cn
bDepartment of Mechanical and Electrical Engineering, Shanxi Institute of Energy, Jinzhong, 030600, China
cKey Laboratory of Interface Science and Engineering in Advanced Materials, Taiyuan University of Technology, Taiyuan, 030024, China
First published on 1st April 2020
Abstract
Polyurethane elastomer electrolyte (PUEE) represents a promising class of polymer solid electrolytes for the preparation and packaging of flexible devices by anodic bonding. In this work, PUEEs were designed and prepared via a pre-polymerization method and cured at room temperature using polypropylene glycol (PPG), toluene-2,4-diisocyanate (TDI) and 1,4-butanediol (BDO) in the presence of varying amounts of lithium bis(trifluoromethanesulphonyl)imide (LiTFSI). All PUEEs exhibited high thermal stability and conductivity, with the highest ionic conductivity of 9.6 × 10⁻⁵ S cm−1 for PUEE6 (n[NHCOO]/Li+ = 1) at 55 °C. The results showed that LiTFSI was dissolved completely in the polyurethane matrix, and the complexing reactions occurred between the lithium ions and the polar groups of polyurethane. After that, the prepared PUEE and the Al sheet were successfully joined by the anodic bonding process. The microstructures of the bonded interface between PUEE and the Al sheet with a clear intermediate bonding layer could be observed in the cross-section scanning electron microscopy (SEM) images, and the elements in each layer were also detected by energy dispersive spectroscopy (EDS), which indicated that the PUEE and the Al sheet were bonded together. The maximum tensile strength for bonded PUEE6/Al was up to 0.45 MPa. All these results demonstrated that the prepared PUEE material would be a promising candidate for the preparation and packaging of flexible devices by anodic bonding.
Introduction
Compared with traditional electronic devices, flexible electronic devices possess the unique characteristics of lightweight, bendability and extensibility and have exhibited great potential in the fields of biomedicine, flexible displays, wearable devices, flexible solar cells, and the like.1–7 Generally, the structure of a flexible device includes a flexible substrate, flexible electrodes, functional materials and the sealing layer.8–12 To achieve high-performance flexible devices, except for the new organic electronic materials, advanced preparation and packaging techniques need to be comprehensively explored. Investigations have shown that packaging quality, one of the key indices of device preparation, directly determines the photoelectric performance, stability and lifetime of the product.13–16 Since its accidental finding in the 1960s by Pomerantz et al.,17 anodic bonding has developed into the most widely used connection method for different kinds of materials in the preparation and packaging of Micro-Electro-Mechanical Systems (MEMS).18–20 Furthermore, it has been recognized as a reliable and easy way to achieve rigid connections between electron-conductive materials and ion-conductive materials, of which the most reported materials are Si or metal bonded to borosilicate glass.21,22 Because of the advantages of no joint filler requirement, low welding residual stress, excellent sealing and high connection strength, the proposed anodic bonding by applying a direct current (DC) potential and high temperature would form an intermediate bonding layer at the interfaces of different kinds of materials by electrochemical processes.The finding of ionic conductivity in polymer solid electrolytes is a breakthrough in the application of polymer materials in anodic bonding.23–25 The earliest known and most widely studied polymer electrolyte matrix, polyethylene oxide (PEO), which was developed by Wright et al.26 in the 1970s, received much attention due to its high dielectric constant and the strong solubility of lithium salts. Generally, compared with other liquid or gel electrolytes, the PEO polymer solid electrolyte shows lower ionic conductivity due to its high crystallinity at room temperature, which is not beneficial to anodic bonding.27,28 Thus, extensive studies were conducted on modifications to improve its ionic conductivity, but made no obvious difference. In addition, owing to the poor water–oxygen barrier property and mechanical performance, the commercial applications of PEO in the preparation and packaging of flexible devices have been extremely limited.29 Fortunately, polyurethane elastomer (PUE) provides an alternative among the polymer solid electrolytes. The favorable mechanical property, high stability and light transmission of PUE are attributed to the unique microphase separation morphology made up of soft segments and hard segments.30 Moreover, the soft segments act as the solvent to solvate the lithium salt, and the hard segments can be functionalized to maintain stable mechanical properties, which ensure that PUEE can be used for the preparation and packaging of flexible devices by anodic bonding successfully. On the other hand, polyether polyols, when chosen as the soft segment, would provide higher flexibility and more free volume for the chain segments, which efficiently promote the dissociation of the salts and increase the mobility of the ions.31 However, there are no reports related to the application of a polyether-based PUEE in anodic bonding.
In this work, a series of ion-conductive PUEEs were prepared by an addition polymerization reaction with certain amounts of toluene-2,4-diisocyanate (TDI), polypropylene glycol (PPG), 1,4-butanediol (BDO) and lithium bis(trifluoromethanesulphonyl)imide (LiTFSI) via the solution casting technique at room temperature. The effects of different amounts of LiTFSI on the anodic bonding properties were investigated. All samples were characterized using Fourier transform infrared (FTIR) spectroscopy, differential scanning calorimetry (DSC), thermogravimetric analysis (TGA), X-ray diffraction (XRD), scanning electron microscopy (SEM) and electrochemical impedance spectroscopy (EIS) measurements. It was demonstrated that the prepared PUEE and Al sheet were successfully joined by the anodic bonding process, and adhesion at the bonded interface, as well as the morphological characteristics of the bonding section, were analyzed.
Experimental section
Chemical and materials
TDI, BDO, LiTFSI and dimethyl carbonate (DMC) were obtained from Energy Chemical (Shanghai, China). PPG (Mn = 2000), dibutyltin dilaurate (DBTL) and Al sheets (purity > 99%, surface roughness < 0.1 μm, thickness = 0.1 mm) were supplied by Sinopharm Chemical Reagent Co., Ltd. All materials were used without further purification.Syntheses and characterization of PUEEs
The PUEEs were synthesized for the preparation and packaging of flexible devices by a pre-polymerization method based on TDI, PPG, BDO and LiTFSI, with a 6.5% content of NCO groups in the prepolymers (NCO% = 6.5). PPG and BDO were dried respectively under reduced pressure (0.092 MPa) at 105 °C for 1 hour to decrease the moisture content below 0.05%. Then, dried PPG was mixed with a certain amount of TDI in a three-necked flask equipped with a magnetic stirrer under a nitrogen atmosphere. The mixture was stirred at 500 rpm at 80 °C for 2 hours and cooled to room temperature naturally. Thereafter, LiTFSI dissolved in DMC at a mass fraction of 48.3% was added into the mixture in portions under a stirring rate of 500 rpm at room temperature for 45 minutes to prepare prepolymers with isocyanate end groups. Subsequently, the prepolymers were blended with a certain amount of BDO, the chain extender, and DBTL, the catalyst. The mixture was rapidly stirred for 3 minutes as the bubbles were removed in a dryer connected to a vacuum pump, and then, cast into Teflon moulds. After 7 days, the sheets of PUEEs were removed from the moulds and used for further characterization.The dosage of LiTFSI was calculated by the molar ratio of urethane groups to lithium ions (n[NHCOO]/Li+) from the following eqn (1), and the composition of samples with different LiTFSI content are shown in Table 1, marked as PUEE0, PUEE1, PUEE2, PUEE3, PUEE4, PUEE5 and PUEE6, respectively.
 | (1) |
| Sample | PUEE0 | PUEE1 | PUEE2 | PUEE3 | PUEE4 | PUEE5 | PUEE6 |
| n[NHCOO]/Li+ | No LiTFSI | 32 | 16 | 8 | 4 | 2 | 1 |
| NCO% | 6.5 | 6.5 | 6.5 | 6.5 | 6.5 | 6.5 | 6.5 |
FTIR spectroscopy of the PUEEs was conducted on a Bruker Tensor 27 FTIR spectrometer to identify the characteristic functional groups in a range of 4000 to 750 cm−1 with a resolution of 2 cm−1. The XRD measurements were obtained on a Bruker X-ray diffractometer and scanned over the diffraction angle range of 5–80° with a scan speed of 5° min−1 at room temperature. SEM images were obtained from a Czech TESCAN LYRA 3 XMH scanning electron microscope. The DSC measurements were recorded using a DSC Q100 V9.4 Build 287 apparatus at both heating and cooling rates of 5°C min−1 under a nitrogen atmosphere. The thermogravimetric analysis (TGA) of the polymers was conducted on a Setaram thermogravimetric analyzer at a heating rate of 10°C min−1 under a nitrogen atmosphere. The mechanical tests were carried out at room temperature using a Universal Testing Machine (MTS Insight 10) with a load cell of 10 kN and pneumatic grips. The ionic conductivity measurements were carried out on an Autolab/PG STAT302 electrochemical workstation in the frequency range of 100 kHz to 0.1 Hz with an amplitude of 10 mV.
The ionic conductivity (σ) of the samples sandwiched between two stainless-steel (SS) blocking electrodes was calculated according to the following eqn (2).32
 | (2) |
Anodic bonding and characterization
The experiments were carried out using anodic bonding equipment, which mainly comprised of a temperature control system (maximum temperature up to 400 °C), a controllable dc power supply (maximum voltage up to 2 kV), a pressure control device, and a data acquisition system. Fig. 1 shows the schematic diagram of anodic bonding. Firstly, PUEE sheets of 3 mm thickness and Al sheets of 0.1 mm thickness were both cut into 20 × 20 mm2 squares. Prior to bonding, the samples were cleaned successively by acetone, absolute alcohol, standard RCA solution (NH4OH![[thin space (1/6-em)]](https://www.rsc.org/images/entities/char_2009.gif) :
:![[thin space (1/6-em)]](https://www.rsc.org/images/entities/char_2009.gif) H2O2
H2O2![[thin space (1/6-em)]](https://www.rsc.org/images/entities/char_2009.gif) :
:![[thin space (1/6-em)]](https://www.rsc.org/images/entities/char_2009.gif) H2O = 0.25
H2O = 0.25![[thin space (1/6-em)]](https://www.rsc.org/images/entities/char_2009.gif) :
:![[thin space (1/6-em)]](https://www.rsc.org/images/entities/char_2009.gif) 1
1![[thin space (1/6-em)]](https://www.rsc.org/images/entities/char_2009.gif) :
:![[thin space (1/6-em)]](https://www.rsc.org/images/entities/char_2009.gif) 5), and deionized water in order to remove the surface impurities and improve surface activity, and then, dried in hot air. The aligned bonding pair was pressed on the bonding platform under 0.2 MPa with the PUEE side connected to the cathode and the Al sheet connected to the anode. In the experiment, the pair was heated up to the pre-set value of 55 °C to bond. When the required temperature was attained, a DC voltage of 700 V was applied between the electrodes.33 The bonding current maximized within seconds and later, dropped to a minimum value, which mean the bonding process was ended.
5), and deionized water in order to remove the surface impurities and improve surface activity, and then, dried in hot air. The aligned bonding pair was pressed on the bonding platform under 0.2 MPa with the PUEE side connected to the cathode and the Al sheet connected to the anode. In the experiment, the pair was heated up to the pre-set value of 55 °C to bond. When the required temperature was attained, a DC voltage of 700 V was applied between the electrodes.33 The bonding current maximized within seconds and later, dropped to a minimum value, which mean the bonding process was ended.
After bonding, morphological analysis of the cross-section of the bonded region was performed on an SEM equipped with an energy-dispersive spectrometer (EDS). Additionally, the tensile strength of the bonded pair was measured to evaluate the bonding strength.
Results and discussion
Structure of PUEE
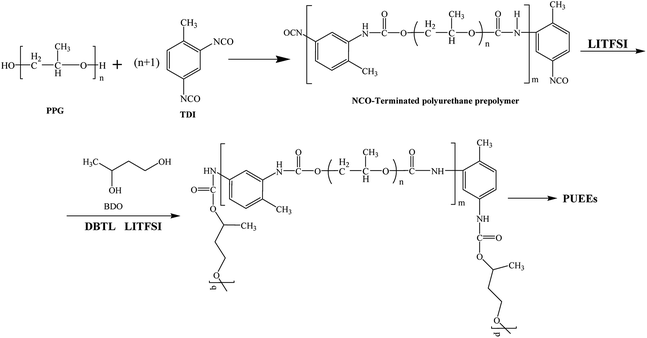
As shown in Scheme 1, a series of PUEEs were synthesized by a pre-polymerization method based on TDI, PPG, BDO and LiTFSI, with an NCO group percentage content of 6.5% in the prepolymers (NCO% = 6.5). To obtain more suitable conductivity, the dosage of LiTFSI was adjusted by the molar ratio of urethane groups to lithium ions (n[NHCOO]/Li+) with the feed ratios of 0, 1, 2, 4, 8, 16, and 32, and the corresponding polymers were named as PUEE0, PUEE1, PUEE2, PUEE3, PUEE4, PUEE5 and PUEE6, respectively.Fig. 2a shows the FTIR spectra of the PUEE0, PUEE1, PUEE2, PUEE3, PUEE4, PUEE5 and PUEE6 samples. The characteristic absorption peaks of polyurethane could be observed at 3500–3200 cm−1 (the stretching vibration of the N–H bond), 3000–2900 cm−1 (asymmetric and symmetric stretching vibrations of the –CH2 and –CH3 groups), 1560–1520 cm−1 (–NH bending vibration), and 1650–1610 cm−1 (stretching band of C![[double bond, length as m-dash]](https://www.rsc.org/images/entities/char_e001.gif) O) in all samples. Furthermore, the peaks at 1150–1060 cm−1 were ascribed to the stretching vibration of the C–O–C bond, which is characteristic of PPG in the soft segments.34,35 These absorption peaks of the major functional groups indicated that the polyether-based PUEE matrices had been synthesized successfully. For the polymer PUEEs, the characteristic absorption peak of O–Li could be observed at around 623 cm−1. Furthermore, the N–H peak at 3500–3200 cm−1 shifted to higher wavenumbers along with increasing intensity with increasing content of LiTFSI, which was because more free N–H bonds were released with the reduction in the ratio of hydrogen bonding between N–H and C
O) in all samples. Furthermore, the peaks at 1150–1060 cm−1 were ascribed to the stretching vibration of the C–O–C bond, which is characteristic of PPG in the soft segments.34,35 These absorption peaks of the major functional groups indicated that the polyether-based PUEE matrices had been synthesized successfully. For the polymer PUEEs, the characteristic absorption peak of O–Li could be observed at around 623 cm−1. Furthermore, the N–H peak at 3500–3200 cm−1 shifted to higher wavenumbers along with increasing intensity with increasing content of LiTFSI, which was because more free N–H bonds were released with the reduction in the ratio of hydrogen bonding between N–H and C![[double bond, length as m-dash]](https://www.rsc.org/images/entities/char_e001.gif) O in the urethane group due to complex formation as the number of lithium ions increased. Meanwhile, the stretching vibration peaks of C–O–C and C
O in the urethane group due to complex formation as the number of lithium ions increased. Meanwhile, the stretching vibration peaks of C–O–C and C![[double bond, length as m-dash]](https://www.rsc.org/images/entities/char_e001.gif) O slightly shifted to lower wavenumbers as the amount of LiTFSI increased, which indicated that the lithium ions were coordinated with C
O slightly shifted to lower wavenumbers as the amount of LiTFSI increased, which indicated that the lithium ions were coordinated with C![[double bond, length as m-dash]](https://www.rsc.org/images/entities/char_e001.gif) O, and the electron density of the oxygen atoms of C–O–C decreased. The results indicated that the polar groups in polyurethane, such as C
O, and the electron density of the oxygen atoms of C–O–C decreased. The results indicated that the polar groups in polyurethane, such as C![[double bond, length as m-dash]](https://www.rsc.org/images/entities/char_e001.gif) O and C–O–C, which have a strong capability for coordination with metallic ions, made LiTFSI dissolve better. All of the results above suggested that the lithium salts dissolved in the polyether-based polyurethane matrix and coordinated with the polar groups.
O and C–O–C, which have a strong capability for coordination with metallic ions, made LiTFSI dissolve better. All of the results above suggested that the lithium salts dissolved in the polyether-based polyurethane matrix and coordinated with the polar groups.
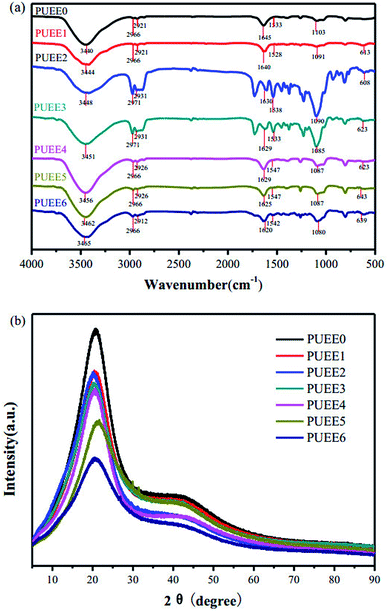 | ||
| Fig. 2 (a) FTIR spectra and (b) XRD patterns of PUEE0 and other PUEEs with varying amounts of LiTFSI. | ||
The soft and hard segments in their phase regions may be arranged randomly, orderly or as a combination of both, and the morphology may be diverse and complicated. The crystallization property of polyurethane has a direct influence on the degree of microphase separation, which may change the overall performance of the PUEEs. Therefore, it is of great significance to study the crystallization behavior of the PUEEs to understand the relationship between their structure and properties. As seen in Fig. 2b, all samples showed similar XRD curves with the diffraction peaks of the approximate amorphous form at around 2θ = 20°, which was ascribed to the partially ordered crystalline phase presented in the random amorphous regions. The XRD patterns indicated that the synthesized PUEEs had an amorphous structure that facilitated the lithium ions to migrate. In addition, there was no obvious diffraction peak for the lithium salts in the XRD patterns, implying that LiTFSI was completely dissolved in the polyurethane matrices.
The surface morphology of the PUEEs was studied based on the SEM images presented in Fig. 3. In all samples, there was no obvious formation of lithium salt clusters, showing that LiTFSI was completely distributed into the polyurethane matrices. As seen in Fig. 3(a) and (b), microscopic phase separation structures caused by the thermodynamic incompatibility of the hard and soft segments could be observed obviously. The soft segments constituted the continuous phase, while the hard segments constituted the dispersed phase. In Fig. 3(c)–(e), upon increasing the content of DMC, a solvent that has good compatibility with LiTFSI, the degree of microscopic phase separation reduced obviously, indicating that the compatibility between the soft and hard segments had improved effectively. It is noteworthy that under a high LiTFSI content condition, ionic conduction channels could be observed in the phase interface regions (Fig. 3f), along which dissociated lithium ions might migrate, thereby achieving ionic conduction.
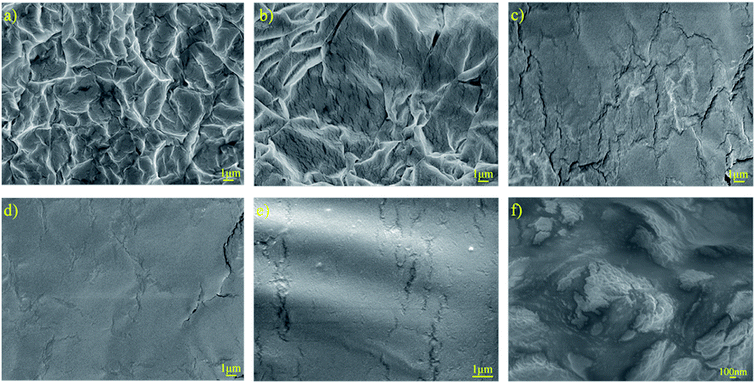 | ||
| Fig. 3 SEM images of the surfaces of (a) PUEE1, (b) PUEE2, (c) PUEE3, (d) PUEE4, (e) PUEE5 and (f) PUEE6. | ||
Thermal and ionic conductivity properties of PUEEs
The thermal properties of the PUEEs were characterized by DSC and TGA, and the results are summarized in Fig. 4 and Table 2. The decomposition temperatures (Td, measured at a 5% weight loss) of the PUEEs were around 260 °C, which fulfills the temperature requirement of anodic bonding operations (50–80 °C). As the coordination of lithium ions with polar groups might weaken the hydrogen bonding interactions in the hard segments, they might be thermally decomposed first upon heating, and the Td of the PUEEs decreased with an increase in the LiTFSI content.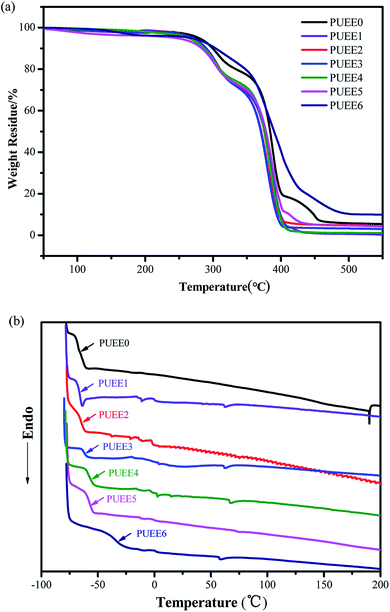 | ||
| Fig. 4 (a) TGA and (b) DSC curves of the PUEEs in a nitrogen atmosphere at the heating rates of 10°C min−1 and 5°C min−1, respectively. | ||
| Sample | Tg (°C) | Td (°C) | Room temperature | 55 °C | ||
|---|---|---|---|---|---|---|
| Bulk resistancea (Ω) | Ionic conductivity (S cm−1) | Bulk resistancea (Ω) | Ionic conductivity (S cm−1) | |||
| a The thickness of the PUEE sheets was 0.3 cm, and the area of the electrode was 3 cm2. | ||||||
| PUEE0 | −66.51 | 277 | — | — | — | — |
| PUEE1 | −65.36 | 273 | 3![[thin space (1/6-em)]](https://www.rsc.org/images/entities/char_2009.gif) 743 743![[thin space (1/6-em)]](https://www.rsc.org/images/entities/char_2009.gif) 729 729 |
2.7 × 10⁻⁸ | 4308 | 2.3 × 10⁻⁵ |
| PUEE2 | −64.51 | 269 | 1![[thin space (1/6-em)]](https://www.rsc.org/images/entities/char_2009.gif) 670 670![[thin space (1/6-em)]](https://www.rsc.org/images/entities/char_2009.gif) 150 150 |
6.0 × 10⁻⁸ | 3222 | 3.1 × 10⁻⁵ |
| PUEE3 | −62.13 | 268 | 666![[thin space (1/6-em)]](https://www.rsc.org/images/entities/char_2009.gif) 806 806 |
1.5 × 10⁻⁷ | 2725 | 3.7 × 10⁻⁵ |
| PUEE4 | −59.17 | 262 | 322![[thin space (1/6-em)]](https://www.rsc.org/images/entities/char_2009.gif) 140 140 |
3.1 × 10⁻⁷ | 1906 | 5.2 × 10⁻⁵ |
| PUEE5 | −57.19 | 247 | 297![[thin space (1/6-em)]](https://www.rsc.org/images/entities/char_2009.gif) 804 804 |
3.3 × 10⁻⁷ | 1738 | 5.8 × 10⁻⁵ |
| PUEE6 | −34.35 | 266 | 123![[thin space (1/6-em)]](https://www.rsc.org/images/entities/char_2009.gif) 186 186 |
8.1 × 10⁻⁷ | 1044 | 9.6 × 10⁻⁵ |
Except for PUEE6, all the samples showed a glass transition temperature (Tg) around −60 °C, indicating that the ether bonds in PPG that form the soft segments of the PUEEs had low cohesive energy and were easy to rotate, leading to good flexibility and segment compatibility. A slightly increasing trend was found in the Tg values along with the amount of LiTFSI (PUEE0 to PUEE6). It might be because a cluster of free lithium ions coordinated with urethane groups and ether oxygen groups form lots of cross-linking points. The cross-linking structures might limit the movement of the soft and hard segments, which could lead to the increased values of Tg.
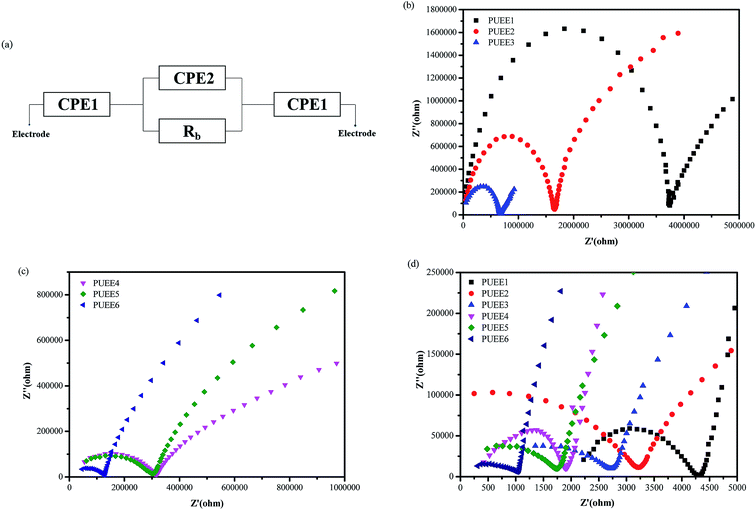
Fig. 5(a) shows the equivalent circuit of the test cell with blocking electrodes that use constant phase elements (CPE) in place of capacitance. In the equivalent circuit, CPE1, CPE2 and Rb represent the sum of the capacitive effect of the uneven contact interface and the impedance of interface ion diffusion, the sum of the Faraday capacitance of the SPE membrane and the ion transfer impedance within the membrane, and the body resistance of SPE, respectively. The ionic conductivities of the PUEEs at room temperature and 55 °C (anode bonding temperature) were investigated by electrochemical impedance spectroscopy (EIS), and the results are shown in Fig. 5(b–d) and Table 2. It was obviously observed that the ionic conductivity increased with increasing LiTFSI content. The highest ionic conductivity at room temperature for PUEE6 was 8.1 × 10⁻⁷ S cm−1, and the highest ionic conductivity of 9.6 × 10⁻⁵ S cm−1 at 55 °C required for anodic bonding was achieved with the maximum LiTFSI content (PUEE6), which is higher than those of other linear polymers, such as PEO-based electrolytes. It was found that the ionic conductivity depended on the effective number of lithium ions, which is related to the concentration of dissolved ions and ionic mobility. The rise in conductivity with higher loadings of salts could be explained by the increase in the concentration of lithium ions due to LiTFSI dissociation and the increased number of carriers in the system. In addition, with the addition of lithium salts, the proportion of the amorphous phase in the polyurethane matrix could be increased, which is also beneficial for the transport of lithium ions. This result is consistent with the XRD analysis. Meanwhile, the increased amount of DMC solvent to dissolve LiTFSI could aggrandize the free volume of the polymer segments and enhance the flexibility of the segments, which can also increase the dissociation rate of lithium ions.
Mechanical properties of PUEEs
The mechanical properties of packaging materials are critical intrinsic factors, which influence the safe use of a flexible electronic device. The mechanical properties of the prepared PUEEs are shown in Table 3. It was found that with increasing LiTFSI content, the hardness, tensile strength and tear strength of the PUEEs decreased, while the elongation at break increased. In PUEEs with added LiTFSI, the hydrogen bond interactions between –NH and C![[double bond, length as m-dash]](https://www.rsc.org/images/entities/char_e001.gif) O were weakened due to the coordination interaction between the lithium ions and C
O were weakened due to the coordination interaction between the lithium ions and C![[double bond, length as m-dash]](https://www.rsc.org/images/entities/char_e001.gif) O, which destroyed the physical cross-linking network formed by the hydrogen bonds. On the other hand, the DMC content synchronously increased. This polar organic solvent that dissolves the lithium salt easily associates with OH groups to form hydrogen bonds, which can decrease the reactivity of the OH and NCO groups and inhibit the synthesis of carbamate groups. Therefore, the hardness and strength of the samples reduced. As mentioned in the SEM analysis above, with an increase in the lithium salt, the compatibility of the soft and hard segments of the polyurethane matrix was enhanced, and more hard segments were dissolved in the soft segments. Since the elongation at break and elasticity are provided by the soft segments, the elongation at break increased.
O, which destroyed the physical cross-linking network formed by the hydrogen bonds. On the other hand, the DMC content synchronously increased. This polar organic solvent that dissolves the lithium salt easily associates with OH groups to form hydrogen bonds, which can decrease the reactivity of the OH and NCO groups and inhibit the synthesis of carbamate groups. Therefore, the hardness and strength of the samples reduced. As mentioned in the SEM analysis above, with an increase in the lithium salt, the compatibility of the soft and hard segments of the polyurethane matrix was enhanced, and more hard segments were dissolved in the soft segments. Since the elongation at break and elasticity are provided by the soft segments, the elongation at break increased.
| Sample | n[NHCOO]/Li+ | Shore A hardness | Tensile strength (MPa) | Tear strength (MPa) | Elongation at break (%) |
|---|---|---|---|---|---|
| PUEE1 | 32 | 38 | 7.4 | 28.3 | 386 |
| PUEE2 | 16 | 32 | 6.1 | 24.6 | 401 |
| PUEE3 | 8 | 29 | 5.7 | 20.5 | 393 |
| PUEE4 | 4 | 22 | 5.3 | 18.4 | 425 |
| PUEE5 | 2 | 20 | 4.8 | 13.5 | 431 |
| PUEE6 | 1 | 19 | 4.3 | 11.8 | 443 |
Connection performance of PUEEs/Al by anodic bonding
Fig. 6 shows the cross-section SEM images of the bonded interfaces between the Al sheet and PUEEs bonded at 55 °C/700 V. It could be seen that the two sides were bonded together effectively with no obvious defects or cracks along the bonded interfaces. In the bonding regions between the Al sheet and PUEEs, a clear intermediate bonding layer with a thickness of about 35–60 μm and shaped like a black ribbon could be observed, which are shown in Fig. 6(a)–(f). With an increase in the content of LiTFSI, the thickness of the intermediate bonding layer also increased (Fig. 6(a)–(f)), which revealed that the generation of the bonding layer is the main reason for the connection formed by anodic bonding.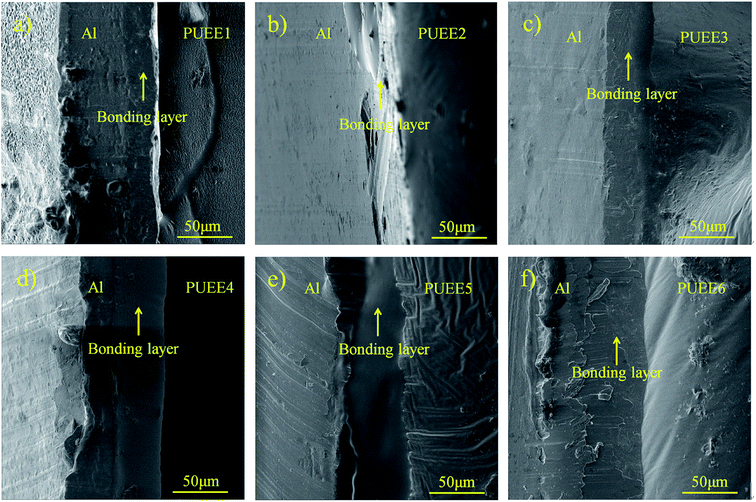 | ||
| Fig. 6 Cross-section SEM images of the bonded interfaces between the Al sheet and (a) PUEE1, (b) PUEE2, (c) PUEE3, (d) PUEE4, (e) PUEE5 and (f) PUEE6. | ||
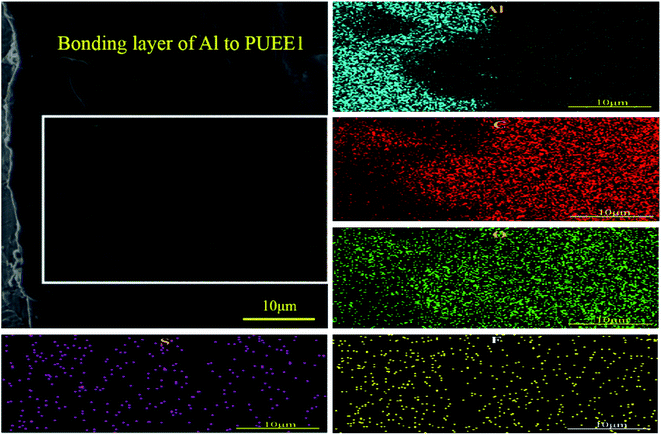
EDS mapping was performed at the bonded interface of the Al sheet and PUEE1. As shown in Fig. 7, the gradient distribution of different elements, including C, O, S, F and Al, was clearly identified in the intermediate bonding layer, showing that the process was accompanied by the directional migration of ions due to a certain temperature and electric fields. Owing to the migration of the ions, a lot of ionic vacancies could be left in the depletion layer, which can also be interpreted as a zone of negative ion accumulation, and the width of the depletion layer would increase gradually. In addition, the applied electric field was concentrated on the depletion layer, bringing the two bonding materials in close contact. Then, the bonding process tended to end with the formation of a new connection layer, followed by the termination of the ion migration. It could be seen that some of the Al ions from the anode had entered the PUEE1 side, which had a lot of ionic vacancies. Then, the O, C, S and F elements in the depletion layer would move into the Al side under the action of the electric field and thermal field, followed by reactions with Al to generate new substances at the interface, thereby realizing the permanent connection between the Al sheet and PUEE1. Therefore, it is possible that the interdiffusion of positive and negative ions might be the basic condition for achieving interfacial chemical bonding.
The peak current during the anodic bonding process, the interfacial connection strength and the reliability of PUEE/Al were analyzed by testing the tensile strength, and the results are shown in Table 4. As a macroscopic manifestation of ion migration, the bonding current reflects the microscopic process of anodic bonding. Under the combined action of the thermal field, electric field and pressure field, micro-peristalsis occurred at the interfaces, accompanied by the breaking and bonding of chemical bonds and the diffusion of elements, which facilitated the permanent connection of PUEE with the Al sheet. The value of the peak current increased gradually with the content of LiTFSI, which could be explained by the movement of the gradually increasing lithium ions towards the cathode under the action of the electric field during anodic bonding. Meanwhile, the ion depletion layers near the bonding interface were formed by continuous ion migration towards the cathode. As the width of the depletion layers reached the maximum, an equilibrium potential was established between the internal and external electric fields along with the close contact of PUEE and the Al sheet at the bonding interface due to the electric field force. Later, the current value gradually returned to the minimum value, and the chemical bonds were formed at the interface of PUEE and the Al sheet.
| Sample | Peak current (mA) | Maximum load (N) | Cross-sectional area (mm2) | Tensile strength (MPa) |
|---|---|---|---|---|
| PUEE1/Al | 1.9 | 15.75 | 50.24 | 0.31 |
| PUEE2/Al | 2.7 | 15.91 | 50.24 | 0.32 |
| PUEE3/Al | 5 | 17.77 | 50.24 | 0.35 |
| PUEE4/Al | 6.5 | 19.53 | 50.24 | 0.39 |
| PUEE5/Al | 7.3 | 20.01 | 50.24 | 0.40 |
| PUEE6/Al | 9.4 | 22.60 | 50.24 | 0.45 |
After bonding, the bonded samples were diced into squares with dimensions of 8 mm × 8 mm. Then, the PUEE surface and the Al surface were cleaned with acetone to remove the grease. The two sides of the testing sample were adhered to two extension rods by epoxy glue, respectively. After curing, the two extension rods adhered to the PUEE side and the Al side were fixed to the fixtures of the tensile strength testing machine, as shown in Fig. 8. The tensile strength value increased as the content of LiTFSI increased at a certain electric field and bonding temperature, and the maximum value for PUEE6 was 0.45 MPa. This result suggested that the thickness of the intermediate bonding layer, which was affected by the peak current of anodic bonding, directly determined the tensile strength of the connecting layer, which could be correlated with the content of lithium salts in the polyurethane matrix.
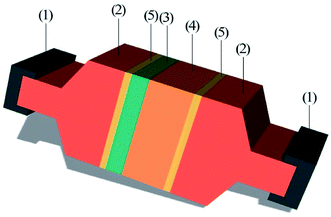 | ||
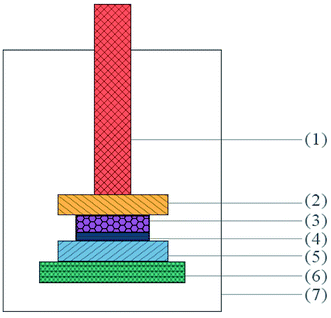
| Fig. 8 Schematic diagram of the bonded sample prepared for tensile test: (1) fixtures, (2) extension rods, (3) Al sheet, (4) PUEE sheet, and (5) epoxy glue. | ||
Conclusion
In this study, PUEEs with different lithium content were prepared and characterized for anodic bonding, and the anode bonding connection was successfully demonstrated between the PUEE sheet and the Al sheet. Among all the samples, the highest ionic conductivity at 55 °C was 9.6 × 10⁻⁵ S cm−1 for PUEE6. FTIR spectroscopy analyses confirmed the coordination interaction between the polar groups of polyurethane and the dissociated lithium ions. The XRD patterns showed an amorphous structure in PUEEs matrix that can facilitate the lithium ion to migrate. DSC and TGA analyses revealed that the PUEEs possessed good chain flexibility and heat stability. All of the properties indicate the promising potential of the PUEEs in anodic bonding applications. Furthermore, the cross-section SEM images of anodic-bonded PUEE/Al showed that the two sides were bonded together effectively, and different types of element transitions were observed by EDS mapping at the interfacial site. The new substances in the bonding layer were formed by physical and chemical reactions. These results were supported by the tensile strength test results of the interfacial layer, which showed the highest value of 0.45 MPa. Given the preliminary results obtained from this study, this new class of PUEEs prepared that are applied to anodic bonding may have other potentials that may be useful in the preparation and packaging of flexible devices.Conflicts of interest
The authors declare no competing financial interest.Acknowledgements
The authors are grateful to the “the National Natural Science Foundation of China (51875384, 61705158), Shanxi Province Natural Science Foundation (201801D221102, 201801D121085); and Scientific and Technological Innovation Programs of Higher Education Institutions in Shanxi (201802111, 2019L0302)”.References
- M. S. Su'ait, A. Ahmad, K. H. Badri, N. S. Mohamed, M. Y. A. Rahman, C. L. Azanza Ricardo and P. Scardi, Int. J. Hydrogen Energy, 2014, 29, 3005–3017, DOI:10.1016/j.ijhydene.2013.08.117.
- S. Mundinamani, Int. J. Hydrogen Energy, 2019, 44, 11240–11246, DOI:10.1016/j.ijhydene.2019.02.164.
- R. M. Huzaizi, S. M. Tahir and K. M. Mahbor, AIP Conf. Proc., 2017, 1901, 090002, DOI:10.1063/1.5010520.
- F. N. Daud, A. Ahmad and K. H. Badri, Int. J. Polym. Sci., 2014, 326716, 1–5, DOI:10.1155/2014/326716.
- J. J. Bao, X. B. Qu, G. Q. Qi, Q. K. Huang, S. F. Wu, C. Tao, M. H. Gao and C. H. Chen, Solid State Ionics, 2018, 320, 55–63, DOI:10.1016/j.ssi.2018.02.030.
- Y. L. Wu, X. F. Li, H. C. Zhao, J. Li, Y. Q. Miao, H. Wang, F. R. Zhu and B. S. Xu, Org. Electron., 2020, 76, 105487, DOI:10.1016/j.orgel.2019.105487.
- C. H. Jee, K. S. Kang, J. H. Bae, H. J. Jung, J. Y. Yang and P. H. Huh, Polym.-Plast. Technol. Eng., 2018, 57, 1518–1523, DOI:10.1080/03602559.2017.1370100.
- P. Tao, Y. Q. Miao, H. Wang, B. S. Xu and Q. Zhao, Chem. Rec., 2019, 19, 1531–1561, DOI:10.1002/tcr.201800139.
- Y. Q. Miao, K. X. Wang, B. Zhao, L. Gao, P. Tao, X. G. Liu, Y. Y. Hao, H. Wang, B. S. Xu and F. R. Zhu, Nanophotonics, 2018, 7, 295–304, DOI:10.1515/nanoph-2017-0021.
- W. B. Kong, Y. Lei, Y. Yuan, C. L. Zhou and J. X. Lei, Macromol. Res., 2017, 25, 864–870, DOI:10.1007/s13233-017-5094-9.
- L. Porcarelli, K. Manojkumar, H. Sardon, O. Llorente, A. S. Shaplov, K. Vijayakrishna, C. Gerbaldi and D. Mecerreyes, Electrochim. Acta, 2017, 241, 526–534, DOI:10.1016/j.electacta.2017.04.132.
- M. Rayung, M. M. Aung, A. Ahmad, M. S. Su'ait, L. C. Abdullah and S. N. A. M. Jamil, Mater. Chem. Phys., 2019, 222, 110–117, DOI:10.1016/j.matchemphys.2018.10.009.
- L. Tan, Y. Y. Deng, Q. Cao, B. Jing, X. Y. Wang and Y. W. Liu, Ionics, 2019, 25, 3673–3682, DOI:10.1007/s11581-019-02940-7.
- O. V. Yarmolenko, A. V. Yudina and K. G. Khatmullina, Russ. J. Electrochem., 2018, 54, 325–343, DOI:10.1134/S1023193518040092.
- P. F. Lv, J. Yang, G. B. Liu, H. Liu, S. M. Li, C. Y. Tang, J. Mei, Y. T. Li and D. Hui, Composites, Part B, 2017, 120, 35–41, DOI:10.1016/j.compositesb.2017.03.060.
- P. Kopczynska, T. Calvo-Correas, A. Eceiza and J. Datta, Eur. Polym. J., 2016, 85, 26–37, DOI:10.1016/j.eurpolymj.2016.09.063.
- G. Wallis and D. I. Pomerantz, Field assisted glass-metal sealing, J. Appl. Phys., 1969, 40, 3946–3949, DOI:10.1063/1.1657121.
- C. Du, C. R. Liu and X. Yin, J. Inorg. Organomet. Polym., 2017, 27, 1521–1525, DOI:10.1007/s10904-017-0612-y.
- K. Mahmood, K. M. Zia, W. Aftab, M. Zuber, S. Tabasum, A. Noreen and F. Zia, Int. J. Biol. Macromol., 2018, 113, 150–158, DOI:10.1016/j.ijbiomac.2018.01.031.
- S. Oprea, V. O. Potolinca and V. Oprea, Eur. Polym. J., 2016, 83, 161–172, DOI:10.1016/j.eurpolymj.2016.08.020.
- C. Du, C. R. Liu and X. Yin, J. Inorg. Organomet. Polym., 2018, 28, 146–151, DOI:10.1007/s10904-017-0658-x.
- H. L. Wang, J. T. Yu, H. G. Fang, H. B. Wei, X. H. Wang and Y. S. Ding, Polymer, 2018, 137, 1–12, DOI:10.1016/j.polymer.2017.12.067.
- S. Xiao, M. M. Hossain, P. Liu, H. L. Wang, F. C. Hu and H. J. Sue, Mater Des, 2017, 132, 419–429, DOI:10.1016/j.matdes.2017.07.016.
- W. H. Chen, V. Depauw, F. Haddad, J. L. Maurice and P. R. Cabarrocas, Sol. Energy Mater. Sol. Cells, 2016, 157, 154–160, DOI:10.1016/j.solmat.2016.05.031.
- L. F. Hu, Y. Z. Xue and H. Wang, J. Alloys Compd., 2019, 789, 558–566, DOI:10.1016/j.jallcom.2019.02.257.
- D. Fenton, J. Parker and P. Wright, Polymer, 1973, 14, 589, DOI:10.1016/0032-3861(73)90146-8.
- R. G. Aditi, Microsyst. Technol., 2017, 23, 81–90, DOI:10.1007/s00542-016-2812-8.
- R. Joyce, M. George, L. Bhanuprakash, D. K. Panwar, R. R. Bhatia, S. Varghese and J. Akhtar, J. Mater. Sci.: Mater. Electron., 2018, 29, 217–231, DOI:10.1007/s10854-017-7908-0.
- P. Knapkiewicz, Semicond. Sci. Technol., 2019, 34, 035005, DOI:10.1088/1361-6641/aafecc.
- C. Du, C. R. Liu, X. Yin and H. C. Zhao, J. Inorg. Organomet. Polym., 2018, 28, 746–750, DOI:10.1007/s10904-017-0713-7.
- E. M. Szesz and C. M. Lepienski, J. Non-Cryst. Solids, 2017, 471, 19–27, DOI:10.1016/j.jnoncrysol.2017.04.038.
- S. Tanaka, Microelectron. Reliab., 2014, 54, 875–881, DOI:10.1016/j.microrel.2014.02.001.
- J. L. Tang, C. Cai, X. X. Ming, X. H. Yu, S. L. Zhao, S. T. Tu and H. L. Liu, Appl. Surf. Sci., 2016, 387, 139–148, DOI:10.1016/j.apsusc.2016.06.076.
- S. Woetzel, A. Ihring, E. Kessler, D. Franke, J. Dellith, A. Brown, F. Hänschke, H. G. Meyer and H. Schmidt, J. Micromech. Microeng., 2018, 28, 7, DOI:10.1088/1361-6439/aab86f.
- P. F. Cao, B. R. Li, T. Hong, J. Townsend, Z. Qiang, K. Y. Xing, K. D. Vogiatzis, Y. Y. Wang, J. W. Mays, A. P. Sokolov and T. Saito, Adv. Funct. Mater., 2018, 28, 1800741, DOI:10.1002/adfm.201800741.
| This journal is © The Royal Society of Chemistry 2020 |

