
 Open Access Article
 This Open Access Article is licensed under a Creative Commons Attribution-Non Commercial 3.0 Unported Licence
Unprecedented surface stabilized InP quantum dots with bidentate ligands†
Haewoon Seo a,
Meehee Bangb,
Yongjin Kima,
Chaeyeon Sona,
Heung Bae Jeon*b and
Sang-Wook Kim*a
a,
Meehee Bangb,
Yongjin Kima,
Chaeyeon Sona,
Heung Bae Jeon*b and
Sang-Wook Kim*a
aDepartment of Molecular Science and Technology, Ajou University, Suwon 443-749, Korea. E-mail: swkim@ajou.ac.kr
bDepartment of Chemistry, Kwangwoon University, Seoul, 01897, Republic of Korea
First published on 23rd March 2020
Abstract
For InP-based QDs, the current technology does not outperform CdSe-based QDs in many respects, one of which is stability. The optical stability of QDs is closely related to their surface properties, so QDs often use organic ligands for surface protection. These organic ligands are dynamically attached and detached on the QD surface; during detachment, their surfaces are easily damaged and oxidized, thereby deteriorating their optical characteristics. Therefore, we have synthesized a ligand 1,2-hexadecanedithiol with a bidentate form, inducing one ligand to bind to the QD surface strongly through the chelate effect, as a good way to improve the stability of the QDs; thus, the PL stability of the green-light-emitting InP-based QDs was greatly increased. To confirm the existence of the dithiol ligand, we used thermogravimetric analysis/simultaneous thermal analysis-mass spectroscopy (TGA/STA-MS). After that, we applied the ligand to blue-light-emitting ZnSe QDs and red-light-emitting InP QDs, and for those two types of QD we also confirmed that the stability was increased. Additionally, we tested dithiol exchanged QDs at a high temperature of 150 °C, and the increase of stability was effective even in a high temperature condition.
Introduction
Semiconductor nanocrystals, commonly known as quantum dots (QDs), have attracted a great deal of attention due to their unique optical properties, which appear via the quantum confinement effect. Since the synthesis of CdSe QDs for the first time through the colloidal synthesis method in 1993,1 many improvements have been made, and CdSe has been studied for many applications, such as LED production,2–6 photodetection,7–9 energy harvesting,10–13 and biomarker14–16 identification. However, due to the toxicity of cadmium, CdSe is regulated for use in Europe, and as a solution, InP QDs, which are Cd free and have high-quality optical properties in the visible region, are receiving an increasing amount of attention. Thus far, compared to CdSe, InP has many limitations with regards to various aspects, for example, wide emission spectral line-width, and low QY and stability; a large amount of research has been done to address these problems. As a result, some characteristics of InP have improved significantly,17–19 while some still need to be improved. Nevertheless, there are still problems associated with replicating the characteristics of CdSe. Among these characteristics, the most notable feature of InP-based QDs is their stability. Generally, the long-term stability of QDs is directly related to the reliability of the device,20,21 which is essential for the performance of the device. Recently, stability studies on InP-based QDs with narrow and high QY values were performed under room temperature and high temperature conditions; however, their stability was found to be very poor compared to CdSe. (The most notable recent result of stability is maintaining QY for about 15 days from ambient.)22 The optical stability of QDs is closely related to their surface properties.23–25 To prevent the agglomeration of nano-sized QDs, their surface is protected by organic ligands, which consist of hydrophilic head groups, such as carboxyl,26 thiol,27 and amine28 groups, and tail groups with long carbon chains (carbon 14–18). These ligands have been used for synthesizing various QDs since the synthesis of CdSe colloidal QDs. They play a key role in the nucleation and growth control, size, shape, composition and morphology of QDs during their synthesis,29–34 and serve as surfactants to enhance the solubility of QDs in non-polar solvents. These organic ligands are dynamically attached and detached on the QD surface; during detachment, their surfaces are easily damaged and oxidized, thereby deteriorating their optical characteristics. This problem can be solved by using a large number of ligands, but too many organic ligands degrade the quality of the device. Therefore, we think that the use of a ligand capable of binding more strongly to the surface of the QD would be a good way to improve the stability of the QDs. We have synthesized a ligand with a bidentate form, inducing one ligand to bind to the QD surface strongly through the chelate effect.35–38 Even if one end of the bidentate is detached from the surface, the other end remains attached, and the ligand is present on the surface; the probability that both the ends detached are is low, and these types of surfactants are likely to contribute to the stability of the QDs. We prepared the dithiol ligand with the hexadecyl group and performed ligand exchange after QD synthesis. InP-based core/shell QDs with dithiol chelate ligands showed a highly improved stability, compared to pristine QDs. The effects are verified in green- and red-light-emitting InP-based QDs as well as in blue-light-emitting ZnSe-based QDs. The tests were performed at ambient and high temperature conditions. The existence of the dithiol ligand was analyzed by thermogravimetric analysis/simultaneous thermal analysis-mass spectroscopy (TGA/STA-MS).Result and discussion
We synthesized three types of bidentate surfactants, 2-dodecylmalonic acid (–COOH), 1,2-hexadecanediamine (–NH2), and 1,2-hexadecanedithiol (–SH), and then investigated the QD stability after surfactant exchange. Unfortunately, diacid and diamine structures were not effective, because of the thiolate groups have high affinity toward the surface of QDs.39 1,2-Hexadecanedithiol was synthesized from 1,2-hexadecanediol via several reaction steps, which has been reported in a previous study and described in detail in the Experimental section and Scheme 1.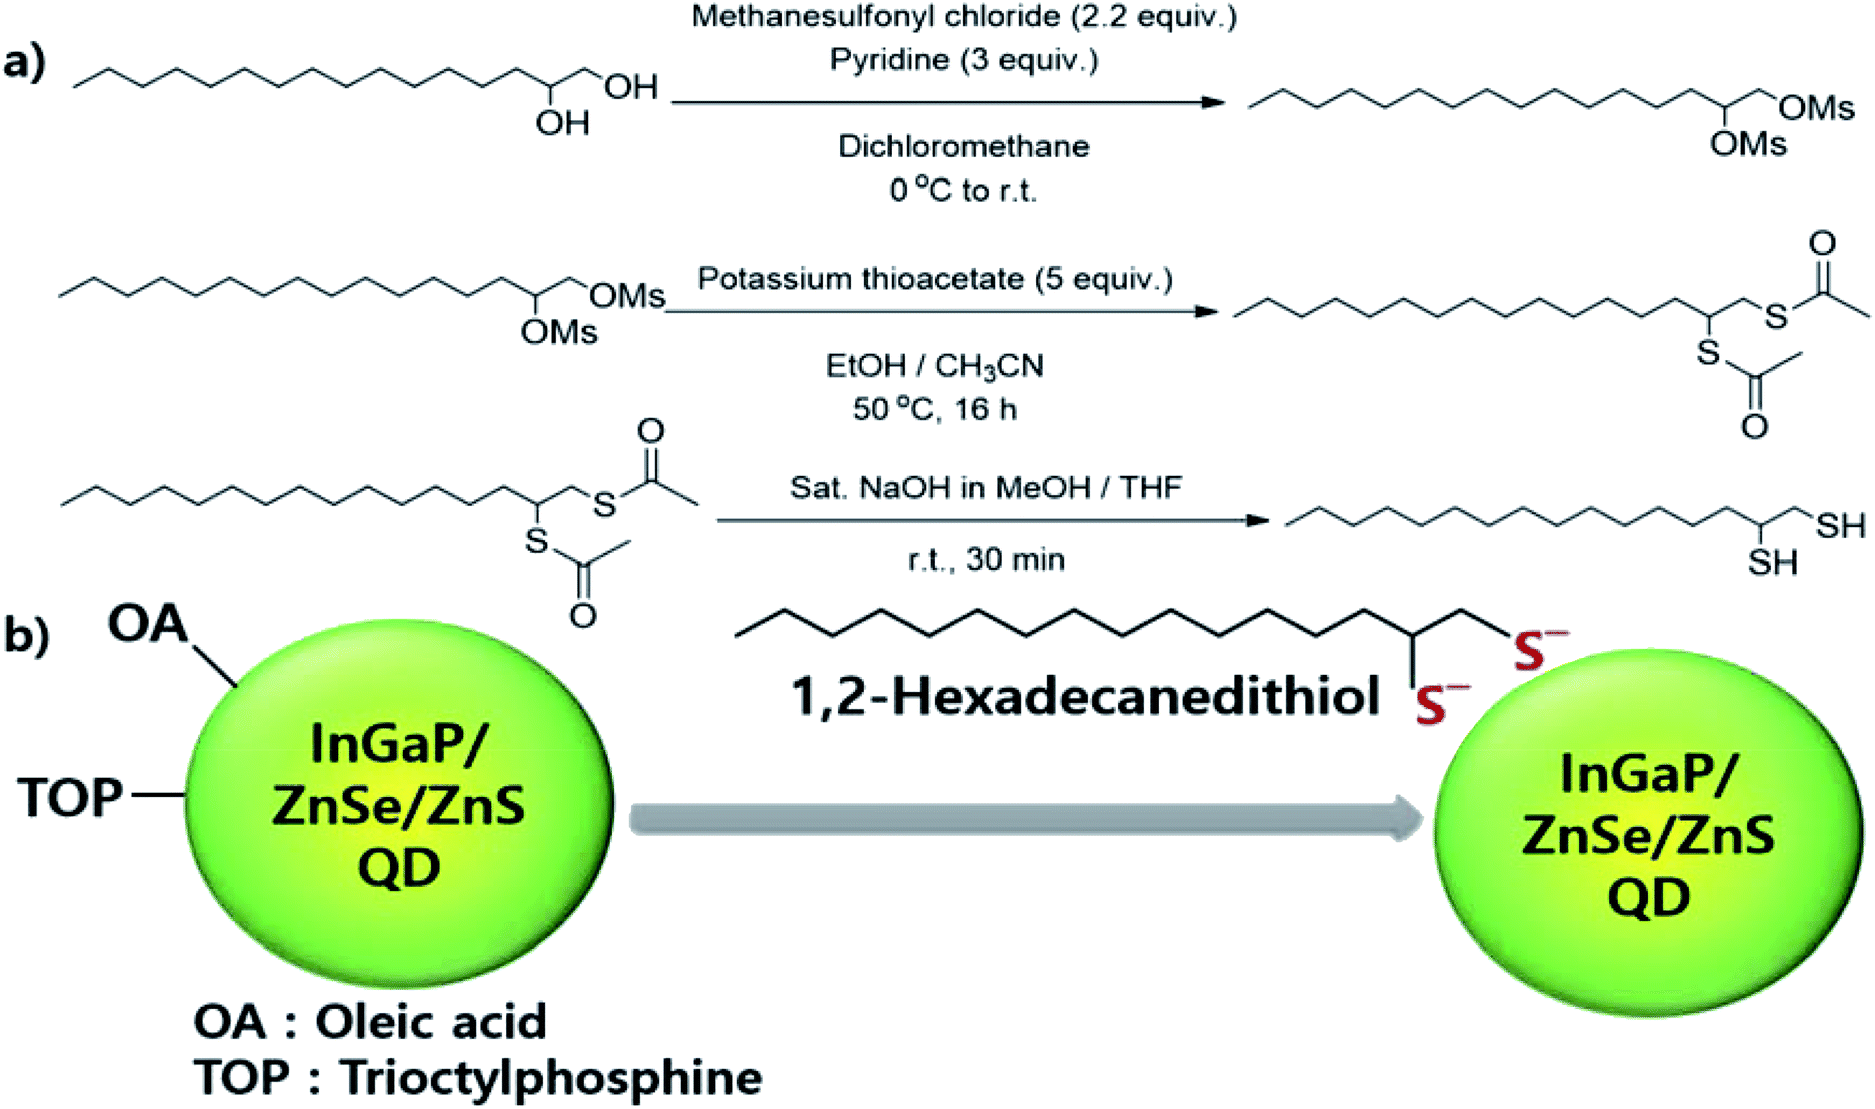 | ||
| Scheme 1 (a) Synthesis of 1,2-hexadecanedithiol and (b) schematic diagram of ligand exchange. | ||
The product was confirmed by 1H and 13C NMR analyses (Fig. S1, ESI†). Green- and red-light-emitting InP-based QDs were fabricated in accordance with the procedures mentioned in a previous study, which have also been described in the Experimental section. The exact structures of the QD can be described as follows: InGaP/ZnSe/ZnS core/shell QDs. To investigate the effect of the bidentate surfactant, the synthesized QDs were divided into two parts; one was washed with acetone solvent for removing the extra surfactant, and the other was mixed with 1,2-hexadecanedithiol and stirred at 80 °C for 12 h, and then washed with acetone as mentioned above. Both QDs were redispersed in hexane, and then left under ambient conditions. The decrease in QY was measured with time.
Fig. 1a–c shows the comparison of the QY data of two green-light-emitting samples over time. The initial QYs of both samples are similar; the QY of the pristine sample after the treatment is 81% and that of the dithiol-treated sample is 84%. Both have the same emission wavelength peak of 533 nm and the same emission spectral line width (full width at half maximum, FWHM) of 38 nm (Fig. 1a and b). After being kept in air at room temperature for 408 h, the dithiol-treated sample showed the same QY, whereas the QY of the pristine sample rapidly decreased to 17%. Long-term stability tests indicated that the QY of the dithiol-treated sample was unchanged for 400 h (Fig. 1c).
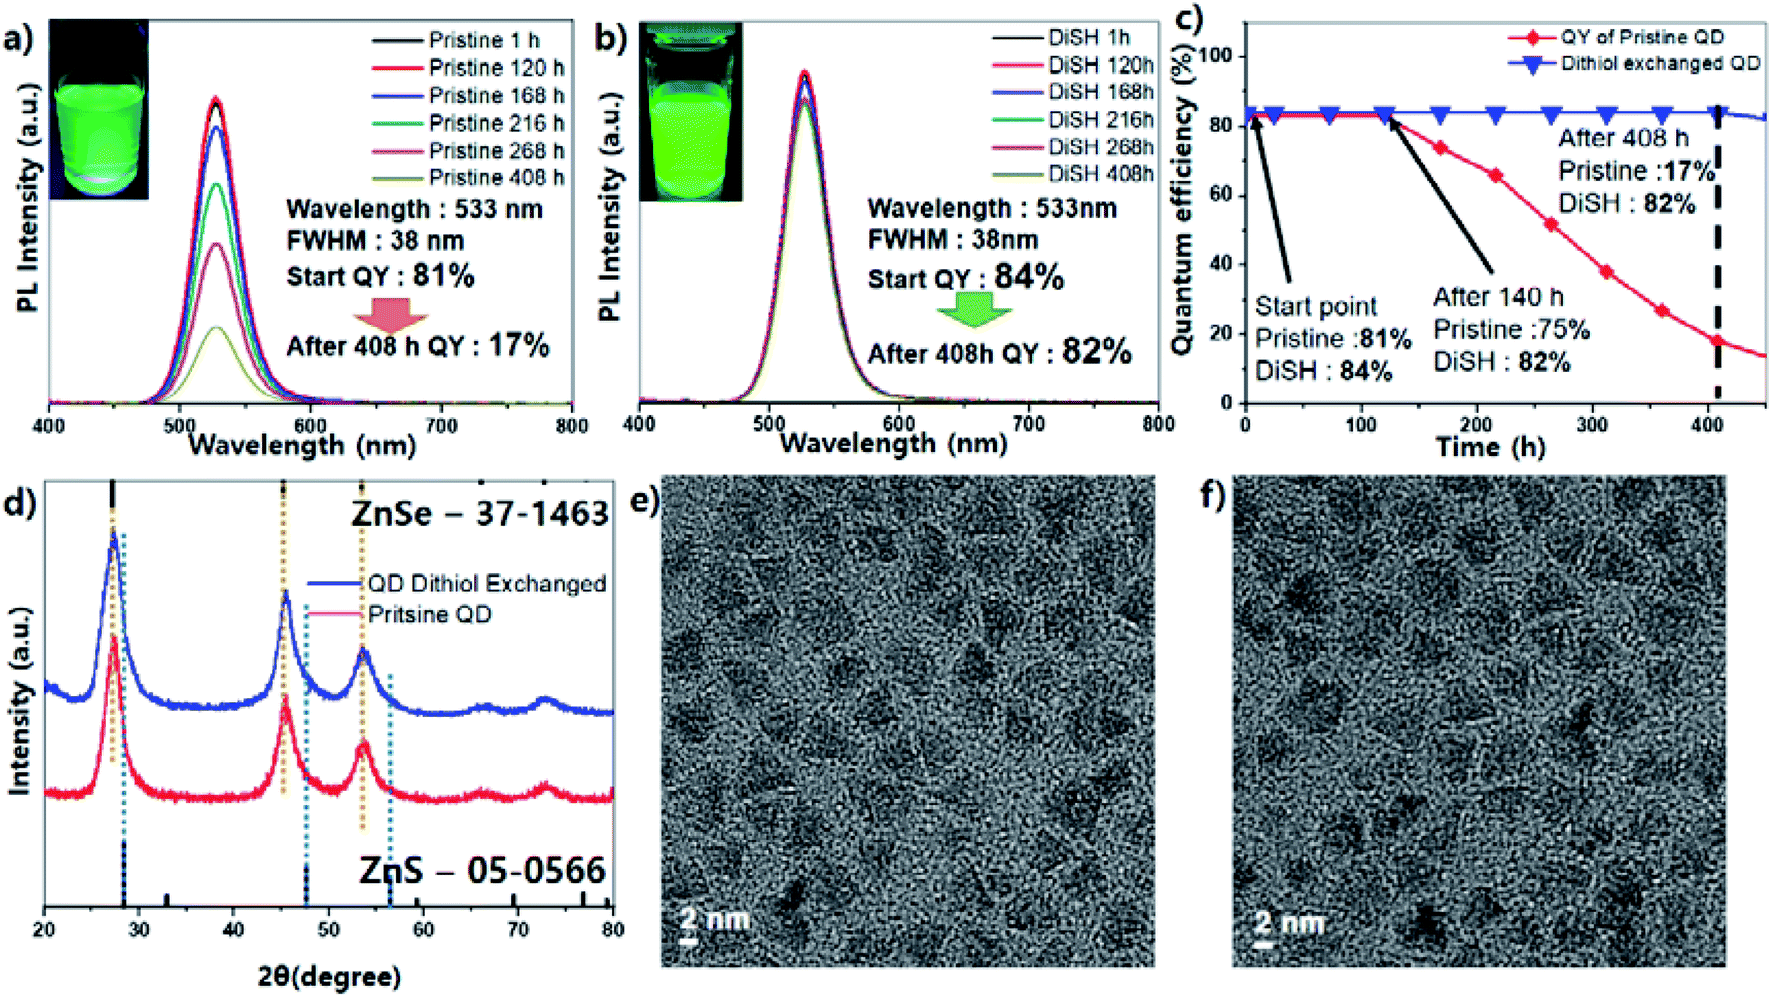 | ||
| Fig. 1 Emission spectrum of pristine InP QD (a), dithiol exchanged QD (b), pristine and exchanged QD's QY change plot (c), XRD spectrum (d), TEM image ((e); pristine, (f); exchanged). | ||
The photographs of both samples after 408 h also showed a clear difference in the brightness under UV light (Fig. 1a and b inset). The powder XRD data showed that the crystalline structure of the QDs did not change after the dithiol exchange (Fig. 1d). The thick ZnSe shell resulted in the peak position of the zinc-blended ZnSe structure. The particles of the pristine sample were tetrahedron shaped, and the size of each particle is about 6 to 7 nm on each triangle side. After ligand exchange, the particle size and shape almost seemed to be similar; therefore, there is no significant morphological differences between the pristine and dithiol exchanged QDs (Fig. 1e and f).
The existence of the dithiol ligand was confirmed by TGA/STA-MS. The TGA data showed that the weight loss of the dithiol-exchanged QDs took place in two stages, at 220 °C and 400 °C, whereas that of the pristine QDs occurred in one stage, at 400 °C (Fig. 2a blue line). At the first stage of 220 °C, the dithiol ligands were decomposed and the products were evaporated. The STA-Mass (Simultaneous Thermal Analyser Mass Spectrometer) data indicated that the products comprised a component with MW 222 (Fig. 2b), sulfur with MW 32, and a tiny amount of H2S with MW 34 (Fig. S2, ESI†). We assume that the product with MW 222 is formed following the removal of two H2S from 1,2-hexadecanedithiol.
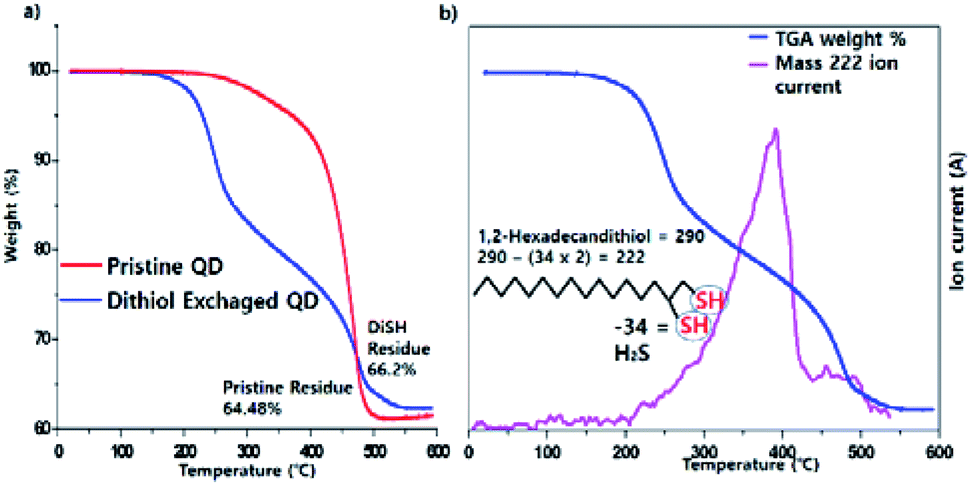 | ||
| Fig. 2 TGA spectrum of pristine InP green QD and dithiol exchanged QD (a), STA-mass spectrum of dithiol QD and 222 m/z ion current (b). | ||
The weight loss at 400 °C, which occurs in both samples, represents the elimination of the TOP-based ligand and oleic acid, which is the mainly used surfactant in the reaction (Fig. 2a). We confirmed MW 264 and MW 237 by the STA-MS, that the fragment ion of oleic acid in the over 400 °C part of TGA spectrum (Fig. S3, ESI†) Additionally, CHNS elemental analysis showed the increase in sulfur content in the dithiol-exchanged sample was 5%, whereas that in the pristine sample was 2% (Table S1†). These results indicate that dithiol acts as a ligand to the QDs and shows a much higher stability than the other surfactants used to treat pristine QDs. The more the amount of the surfactants, the better the stability of the QDs. The TGA data demonstrated that the amount of adsorbed surfactant in the dithiol-exchanged sample is 33.8% and that in case of the pristine sample is 35.5%. Nonetheless, the dithiol-exchanged sample showed a notably better stability.
We measured FT-IR infrared spectrometer to check the presence of organic species from organic surfactant (Fig. S4, ESI†). When comparing the FT-IR spectrum before and after ligand exchange, it shows that the peak of 3400 cm−1 section (O–H bonding) was significantly reduced after ligand exchange (Fig. S4† blue line). The phenomenon is supposed to occur by proportion of carboxyl acid ligand (as oleic acid) is reduced through the ligand exchange process.
The above procedure for green-light-emitting QDs was applied to both the red- and blue-light-emitting QDs to compare their stabilities. Red-light-emitting QDs are InGaP/ZnSe/ZnS QDs and blue-light-emitting QDs are ZnSeTe/ZnSe/ZnS QDs (Fig. 3). The stability of the QDs was tested by measuring the QY decrease with time. Red-light-emitting QDs showed an initial QY of 79%, and the efficiency was 78% when the dithiol exchange was performed. After 408 h, the QY of the dithiol-exchanged sample decreased slightly to 73%, whereas the QY of the pristine sample deteriorated sharply to 7% (Fig. 3a and b). The photographs of both samples showed a clear difference in brightness under UV light after 408 h in Fig. 3a and b inset. Since then, the QY of the dithiol-exchanged sample decreased to 66% after 456 h, and to 37% after 600 h (Fig. 3c and d). In case of the ZnSe-based blue-light-emitting QDs, the effect of the dithiol ligand was not as impressive as that in case of the InP-based green- and red-light-emitting QDs. When comparing the XRD and TEM data of the pristine and dithiol exchanged blue-light-emitting ZnSe quantum dots, there is no significant differences in crystal structure or size & shape (Fig. S5, ESI†). But from the Fig. 3c and d, the work-up process decreased the QY, unlike the case for the green- and red-light-emitting QDs. The QY of the dithiol-exchanged sample decreased a slightly from 62% to 51% after the work-up process, whereas the QY of the pristine sample decreased considerably from 62% to 31%. The QY of the pristine sample decreased to 27%, 21%, 10%, and 3% after 24 h, 48 h, 72 h, and 96 h, respectively. In case of the dithiol exchanged sample, the QY decreased to 41% and 35% after 24 h and 48 h, respectively, and then, the QY was constant up to a period of 144 h.
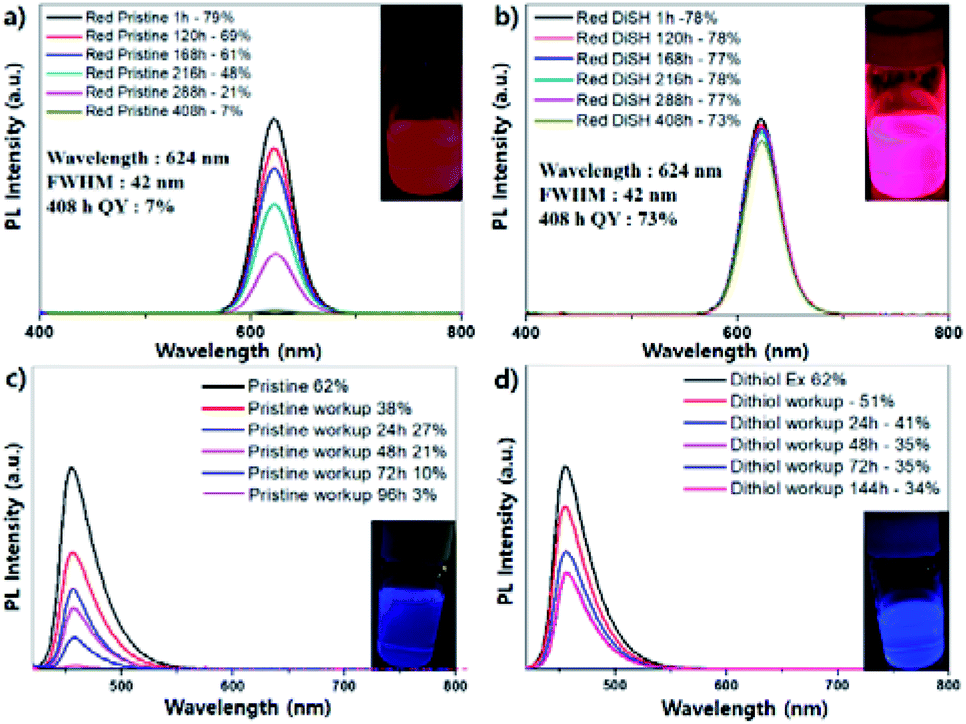 | ||
| Fig. 3 (a) Emission spectrum of pristine InP red QD, (b) dithiol exchanged red QD, (c) emission spectrum of pristine ZnSe blue QD, (d) dithiol exchanged blue QD. | ||
Finally, the QDs were subjected to more severe test conditions, for example, higher temperatures such as 160 °C (Fig. S6, ESI†). The QY of the pristine sample decreased from 81% to 7% at 108 h and under 3% at 144 h, whereas that of the dithiol-exchanged sample was 78% at 108 h and 70% at 144 h.
As an application, we used dithiol-exchanged and pristine QDs to a LED as a solid state light device and compared their stabilities after curing with QDs and POSS (Polyhedral Oligomeric Silsesquioxane) type resin on GaN blue LED chip at 10 V and 60 mA condition (Fig. 4). Fig. 4a and b showed that both QDs started at a similar level of 91 lm W−1 (pristine: 91.45 lm W−1, DiSH: 91.84 lm W−1). After 36 h, the emission of pristine sample was almost disappeared, but that of dithiol-exchanged QD is 57.67 lm W−1, which indicate that improved stability of QDs affect stability of LED devices. The change in luminescence over time was observed (Fig. 4d) and the color coordinate change was also tracked from 0 h to 36 h (Fig. 4c).
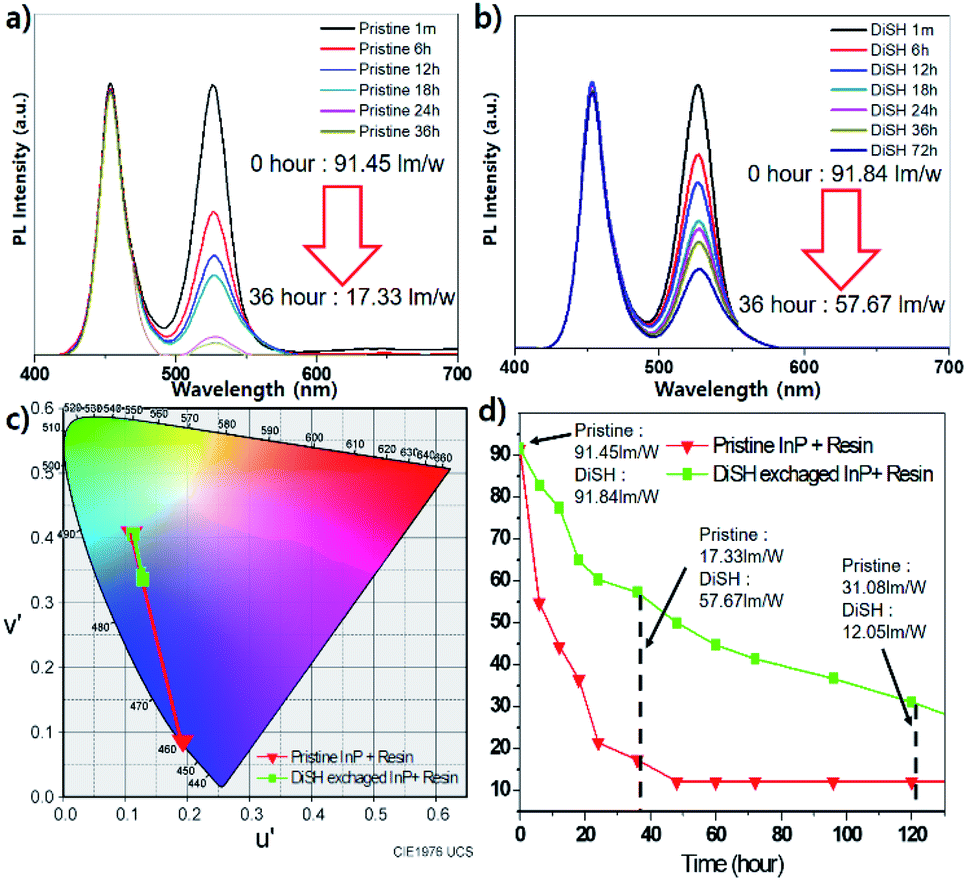 | ||
| Fig. 4 LED emission spectra of (a) pristine and (b) dithiol exchanged. (c) CIE diagram of coordinate conversion over the time (0 h to 36 h) (d) QD LED luminescence change of pristine and exchanged QDs. | ||
Conclusions
At summary, we have studied the surface stabilization of the samples to improve their stability, which is one of the major issues of InP-based QDs. We found a ligand capable of strongly passivating the surface of the QDs. Using a ligand with two functional groups, the chelate effect on the surface cation makes the ligand more strongly attached to the surface than the existing monodentate ligand; thus, it is possible to prevent the loss of ligands and to improve the stability of the QDs. Several functional groups (–COOH, –NH3, –SH) were introduced, but only dithiol was found to be effective. In order to confirm this effect, ligand exchange was carried out for the green-light-emitting InP-based QDs, and the PL stability of the QDs was greatly increased. TGA and STA-MS were performed to confirm that the increase in stability was due to the dithiol ligand, and the component with MW 222, sulfur with MW 32, and H2S with MW 34 were detected at the low-temperature region, which are from 1,2-hexadecanedithiol. When this procedure was applied to red-light-emitting InP-based QDs and blue-light-emitting ZnSe QDs, similar stability-enhancing effects were observed; stability-increasing effects were observed even at a high temperature of 150 °C. When dithiol exchanged QDs were used for a LED device, they also showed highly improved performance.Experimental section
Materials and method
All chemicals, indium acetate (In(OAc)3 99.99% trace metal basis Sigma-Aldrich), zinc acetate (Zn(OAc)2 99.99% trace metal basis Sigma-Aldrich), zinc oxide (ZnO 99.999% Sigma-Aldrich), zinc stearate (Zn(St)2 purum, 10–12% Zn basis Sigma Aldrich), myristic acid (99% Sigma), oleic acid (90% technical grade Aldrich), 1-dodecanthiol (≥98% Sigma-Aldrich), gallium trichloride (GaCl3 beads, anhydrous 99.999% trace metal basis Aldrich), selenium powder (200 mesh, 99.99%, Strem), sulfur (99.998%, Sigma-Aldrich), 1-octadecene (ODE 90% technical grade Aldrich), tri-n-octylphosphine (TOP, 97% strem), and tris(trimethylsilyl)phosphine (TMS-P min 98% from SK-chemicals, Korea), were used without any further purification.Synthesis of 1,2-hexadecanedithiol
Methanesulfonyl chloride (7.8 g, 68.2 mmol) was first added to a solution of 1,2-hexadecanediol (8.0 g, 31.0 mmol) and pyridine (7.4 g, 93.0 mmol) in dry CH2Cl2 (200 mL) at 0 °C under an Ar atmosphere. This mixture was warmed to 25 °C and stirred for 7 h. The reaction mixture was concentrated using a rotary evaporator. The residue was partitioned with saturated aq. Na2CO3 and Et2O. The organic layer was separated, washed with saturated aq. NH4Cl, dried over MgSO4, and concentrated to obtain the desired product (11.5 g, 89%) as a white solid. A solution of hexadecane-1,2-diyl dimethanesulfonate (5.0 g, 12.0 mmol) in CH3CN (20 mL) was added to a solution of potassium thioacetate (6.8 g, 60.0 mmol) in EtOH (60 mL) in a dropwise manner at RT. The resulting solution was warmed to 50 °C, and stirred for 16 h. The reaction mixture was concentrated using a rotary evaporator. The residue was partitioned using H2O and Et2O. The organic layer was separated, dried over MgSO4, and concentrated. The residue was subjected to column chromatography with hexane/EtOAc (30/1) as the eluent to obtain the desired product (2.9 g, 65%) as a white solid. A solution of S,S′-hexadecane-1,2-diyl diethanethioate (2.9 g, 7.7 mmol) in saturated NaOH containing MeOH (142 mL) and THF (86 mL) was stirred for 30 min at room temperature. A 1 N solution of aq. HCl was added to the resulting solution until a pH of 3 was attained. Then, the reaction mixture was concentrated using a rotary evaporator to remove the MeOH, and the remaining aqueous solution was extracted with Et2O. The organic layer was separated, dried over MgSO4, and concentrated. The residue was subjected to column chromatography with hexane/CH2Cl2 (30/1) as the eluent, to yield the desired product (2.1 g, 95%) as a white solid.Preparation of 0.25 M Zn-oleate solution
Zinc oxide (0.819 g, 10 mmol) and oleic acid (7.06 g, 8 mL at 25 °C, 25 mmol) were loaded into a 100 mL three-neck flask with 40 mL of 1-octadecene (ODE). The mixture was degassed for 2 h at 110 °C, after degassing, to N2 purging; and raise the temperature at 300 °C, kept at 1 h until the solution is transparent.Preparation of 0.2 M Zn-DDT solution
Zinc stearate (3.792 g, 6 mmol) and 1-dodecanthiol (2.429 g, 3 mL at 25 °C, 12 mmol) were loaded into a 100 mL three-neck flask with 30 mL 1-octadecene (ODE). The mixture was degassed for 2 h at 80 °C, after degassing, to N2 purging; and raise the temperature at 200 °C, kept the temperature until the solution is transparent.Preparation of 1 M TOP-Se solution
Selenium powder (0.789 g, 10 mmol) were dissolved in 10 mL of TOP at RT with stirring in the glove box.Preparation of 0.2 M TOP-S solution
Sulfur powder (0.32 g, 10 mmol) were dissolved in 10 mL of TOP at RT with stirring in the glove box.Synthesis of green-light-emitting InGaP/ZnSe/ZnS QDs
Indium acetate (0.070 g, 0.24 mmol), zinc acetate (0.183 mg, 1 mmol), and myristic acid (0.496 g, 2.24 mmol) were dissolved in 6 mL of octadecene (ODE) at room temperature. The resulting solution was then degassed for 12 h at 110 °C, and subjected to N2 purging; the temperature was raised to 300 °C. Subsequently, a solution of 0.048 mg of tris(trimethylsilyl)phosphine (0.19 mmol) in 1 mL of ODE, and 0.5 mL of trioctylphosphine (TOP) were injected into the degassed solution at 200 °C, and the temperature was increased to 300 °C; the reaction was continued for 3 min. Next, the temperature was reduced to 200 °C, and GaCl3 solution (0.08 mmol; prepared in 1 mL of ODE) was slowly injected into the mixture; the reaction was continued for 1 h. The ZnSe shell was formed by using 0.25 M zinc oleate solution (4 mL, 1.0 mmol) prepared in ODE, which was mixed with the InP solution at 200 °C. After 10 min, TOP selenide (0.5 M, 2 mL, 1 mmol) was injected into the reaction mixture. The solution was heated to 320 °C and the temperature was maintained for 1 h; after the ZnSe shell coating, injection 1 M ODE-S solution (0.25 mL, 0.25 mmol) repeat 3 times. The solution was cooled to 200 °C. For the formation of the ZnS shell on the InP/ZnSe QDs, 0.2 M Zn-DDT solution (Zn-stearate (632 mg, 1 mmol) dissolved in 4.5 mL of ODE and 0.5 mL of 1-dodecanethiol) was injected when into the mixture at 200 °C. After 10 min, the temperature was raised to 300 °C and maintained for 120 min. The reaction mixture was then cooled to RT. The resulting QDs were precipitated and washed with acetone.Synthesis of red-light-emitting InGaP/ZnSe/ZnS QDs
Indium acetate (0.070 g, 0.24 mmol), zinc acetate (0.011 g, 0.12 mmol), and myristic acid (0.16 mg, 0.72 mmol) were dissolved in 6 mL of ODE at room temperature. The solution was then degassed for 12 h at 110 °C, and subjected to N2 purging; the temperature was raised to 300 °C, followed by the injection of tris(trimetylsilyl)phosphine solution (0.06 mmol) in 1 mL of ODE and 0.5 mL of 1 mmol TOP (0.5 M, 2 mL). The temperature was maintained at 230 °C for 2 h for the formation of the QD core. Tris(trimetylsilyl)phosphine solution was prepared as described earlier. The temperature of the mixture was raised to 270 °C and the prepared tris(trimetylsilyl)phosphine solution was added to the mixture in a dropwise manner; the reaction was allowed to continue for 1 h. The processes followed from this point until the GaP- and ZnSe/ZnS shell-preparation steps are the same as those mentioned previously.Synthesis of blue-light-emitting ZnSe/ZnS QDs
Zinc acetate (183 mg, 1 mmol) and oleic acid (846 mg, 3 mmol) were dissolved in 5 mL of ODE at room temperature; then, the solution was degassed for 2 h at 110 °C. The solution was then subjected to N2 purging, and the temperature was raised to 280 °C. Next, 0.2 mmol diphenylphosphine selenide (DPP-Se) (1 M, 0.2 mL) and 0.05 mmol trioctylphosphine telluride (TOP-Te) (1 M, 0.05 mL) were injected into the reaction mixture, and the reaction was allowed to take place for 30 min. The mixture was then cooled at room temperature and 0.4 mmol TOP-Se (1 M, 0.4 mL) was injected into the reaction mixture. The temperature was raised to 280 °C and the reaction was allowed to continue for 1 h. Next, 1 mmol Zn-oleate (0.25 M, 4 mL) was injected into the reaction mixture; the reaction was allowed to occur for 5 min. Next, 0.4 mmol TOP-Se (1 M, 0.4 mL) was injected into the reaction mixture, and the reaction was allowed to occur for 1 h. For the ZnS shell-preparation step, 1 mmol Zn-oleate (0.25 M, 4 mL) was injected into the reaction mixture at 280 °C; the reaction was allowed to occur for 5 min. The temperature was then reduced to 230 °C, after which 2 mmol TOP-S (1 M, 2 mL) was injected; the reaction was allowed to occur for 10 min. The reaction mixture was then cooled to RT. The resulting QDs were precipitated and washed with acetone.Ligand exchange process
The QD solution was prepared without the work-up process. After the synthesis of InP-based QDs, the solution was cooled to RT and 1,2-hexadecanedithiol (2 mmol, 0.582 g) was added; the temperature was then raised to 80 °C, and maintained for 12 h. After the exchange process, the resulting QDs were precipitated and washed with acetone.Checking ambient solution stability
The QDs dispersed in hexane and stored in solution-state with 5 mL vial at R.T (25 °C) without any excitation.Checking thermal solution stability
The QDs stored in 160 °C microwave oven at solid-state with 5 mL vial without any excitation.Characterization
The absorption spectra were measured using a Scinco PDA S-3100 UV/vis spectrophotometer. The emission spectra were obtained using an Ocean Optics fluorescence spectrometer. Transmission electron microscopy (TEM) images were recorded using a Super-Twin transmission electron microscope operating at 300 kV. X-ray diffraction (XRD) patterns were obtained using a Rigaku Ultima III diffractometer equipped with a rotating anode and a Cu Kα radiation source (λ = 0.15418 nm). Thermogravimetric analysis/Simultaneous Thermal Analyser-Mass Spectrometer spectrum measured using a NETZSCH STA 409 PC + QMS 403C. The absolute PL QY measured using a quantum efficiency measurement system with integrated sphere (QE 2000B, Osuka).Conflicts of interest
There are no conflicts to declare.Acknowledgements
This research was supported by the Basic Science Research Program through the National Research Foundation of Korea (NRF) funded by the Ministry of Science, ICT & Future Planning (no. 2014R1A5A1009799 and 2020R1A2C1004943), Republic of Korea.Notes and references
- C. B. Murray, D. J. Norris and M. G. Bawendi, J. Am. Chem. Soc., 1993, 115, 8707 Search PubMed.
- E. Jang, S. Jun, H. Jang, J. Lim, B. Kim and Y. Kim, Adv. Mater., 2010, 22, 3076 CrossRef CAS PubMed.
- J. H. Chang, D. Hahm, K. Char and W. K. Bae, J. Inf. Disp., 2017, 18(2), 57 CrossRef CAS.
- O. Chen, J. Zhao, V. P. Chauhan, J. Cui, C. Wong, D. K. Harris, H. Wei, H.-S. Han, D. Fukumura, R. K. Jain and M. G. Bawendi, Nat. Mater., 2013, 12, 445 CrossRef CAS PubMed.
- W. K. Bae, J. Kwak, W. Park, K. Char, C. Lee and S. Lee, Adv. Mater., 2009, 21, 1690 CrossRef CAS.
- H. S. Jang, H. Yang, S. W. Kim, J. Y. Han, S.-G. Lee and D. Y. Jeon, Adv. Mater., 2008, 20, 2696 CrossRef CAS PubMed.
- G. Konstantatos, I. Howard, A. Fischer, S. Hoogland, J. Clifford, E. Klem, L. Levina and E. H. Sargent, Nature, 2006, 442, 180 CrossRef CAS PubMed.
- S. Maimon, E. Finkman, G. Bahir, S. E. Schacham, J. M. Garcia and P. M. Petroff, Appl. Phys. Lett., 1998, 73, 2003 CrossRef CAS.
- N. Huo, S. Gupta and G. Konstantatos, Adv. Mater., 2017, 29(17), 1606576 CrossRef PubMed.
- I. Gur, N. A. Fromer, M. L. Geier and A. P. Alivisatos, Science, 2005, 310, 462 CrossRef CAS PubMed.
- J. P. Park, J. H. Heo, S. H. Im and S.-W. Kim, J. Mater. Chem. A, 2016, 4(3), 785 RSC.
- A. H. Ip, S. Thon, M. S. Hoogland, O. Voznyy, D. Zhitomirsky, R. Debnath, L. Levina, L. R. Rollny, G. H. Carey, A. Fischer, K. W. kemp, I. J. Kramer, Z. Ning, A. J. Labelle, K. W. Chou, A. Amassian and E. H. Sargent, Nat. Nanotechnol., 2012, 7, 577 CrossRef CAS PubMed.
- S. H. Im, H.-j. Kim, S. W. Kim, S.-W. Kim and S. I. Seok, Energy Environ. Sci., 2011, 4, 4181 RSC.
- P. M. Allen, W. Liu, V. P. Chauhan, J. Lee, A. Y. Ting, D. Fukumura, R. K. Jain and M. G. Bawendi, J. Am. Chem. Soc., 2010, 132, 470 CrossRef CAS PubMed.
- J. Yang, C.-H. Lee, H.-J. Ko, J.-S. Suh, H.-G. Yoon, K. Lee, Y.-M. Huh and S. Haam, Angew. Chem., Int. Ed., 2007, 46, 8836 CrossRef CAS PubMed.
- I. L. Medintz, H. T. Uyeda, E. R. Goldman and H. Mattoussi, Nat. Mater., 2005, 4, 435 CrossRef CAS PubMed.
- J. Lim, W. K. Bae, D. Lee, M. K. Nam, J. Jung, C. Lee, K. Char and S. Lee, Chem. Mater., 2011, 23, 4459 CrossRef CAS.
- S. Kim, T. Kim, M. Kang, S. K. Kwak, T. W. Yoo, L. S. Park, I. Yang, S. Hwang, J. E. Lee, S. K. Kim and S.-W. Kim, J. Am. Chem. Soc., 2012, 134, 3804 CrossRef CAS PubMed.
- Y. Kim, S. Ham, H. Jang, J. H. Min, H. Chung, J. Lee, D. Kim and E. Jang, ACS Appl. Nano Mater., 2019, 2, 1496 CrossRef CAS.
- V. Wood and V. Bulović, Nano Rev., 2010, 1, 5202 CrossRef PubMed.
- H. Shen, W. Cao, N. T. Shewmon, C. Yang, L. S. Li and J. Xue, Nano Lett., 2015, 15, 1211 CrossRef CAS PubMed.
- P. Ramasamy, N. Kim, Y.-S. Kang, O. Ramirez and J.-S. Lee, Chem. Mater., 2017, 29, 6893 CrossRef CAS.
- N. A. Hill and K. B. Whaley, J. Chem. Phys., 1994, 100(4), 2831 CrossRef CAS.
- S. N. Sharma, Z. S. Pillai and P. V. Kamat, J. Phys. Chem. B, 2003, 107(37), 10088 CrossRef CAS.
- V. I. Klimov, A. A. Mikhailovsky, D. W. McBranch, C. A. Leatherdale and M. G. Bawendi, Phys. Rev. B, 2000, 61(20), R13349 CrossRef CAS.
- R. Tadmor, R. E. Rosensweig, J. Frey and J. Klein, Langmuir, 2000, 16(24), 9117 CrossRef CAS.
- T. Rajh, O. I. Micic and A. J. Nozik, J. Phys. Chem., 1993, 97, 11999 CrossRef CAS.
- D. V. Talapin, A. L. Rogach, I. Mekis, S. Haubold, A. Kornowski, M. Haase and H. Weller, Colloids Surf., A, 2002, 202, 145 CrossRef CAS.
- S. Sun and C. B. Murray, J. Appl. Phys., 1999, 85(8), 4325–4330 CrossRef CAS.
- V. Dzhagan, I. Lokteva, C. Himcinschi, X. Jin, J. Kolny-Olesiak and D. R. Zahn, Nanoscale Res. Lett., 2011, 6(1), 79 CrossRef PubMed.
- B. Mahler, N. Lequeux and B. Dubertret, J. Am. Chem. Soc., 2009, 132(3), 953 CrossRef PubMed.
- A. Morris-Cohen, M. T. Frederick, G. D. Lilly, E. A. McArthur and E. A. Weiss, J. Phys. Chem. Lett., 2010, 1, 1078 CrossRef CAS.
- P. M. Allen, B. J. Walker and M. G. Bawendi, Angew. Chem., Int. Ed., 2010, 49, 760 CrossRef CAS PubMed.
- M. Mulvihill, S. Habas, I. Jen-La Plante, J. Wan and T. Mokari, Chem. Mater., 2010, 22(18), 5251 CrossRef CAS.
- I. L. Medintz, H. Tetsuo Uyeda, E. R. Goldman and H. Mattoussi, Nat. Mater., 2005, 4(6), 435 CrossRef CAS PubMed.
- Z. Li, Y. Hu, H. Shen, Q. Lin, L. Wang, H. Wang, W. Zhao and L. S. Li, Laser Photonics Rev., 2017, 11, 1600227 CrossRef.
- M. J. Green, J. Mater. Chem., 2010, 20, 5797 RSC.
- S. Zhang, G. Leem, L. O. Srisombat and T. R. Lee, J. Am. Chem. Soc., 2008, 130(1), 113 CrossRef CAS PubMed.
- W. Lin, Y. Niu, R. Meng, L. Huang, H. Cao, Z. Zhang, H. Qin and X. Peng, Nano Res., 2016, 9(1), 260 CrossRef CAS.
Footnote |
| † Electronic supplementary information (ESI) available: Table of EA-CHNS, PL spectrum of 150 °C annealing, TGA/STA-MS spectrums of sulfur (32 °C) and H2S (34 m/z), oleic acid & oleic acid fragment ion (264 m/z) at over the 400 °C plot. See DOI: 10.1039/c9ra10933a |
| This journal is © The Royal Society of Chemistry 2020 |