 Open Access Article
A sensitive and selective fluorescent probe for hydrazine with a unique nonaromatic fluorophore†
Jian Liua,
Tao Lia,
Shun Wanga,
Qingrong Qib,
Hang Song a,
Zicheng Lia,
Li Yang*c and
Wencai Huang
 *a
*a
aSchool of Chemical Engineering, Sichuan University, Chengdu 610065, P. R. China. E-mail: hwc@scu.edu.cn
bWest China School of Pharmacy, Sichuan University, Chengdu 610041, P. R. China
cState Key Laboratory of Biotherapy and Cancer Center, West China Hospital, West China Medicinal School, Sichuan University, Chengdu 610041, P. R. China. E-mail: yangli@scu.edu.cn
First published on 4th February 2020
Abstract
To achieve sensitive, selective and facile detection of hydrazine in environmental and biological systems, a fluorescent probe (Che-Dcv) with a unique nonaromatic fluorophore was developed. Upon hydrazine addition in 20% DMSO–PBS buffer (pH = 7.4, 10 mM, v/v) at room temperature, the probe displayed a strong emission at 496 nm along with a color change from brown-red to yellow. The response was attributed to the reaction of dicyanovinyl groups with hydrazine to afford hydrazone, which was supported by 1H NMR and HRMS. The detection limit of Che-Dcv for hydrazine was estimated to be as low as 1.08 ppb and good selectivity over amines including hydroxylamine was observed. Then, the potential of probe-coated test papers to detect hydrazine in solution and vapor phase was demonstrated. Moreover, the bioimaging of hydrazine in living H1975 cells was performed successfully.
Introduction
As a well-known diamine with strong basicity, reducing power and nucleophilicity, hydrazine (N2H4) has been widely used in many fields for a long time.1 It can serve as high-energy rocket propellant,2 fuel for cells,3 corrosion inhibitor4 and blowing agent,5 it can also be used as the intermediate to produce pharmaceuticals, insecticides, antioxidants, textile dyes, photographic developers and polymers.6,7 On the other hand, hydrazine is notorious for its toxicity to human beings and the environment.8–10 In accordance with the U.S. Environmental Protection Agency, the allowable limit of hydrazine in drinking water is 10 ppb.11Apart from the synthetic hydrazine which may pose a potential threat to the environment, hydrazine may also be generated as a byproduct by certain yeasts and some nitrogen fixing bacteria.12 Moreover, the endogenous aminoacylase may induce a hydrolytic cleavage of some drugs such as isoniazid and pasiniazide to liberate free hydrazine in animal or human body as a toxic metabolite.13,14 Considering the carcinogenic and mutagenic properties of hydrazine, it is highly desirable to detect hydrazine in both environmental and biological samples sensitively and selectively.
Among various analytic methods for hydrazine, fluorescent techniques are extremely attractive because of their high sensitivity, easy implementation, biocompatibility and real-time detection. The past decade has witnessed the thriving of fluorescent probes for hydrazine detection, and the design strategies as well as applications of various fluorescent probes have been extensively reviewed recently.15,16
Generally, recognition site and fluorophore are two requisites for a reaction-based small molecule fluorescent probe, the former primarily determines the selectivity of the probe, and the latter determines the optical properties of the probe, such as the excitation/emission wavelength, Stokes shift, quantum yield, and sensitivity. It is noticeable that even attachment of the same recognition site to different fluorophores can result in distinctive differences in the overall behavior of the probes.15 For example, when acetate, the simplest and widely exploited recognition site for hydrazine was connected to different fluorophores such as flavonoid,17 resorufin18 and cyanine19 to afford different probes, the detection limits of hydrazine were 320 ppb, 26.2 ppb and 0.81 ppb respectively, and the solubility, emission wavelength, response time and selectivity toward hydrazine varied greatly. Hence, the design or selection of fluorophore is pivotal to construct an efficient probe.
Till now, a wide diversity of fluorophores such as cyanine,19,20 hemicyanine,21,22 BODIPY,23,24 fluorescein,25,26 benzothiazole,27,28 coumarin,29,30 naphthalimide,31,32 quinolone,33 phenothiazine,34 benzimidazole,35 phenanthroimidazole,36 pyrene37 and tetraphenylethylene38 have been applied in the manufacturing of fluorescent probes for hydrazine detection and different properties and applications have been demonstrated. Unlike the aforementioned classical fluorophores with at least one aromatic or heteroaromatic ring, herein, we report the synthesis and application of a novel fluorescent probe (Che-Dcv) with a unique conjugated π-structure as the fluorophore. As for the recognition site for hydrazine, dicyanovinyl was selected because it has been successfully used to fabricate various fluorescent probes owning to its strong electron-withdrawing property and specific reactivity toward hydrazine.29,34,38–46
Thus, the dimethylamino group and dicyanovinyl groups connected to the 1,4-cyclohexadiene ring act as the electro-donating group and electro-withdrawing groups respectively, providing a typical donor–π–acceptor (D–π–A) system. When the two dicyanovinyl groups reacted with hydrazine in solution to afford hydrazone, the fluorometric properties changed markedly via an intramolecular charge transfer (ICT) mechanism, leading to the sensitive and selective responses observed. Moreover, applications of the probe on test strip experiment and bioimaging of hydrazine in living cells have been successfully demonstrated.
Materials and methods
Materials and instruments
All the chemicals and solvents were of analytical grade and purchased from commercial suppliers. They were used as received without further purification unless otherwise stated. As for the selectivity study, KCl, CaCl2, FeCl3, CuSO4, MgSO4, NaCl, Na2SO4, NaNO2, Na2CO3, NH4Cl, ammonia, hydroxylamine, diethylamine, ethylenediamine, aniline, thiourea, L-Ile, L-Phe, L-Pro, L-His, L-Arg, L-Lys, isoniazid, acethydrazide were used to prepare the stock solutions. Ultrapure water was purified from Millipore water purification system and used throughout all the experiments. Silica gel P60 (Qingdao, mesh number 200–300) was used for column chromatography. 1H NMR and 13C NMR spectra were recorded on a Bruker 400 M instrument and chemical shifts were given in ppm. Mass spectra (ESI) were measured on a Finnigan LCQ DECA spectrometer. UV-vis and fluorescence spectra were recorded on a SHIMADZU UV-2450 spectrophotometer and a VARIAN Cary Eclipse FL1003 M013 spectrometer respectively. The pH value was measured using a pHS-25 digital pH meter. H1975 cells were obtained from American Type Culture Collection (ATCC) and their fluorescence images were captured with a ZEISS LSM 880 Laser scanning confocal microscope.Synthesis
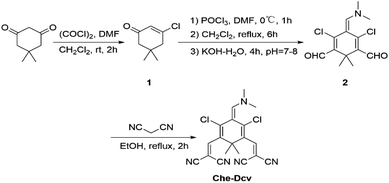
Probe Che-Dcv was synthesized via a three-step procedure as depicted in Scheme 1. Structural identification of the intermediates and probe was confirmed by 1H NMR, 13C NMR and HRMS spectroscopy (Fig. S1–S7†).![[thin space (1/6-em)]](https://www.rsc.org/images/entities/char_2009.gif) :
:![[thin space (1/6-em)]](https://www.rsc.org/images/entities/char_2009.gif) ethyl acetate = 6
ethyl acetate = 6![[thin space (1/6-em)]](https://www.rsc.org/images/entities/char_2009.gif) :
:![[thin space (1/6-em)]](https://www.rsc.org/images/entities/char_2009.gif) 1, v/v) to afford compound 2 as an orange powder (1.91 g, 30.0%). 1H NMR (400 MHz, CDCl3) δ 10.12 (s, 2H), 7.52 (s, 1H), 3.19 (s, 6H), 1.65 (s, 6H). 13C NMR (100 MHz, DMSO-d6) δ 189.7, 154.5, 146.0, 129.4, 99.8, 45.9, 42.4, 24.8. HRMS m/z: calculated for [C13H15Cl2NO2 + Na]+, 310.0378, found: 310.0376.
1, v/v) to afford compound 2 as an orange powder (1.91 g, 30.0%). 1H NMR (400 MHz, CDCl3) δ 10.12 (s, 2H), 7.52 (s, 1H), 3.19 (s, 6H), 1.65 (s, 6H). 13C NMR (100 MHz, DMSO-d6) δ 189.7, 154.5, 146.0, 129.4, 99.8, 45.9, 42.4, 24.8. HRMS m/z: calculated for [C13H15Cl2NO2 + Na]+, 310.0378, found: 310.0376.![[thin space (1/6-em)]](https://www.rsc.org/images/entities/char_2009.gif) :
:![[thin space (1/6-em)]](https://www.rsc.org/images/entities/char_2009.gif) ethyl acetate = 10
ethyl acetate = 10![[thin space (1/6-em)]](https://www.rsc.org/images/entities/char_2009.gif) :
:![[thin space (1/6-em)]](https://www.rsc.org/images/entities/char_2009.gif) 1, v/v) to afford probe Che-Dcv as a black powder (0.42 g, 36.0%). 1H NMR (400 MHz, CDCl3) δ 7.52 (s, 1H), 7.40 (s, 2H), 3.27 (s, 6H), 1.30 (s, 6H). 13C NMR (100 MHz, CDCl3) δ 189.8, 157.9, 152.6, 113.1, 112.4, 102.6, 90.2, 45.7, 44.5, 26.5. HRMS m/z: calculated for [C19H15Cl2N5 + Na]+, 406.0602, found: 406.0607.
1, v/v) to afford probe Che-Dcv as a black powder (0.42 g, 36.0%). 1H NMR (400 MHz, CDCl3) δ 7.52 (s, 1H), 7.40 (s, 2H), 3.27 (s, 6H), 1.30 (s, 6H). 13C NMR (100 MHz, CDCl3) δ 189.8, 157.9, 152.6, 113.1, 112.4, 102.6, 90.2, 45.7, 44.5, 26.5. HRMS m/z: calculated for [C19H15Cl2N5 + Na]+, 406.0602, found: 406.0607.Spectral measurements
For UV-vis and fluorescence titrations, stock solutions of probe Che-Dcv (50 μM) and N2H4 (10 mM) were prepared in DMSO and ultrapure water respectively. In titration experiment, a typical test sample was prepared by mixing 0.4 mL probe stock solution and certain amount of N2H4 stock solution in a test tube, then diluting to 2.0 mL with PBS buffer (pH = 7.4, 10 mM), the final concentration of probe Che-Dcv was 10 μM. After the resulting solution was incubated at 25 °C for 15 min, UV-vis absorption and fluorescence spectra (λex = 350 nm or 480 nm, slit width: dex/dem = 10/10 nm or 20/20 nm) were recorded. The effect of different pH (3.0–9.0) was recorded by fluorescence spectra (λex = 350 nm, slit width: dex/dem = 10/10 nm).Selectivity study
Parallel experiments were carried out to investigate the selectivity of probe Che-Dcv toward hydrazine over other interfering analytes such as cations (K+, Ca2+, Fe3+, Cu2+, Mg2+, NH4+), anions (Cl−, SO42−, NO2−, CO32−), amino acids (L-Ile, L-Phe, L-Pro, L-His, L-Arg, L-Lys), amines (ammonia, hydroxylamine, diethylamine, ethylenediamine, aniline, thiourea) and hydrazine derivatives (isoniazid, acethydrazide). Stock solutions of these interfering analytes (40 mM) were prepared in DMSO or ultrapure water and then diluted with PBS buffer (containing 20% DMSO, pH = 7.4, 10 mM). The final concentration of interfering analytes was 400 μM while the concentration of hydrazine was 200 μM.Detection of hydrazine by test strips
Filter paper strips were soaked in a DMSO solution of probe Che-Dcv (1 mM) for 30 s and then dried in air. When the probe-coated test strips were used to detect hydrazine in vapor phase, they were placed to cover brown bottles containing different concentrations of N2H4 (0.01–40%) or saturated vapor of interfering substances (HCHO, Et3N, CO2 and HCl) for 30 min. When they were used to detect of hydrazine in aqueous solution, they were infiltrated in solutions of different concentrations of N2H4 (0.01–40%) for 10 s and then dried in air. All the operations were carried out in a fume hood at room temperature and the treated test strips were observed under natural light or UV lamp (365 nm).Cell imaging experiments
H1975 cells were cultured in Dulbecco's Modified Eagle's Medium (DMEM, pH = 7.2–7.4) supplemented with 10% fetal bovine serum (FBS) in a 5% CO2 atmosphere at 37 °C. Before cell imaging experiments, H1975 cells were seeded in 96-well plates and incubated for 24 h. The cytotoxicity of Che-Dcv was evaluated with a standard MTT assay. H1975 cells were treated with 10 μL increasing concentrations of probe (0, 1, 2, 4, 8, 16 and 32 μM) for 2 h followed by 10 μL MTT for another 24 h, the absorbance at 803 nm of each well was measured by a microplate reader. Finally, the cell viability was calculated. For fluorescence microscopy imaging experiment, H1975 cells were incubated with 10 μM Che-Dcv (0.05% DMSO–PBS, v/v) for 4 h at 37 °C and slightly rinsed 3 times with PBS buffer. Then, the pretreated cells were further incubated with 50 μM N2H4 for another 15 min, fixed with 4% paraformaldehyde for 5 min and washed 3 times with PBS buffer. At last, the laser scanning confocal microscopy images were recorded (λex = 480 nm, λem = 750–850 nm and λex = 350 nm, λem = 440–630 nm).Result and discussion
Design and synthesis of the probe
Although various fluorophores have been used to prepare fluorescent probes for hydrazine detection, new fluorophores with unique optical properties are still in urgent demand. Under the action of DMF–POCl3, cyclohexanone could be converted to 2-chloro-3-(hydroxymethylene)-1-cyclohexene-1-carboxaldehyde followed by reaction with substituted indolenine quaternary ammonium salts to generate various heptamethine cyanines.47,48 Inspired by this strategy, we selected cyclohexanediones as the starting material to explore their potential of constructing new fluorophores. As a consequence, 5,5-dimethyl-1,3-cyclohexanedione reacted with DMF and oxalyl chloride to obtain β-halo-α,β-unsaturated ketone 1.49 Then, 1 was transformed to 2 under the action of DMF–POCl3.50 It should be noted that dimethyl attached to the 1,4-cyclohexadiene ring prevented the aromatization of 2 to form 2,4-dichlorobenzene – 1,3,5-tricarbaldehyde, thus forming a unique nonaromatic conjugated structure with one dimethylamino group and two aldehyde groups. Finally, condensation of 2 with malononitrile in ethanol afforded probe Che-Dcv.Spectral response of probe to hydrazine
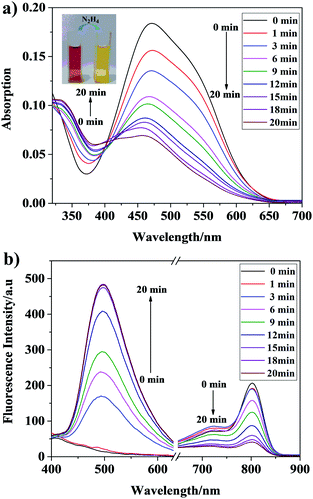
Time-dependent absorption and fluorescence spectral responses of Che-Dcv (10 μM) towards hydrazine (200 μM) in 20% DMSO–PBS buffer (pH = 7.4, 10 mM, v/v) were investigated and the results were illustrated in Fig. 1a. It could be seen that the free probe Che-Dcv showed a broad absorption band centered at 470 nm. Upon addition of 200 μM hydrazine, the maximum absorption band gradually decreased, while the absorption band at 340 nm increased very slightly. Meanwhile, the color of the solution changed from brown-red to yellow under natural light, suggesting that hydrazine could be detected by the naked-eye (Fig. 1a inset). On the other hand, the fluorescence emission at 803 nm (λex = 480 nm) decreased gradually while the fluorescence emission at 496 nm (λex = 350 nm) increased markedly after the addition of hydrazine. As shown in Fig. 1b, the equilibrium was reached within 15 min and nearly no further fluorescence enhancement at 496 nm could be observed afterwards. Additionally, the Stokes shift of Che-Dcv was calculated to be 146 nm when excited at 350 nm.Sensing mechanism
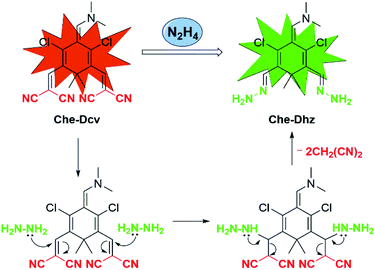
Based on the structural properties of Che-Dcv and reported literatures,29,34,38–46 we speculate that dicyanovinyl groups in Che-Dcv serve as not only the electron-withdrawing groups of the typical D–π–A structure but also the recognition sites for hydrazine. Accordingly, the proposed sensing mechanism is illustrated in Scheme 2. Upon the addition of hydrazine, the dicyanovinyl groups in Che-Dcv were attacked and the product hydrazone (Che-Dhz) was generated, thus triggering the disappearance of red fluorescence and appearance of strong green fluorescence observed.To further verify the detection mechanism, 1H NMR spectroscopic analysis of Che-Dcv was carried out before and after the addition of hydrazine. As shown in Fig. S8,† the protons of methyl (Ha) and dimethylamine (Hb) groups in Che-Dcv appeared at 1.25 and 3.25 ppm respectively. Upon addition of hydrazine to the DMSO-d6 solution of Che-Dcv, the proton signal of the methyl groups (Ha at δ 1.25 ppm) was divided into two single signals (Ha′ at δ 1.17 and Ha′′ at 1.61 ppm) and the proton signal of the dimethylamine group shifted from 3.25 (Hb) to 2.19 ppm (Hb′). At the same time, a new single peak appeared at 5.82 ppm (He′, ![[double bond, length as m-dash]](https://www.rsc.org/images/entities/char_e001.gif) N–NH2) indicated the formation of hydrazone. Additionally, when the reaction mixture of Che-Dcv and enough hydrazine was subjected to ESI-MS analysis, a peak at m/z 333.1359 which belonged to [Che-Dhz + NH4]+ (calculated: 333.1361) could be found (Fig. S9†). Taken together, these experimental results proved the formation of Che-Dhz and the sensing mechanism proposed.
N–NH2) indicated the formation of hydrazone. Additionally, when the reaction mixture of Che-Dcv and enough hydrazine was subjected to ESI-MS analysis, a peak at m/z 333.1359 which belonged to [Che-Dhz + NH4]+ (calculated: 333.1361) could be found (Fig. S9†). Taken together, these experimental results proved the formation of Che-Dhz and the sensing mechanism proposed.
Sensitive detection of hydrazine
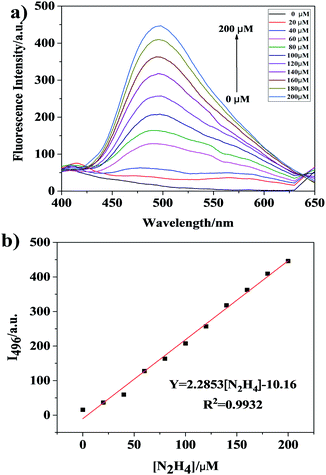
To investigate the sensitivity of Che-Dcv, fluorescence titration experiments of the probe with hydrazine were performed. As shown in Fig. 2a, the fluorescence intensity at 496 nm increased gradually with increasing hydrazine concentration. A good linear relationship (R2 = 0.9932) was observed between the fluorescence intensity and hydrazine concentration in the range of 0–200 μM (Fig. 2b). Under the experimental conditions, the detection limit (3σ/slope) of probe Che-Dcv towards hydrazine was determined to be 1.18 ppb which was much lower than the TLV (10 ppb) recommended by the EPA. The observed low detection limit indicated the potential of Che-Dcv for sensitive detection of hydrazine in aqueous solution.Selectivity studies
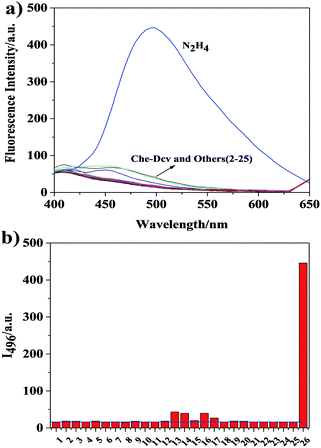
To evaluate the selectivity of Che-Dcv toward hydrazine, the fluorescence responses of the probe in the presence of various interfering analytes were measured. As shown in Fig. 3, environmentally and biologically important ions (K+, Ca2+, Fe3+, Cu2+, Mg2+, NH4+, Cl−, SO42−, NO2−, CO32−), amino acids (L-Ile, L-Phe, L-Pro, L-His, L-Arg, L-Lys), amines (ammonia, ethylenediamine) and hydrazine derivatives (isoniazid, acethydrazide) resulted in virtually no effect on the fluorescence of Che-Dcv. Only hydroxylamine, diethylamine, aniline and thiourea led to observable enhancement of fluorescence intensity, possibly due to their similar structures and reactivities with hydrazine. In contrast, hydrazine caused a significant increase (33 times) in fluorescence intensity of Che-Dcv in PBS buffer (containing 20% DMSO, pH = 7.4, 10 mM). All the results demonstrated the good specificity of Che-Dcv for practical detection of hydrazine in real environmental and biological samples.Effect of pH
It is well known that the specific reaction of hydrazine and dicyanovinyl group results from the strong nucleophilicity of hydrazine, we envision that the protonated form of hydrazine may hinder its reaction with dicyanovinyl group. Hence, it is necessary to explore the effect of pH on the fluorescence response of Che-Dcv to hydrazine. As shown in Fig. 4, the free probe Che-Dcv displayed almost no fluorescence at 496 nm in the wide pH range of 3.0–9.0.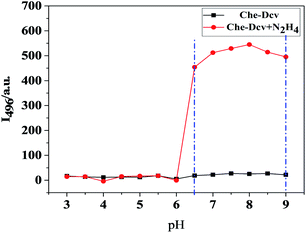 | ||
| Fig. 4 The effect of pH (3.0–9.0) on the fluorescence intensity at 496 nm of probe Che-Dcv (10 μM) in the absence or presence of N2H4 (200 μM). | ||
After the addition of 20 equiv. of hydrazine, the fluorescence intensity remained unchanged in the pH range of 3.0–6.0. When the pH value was raised to 6.5, the fluorescence intensity increased dramatically owning to the deprotonation of protonated hydrazine and the following reaction with dicyanovinyl groups. And in the pH range of 6.5–9.0, relatively stable fluorescence intensity was observed, indicating the potential of Che-Dcv to detect hydrazine in real samples, especially the biological samples.
Detection of hydrazine by test strips
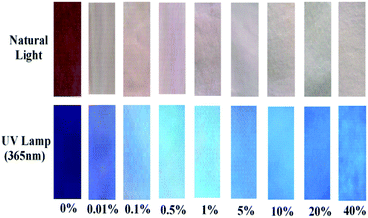
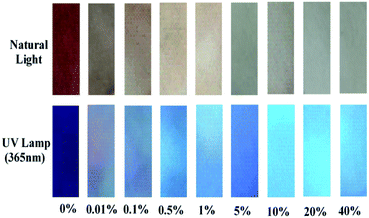
Encouraged by the high sensitivity and selectivity of probe Che-Dcv, we evaluated its potential for on-site visual detection of hydrazine in vapor phase or aqueous solution using probe-coated test papers. As shown in Fig. 5, the color of the test strips covered on the top of bottles changed from brown to white with the increasing concentration of hydrazine contained in the bottle, at the same time, the color change from dark purple to blue under UV lamp (365 nm) was observed. By contrast, the color of test strips remained almost unchanged after exposure to HCHO, HCl, CO2 and Et3N under either natural or UV light (Fig. 6). Then, the probe-coated test papers were immersed into hydrazine solutions (0.01–40%, w/w) and viewed after drying in the air. As illustrated in Fig. 7, the gradual color changes from brown to white under natural light and from dark purple to blue under UV light were observed. Taken together, the concentration of hydrazine in a sample could be roughly estimated according to the color change of Che-Dcv-coated test strips, providing an easy-to-use method for on-site detection of hydrazine in either vapor phase or aqueous solution.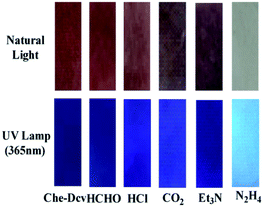 | ||
| Fig. 6 Color changes of Che-Dcv-coated test strips before and after exposure to different interfering gases (HCHO, Et3N, CO2, HCl) under natural light and UV lamp (365 nm). | ||
Cell imaging of hydrazine in living cells
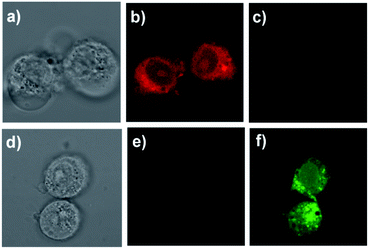
To evaluate the cytotoxicity of probe Che-Dcv, standard MTT assays were performed in H1975 cells and the results were illustrated in Fig. S10.† After the H1975 cells were incubated with increasing concentrations of Che-Dcv (0, 1, 2, 4, 8, 16 and 32 μM) for 24 h, the cell viability declined slowly. And the cell viability was still about 80% even the probe concentration was as high as 32 μM. These results suggested that Che-Dcv had good biocompatibility with living cells.Then, the ability of probe Che-Dcv for bioimaging of hydrazine in living cells was tested. As shown in Fig. 8, H1975 cells treated with 10 μM Che-Dcv for 4 h displayed an intense red fluorescence and a weak green fluorescence. When the Che-Dcv-pretreated cells were further cultured with 50 μM hydrazine for 15 min, the red fluorescence was diminished while the green fluorescence was enhanced significantly. These results were in accordance with the fluorescent behavior of Che-Dcv in solution and demonstrated its capability of visualizing hydrazine in living cells.
Conclusion
In summary, a new fluorescent probe Che-Dcv was designed and synthesized for the detection of hydrazine. With dicyanovinyl groups as the recognition sites, the probe responded to hydrazine sensitively and selectively with a color change from brown-red to yellow. The Stokes shift was calculated to be 146 nm. After being coated on filter paper strips, probe Che-Dcv could achieve on-site detection of hydrazine in either vapor phase or aqueous solution by color and fluorescence changes. In addition, this probe was successfully applied to imaging hydrazine in living H1975 cells. And more importantly, a new type of fluorophore with neither an aromatic nor a heteroaromatic ring is presented in this paper and its potential to fabricate practical fluorescent probes has been demonstrated. This strategy may broaden the scope of fluorophore and make the structures of fluorescent probes more devisable.Conflicts of interest
There are no conflicts to declare.Acknowledgements
This work was supported by the National Natural Science Foundation of China (No. 81130026).Notes and references
- J. Sanabria-Chinchilla, K. Asazawa, T. Sakamoto, K. Yamada, H. Tanaka and P. Strasser, J. Am. Chem. Soc., 2011, 133, 5425–5431 CrossRef CAS PubMed.
- R. Lan, J. T. S. Irvine and S. Tao, Int. J. Hydrogen Energy, 2012, 37, 1482–1494 CrossRef CAS.
- A. Serov and C. Kwak, Appl. Catal., B, 2010, 98, 1–9 CrossRef CAS.
- V. K. Gouda and S. M. Sayed, Corros. Sci., 1973, 13, 647–652 CrossRef CAS.
- I. C. Vieira, K. O. Lupetti and O. Fatibello-Filho, Anal. Lett., 2002, 35, 2221–2231 CrossRef CAS.
- U. Ragnarsson, Chem. Soc. Rev., 2001, 30, 205–213 RSC.
- J.-P. Schirmann and P. Bourdauducq, Hydrazine, Ullmann's Encyclopedia of Industrial Chemistry, Wiley-VCH Verlag GmbH & Co. KGaA, Weinheim, Germany, 2000 Search PubMed.
- S. Garrod, M. E. Bollard, A. W. Nicholls, S. C. Connor, J. Connelly, J. K. Nicholson and E. Holmes, Chem. Res. Toxicol., 2005, 18, 115–122 Search PubMed.
- B. Toth, Cancer Res., 1975, 35, 3693–3697 CAS.
- S. D. Zelnick, D. R. Mattie and P. C. Stepaniak, Aviat Space Environ. Med., 2003, 74, 1285–1291 CAS.
- US Environmental Protection Agency (EPA), Integrated Risk Information System (IRIS) on Hydrazine/Hydrazine Sulfate, National Center for Environmental Assessment, Office of Research and Development, Washington DC, 1999 Search PubMed.
- M. Strous and M. S. Jetten, Annu. Rev. Microbiol., 2004, 58, 99–117 CrossRef CAS PubMed.
- G. A. Ellard and P. T. Gammon, J. Pharmacokinet. Biopharm., 1976, 4, 83–113 CrossRef CAS PubMed.
- H. Singh, K. Tiwari, R. Tiwari, S. K. Pramanik and A. Das, Chem. Rev., 2019, 119, 11718–11760 CrossRef CAS PubMed.
- B. Roy and S. Bandyopadhyay, Anal. Methods, 2018, 10, 1117–1139 RSC.
- S. K. Manna, A. Gangopadhyay, K. Maiti, S. Mondal and A. K. Mahapatra, ChemistrySelect, 2019, 4, 7219–7245 CrossRef CAS.
- B. Liu, Q. Liu, M. Shah, J. Wang, G. Zhang and Y. Pang, Sens. Actuators, B, 2014, 202, 194–200 CrossRef CAS.
- M. G. Choi, J. O. Moon, J. Bae, J. W. Lee and S.-K. Chang, Org. Biomol. Chem., 2013, 11, 2961–2965 RSC.
- C. Hu, W. Sun, J. Cao, P. Gao, J. Wang, J. Fan, F. Song, S. Sun and X. Peng, Org. Lett., 2013, 15, 4022–4025 CrossRef CAS.
- Z. Lu, W. Fan, X. Shi, Y. Lu and C. Fan, Anal. Chem., 2017, 89, 9918–9925 CrossRef CAS PubMed.
- J. Zhang, L. Ning, J. Liu, J. Wang, B. Yu, X. Liu, X. Yao, Z. Zhang and H. Zhang, Anal. Chem., 2015, 87, 9101–9107 CrossRef CAS PubMed.
- Y. He, Z. Li, B. Shi, Z. An, M. Yu, L. Wei and Z. Ni, RSC Adv., 2017, 7, 25634–25639 RSC.
- B. Li, Z. He, H. Zhou, H. Zhang, W. Li, T. Cheng and G. Liu, Dyes Pigm., 2017, 146, 300–304 CrossRef CAS.
- A. K. Mahapatra, R. Maji, K. Maiti, S. K. Manna, S. Mondal, S. S. Ali, S. Manna, P. Sahoo, S. Mandal, M. R. Uddin and D. Mandal, RSC Adv., 2015, 5, 58228–58236 RSC.
- S. Goswami, K. Aich, S. Das, S. B. Roy, B. Pakhira and S. Sarkar, RSC Adv., 2014, 4, 14210–14214 RSC.
- S. Goswami, S. Paul and A. Manna, New J. Chem., 2015, 39, 2300–2305 RSC.
- C. Liu, F. Wang, T. Xiao, B. Chi, Y. Wu, D. Zhu and X. Chen, Sens. Actuators, B, 2018, 256, 55–62 CrossRef CAS.
- Y. Wang, H. Xiang, R. Zhao and C. Huang, Analyst, 2018, 143, 3900–3906 RSC.
- S. Goswami, S. Das, K. Aich, D. Sarkar and T. K. Mondal, Tetrahedron Lett., 2014, 55, 2695–2699 CrossRef CAS.
- S.-H. Guo, Z.-Q. Guo, C.-Y. Wang, Y. Shen and W.-H. Zhu, Tetrahedron, 2019, 75, 2642–2646 CrossRef CAS.
- Y. Hao, Y. Zhang, K. Ruan, W. Chen, B. Zhou, X. Tan, Y. Wang, L. Zhao, G. Zhang, P. Qu and M. Xu, Sens. Actuators, B, 2017, 244, 417–424 CrossRef CAS.
- L. Cui, C. Ji, Z. Peng, L. Zhong, C. Zhou, L. Yan, S. Qu, S. Zhang, C. Huang, X. Qian and Y. Xu, Anal. Chem., 2014, 86, 4611–4617 CrossRef CAS PubMed.
- Q. Wu, J. Zheng, W. Zhang, J. Wang, W. Liang and F. J. Stadler, Talanta, 2019, 195, 857–864 CrossRef CAS.
- M. Sun, J. Guo, Q. Yang, N. Xiao and Y. Li, J. Mater. Chem. B, 2014, 2, 1846–1851 RSC.
- J. Cui, L. Cao, G. Wang, W. Ji, H. Nie, C. Yang and X. Zhang, Anal. Methods, 2019, 11, 5023–5030 RSC.
- F. Ali, H. A. Anila, N. Taye, D. G. Mogare, S. Chattopadhyay and A. Das, Chem. Commun., 2016, 52, 6166–6169 RSC.
- B. Roy, S. Halder, A. Guha and S. Bandyopadhyay, Anal. Chem., 2017, 89, 10625–10636 CrossRef CAS.
- R. Zhang, C.-J. Zhang, Z. Song, J. Liang, R. T. K. Kwok, B. Z. Tang and B. Liu, J. Mater. Chem. C, 2016, 4, 2834–2842 RSC.
- J. Fan, W. Sun, M. Hu, J. Cao, G. Cheng, H. Dong, K. Song, Y. Liu, S. Sun and X. Peng, Chem. Commun., 2012, 48, 8117–8119 RSC.
- S. Goswami, S. Paul and A. Manna, RSC Adv., 2013, 3, 18872–18877 RSC.
- X.-X. Zheng, S.-Q. Wang, H.-Y. Wang, R.-R. Zhang, J.-T. Liu and B.-X. Zhao, Spectrochim. Acta, Part A, 2015, 138, 247–251 CrossRef CAS.
- S. I. Reja, N. Gupta, V. Bhalla, D. Kaur, S. Arora and M. Kumar, Sens. Actuators, B, 2016, 222, 923–929 CrossRef CAS.
- Shweta, A. Kumar, Neeraj, S. K. Asthana, A. Prakash, J. K. Roy, I. Tiwari and K. K. Upadhyay, RSC Adv., 2016, 6, 94959–94966 RSC.
- X. Yang, Y. Liu, Y. Wu, X. Ren, D. Zhang and Y. Ye, Sens. Actuators, B, 2017, 253, 488–494 CrossRef CAS.
- Y.-D. Lin and T. J. Chow, RSC Adv., 2013, 3, 17924–17929 RSC.
- J. Qiu, Y. Chen, S. Jiang, H. Guo and F. Yang, Analyst, 2018, 143, 4298–4305 RSC.
- N. Narayanan and G. Patonay, J. Org. Chem., 1995, 60, 2391–2395 CrossRef CAS.
- S. Luo, X. Tan, S. Fang, Y. Wang, T. Liu, X. Wang, Y. Yuan, H. Sun, Q. Qi and C. Shi, Adv. Funct. Mater., 2016, 26, 2826–2835 CrossRef CAS.
- R. E. Mewshaw, Tetrahedron Lett., 1989, 30, 3753–3756 CrossRef CAS.
- A. R. Katritzky and C. M. Marson, J. Org. Chem., 1987, 52, 2726–2730 CrossRef CAS.
Footnote |
| † Electronic supplementary information (ESI) available. See DOI: 10.1039/c9ra10882c |
| This journal is © The Royal Society of Chemistry 2020 |

