 Open Access Article
A nine-fold enhancement of visible-light photocatalytic hydrogen production of g-C3N4 with TCNQ by forming a conjugated structure†
Fengzhi Wang,
Weisheng Lei,
Xinhua Pan *,
Bin Lu and
Zhizhen Ye
State Key Laboratory of Silicon Materials, School of Materials Science and Engineering, Zhejiang University, Hangzhou 310027, People's Republic of China. E-mail: panxinhua@zju.edu.cn; Fax: +86 571 87952124; Tel: +86 571 87952187
First published on 27th May 2020
Abstract
Photocatalytic hydrogen evolution by water splitting has become a very effective way to solve the energy crisis. For use in that process, graphitic carbon nitride (g-C3N4) has drawn much attention for its response in the visible region. However, its insufficient sunlight absorption efficiency and easy recombination of photoinduced carriers restrict its photocatalytic activity. Herein, we demonstrate a two-step liquid ultrasonic method in water to synthesize a series of tetracyanoquinodimethane (TCNQ)–C3N4 photocatalysts aiming to form a conjugated structure by 7,7,8,8-TCNQ. g-C3N4 was treated with APTES firstly on its surface in order to give a better interface contact with TCNQ. Benefiting from the conjugation effect between TCNQ and g-C3N4, the separation and transport efficiency of photogenerated carriers were significantly improved. Besides, introducing TCNQ also broadened the absorption region. Both of these points lead to the enhancement of photocatalytic H2 production rate, with the optimized 5% TCNQ–C3N4 giving a rate nearly 9.48 times that of pure g-C3N4. Also, 5% TCNQ–C3N4 (U) was prepared with unmodified g-C3N4, which exhibited a rate only 6.87 times that of pure g-C3N4, thus validating the necessity of surface modification. Our work reveals that the rational conjugated structure could modulate the electrical and optical properties of g-C3N4, yielding an improvement of photocatalytic activities.
1. Introduction
The energy crisis has become a serious problem which threatens human development.1 Photocatalytic technology is known as an effective solution for producing hydrogen, reducing carbon nitride and degrading organic dyes, and photocatalytic hydrogen evolution has attracted much attention.2–5 Among various photocatalysts, graphitic carbon nitride (g-C3N4), which is considered as a kind of typical metal-free organic semiconductor, has been widely investigated as a promising photocatalyst in H2 production by water splitting because of its favorable bandgap (2.7 eV) corresponding well with visible-light response, excellent thermal stability, low cost and nontoxicity characteristics. Nonetheless, the fast recombination of photogenerated electron–hole pairs and narrow absorption in the visible region (up to 460 nm) limit its application.3,6–8 Therefore, various modification methods of g-C3N4 have been developed aiming to promote its photocatalytic performance, such as chemical heteroatom doping (B, S, and P),9–12 morphology control,13,14 dye sensitization,15–18 defect engineering, and g-C3N4 heterojunctions.2Herein, we introduce a highly conjugated polymer, TCNQ (7,7,8,8-tetracyanoquinodimethane), with plenty of cyano groups.19 Many works have confirmed that TCNQ has strong π–π stacking interactions with carbon nanotubes and graphene. The conjugative π-electron structures of polymer hybridized photocatalysts exhibit elevated photoactivity because of rapid photogenerated charger transfer.19–21 Although conjugated polymers have been demonstrated to form polymer/C3N4 heterojunctions,22–30 there are few researches which have applied TCNQ on pure g-C3N4 for hydrogen generation utilizing water splitting with visible light.
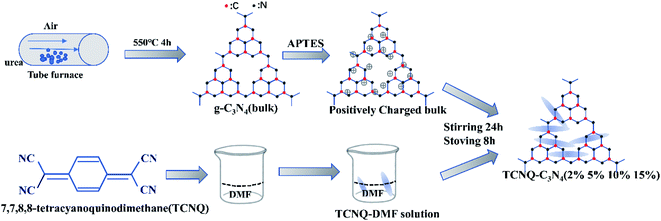
To reinforce the interfacial contact between g-C3N4 and TCNQ, the cationic surfactant 3-aminopropyltriethoxysilane (C9H23NO3Si, APTES) was utilized to change the negative charge of the g-C3N4 surface into positive charge,31 which intensifies the integration of negative TCNQ with g-C3N4 using an electrostatic self-assembly approach.
In this study, we report TCNQ–C3N4 composites with a good interfacial contact achieved by surface modification. The g-C3N4 synthesized by condensation at high temperature was surface-charge-modified by APTES to get positive charges. Then, the positively charged g-C3N4 was interacted with TCNQ which has negative charges. After that, the photocatalytic H2 production rates from water of as-synthesized (2%, 5%, 10%, 15%) TCNQ–C3N4 composites with different doses of TCNQ were investigated under visible light irradiation. All the TCNQ–C3N4 photocatalysts show a higher H2 evolution rate than pure C3N4, which is ascribed to the broader response in the visible region and faster transfer of photogenerated electron–hole pairs. The hydrogen production rate of 5% TCNQ–C3N4 reaches 425.64 μmol g−1 h−1, which is 9.48 times higher than that of pure g-C3N4. Besides, the photocatalytic performance of 5% TCNQ–C3N4 (U) composed of TCNQ and unmodified g-C3N4 was also studied for the same experimental conditions, which exhibits a poorer H2 production rate than the 5% TCNQ–C3N4 composite, thus confirming the necessity of surface charge modification for electrostatic interaction between TCNQ and g-C3N4. This work might offer a new insight into improving the photoactivity of g-C3N4 via surface modification and constructing conjugated structures.32
2. Experimental
2.1 Materials
Urea (H2NCONH2), barium sulfate (BaSO4), anhydrous sodium sulfate (Na2SO4), N,N-dimethylformamide (DMF), and ethanol (C2H6O) were purchased from Sinopharm. APTES (C9H23NO3Si) and TCNQ were purchased from Aladdin. All the materials were used without any further purification.2.2 Preparation of g-C3N4 (bulk)
Pure g-C3N4 (bulk) was obtained by thermal polycondensation of carbamide in air atmosphere. The typical preparation method of g-C3N4 (bulk) was as follows: 5 g of carbamide was put in a tube furnace, followed by heating to 550 °C for 4 hours to complete the reaction. The heating rate was 2.3 °C min−1.2.3 Synthesis of APTES-modified g-C3N4 (bulk)
The as-prepared g-C3N4 (bulk) was modified with APTES as follows. Firstly, 0.5 g of g-C3N4 (bulk) was dispersed in 200 mL of ethanol followed by ultrasonic agitation for 20 min. After that, 0.5 mL of APTES was added into the solution, and the obtained mixture was subjected to a reflux operation for 4 h at 65 °C. Lastly, the solution was centrifuged and washed with ethanol, followed by drying at 60 °C for 12 hours to obtain the APTES-modified g-C3N4 (bulk).2.4 Synthesis of TCNQ–C3N4 composite photocatalysts
The TCNQ–C3N4 composites were synthesized by a liquid ultrasonic agitation method in deionized water as shown in Fig. 1. Firstly, the appropriate amount of g-C3N4 (bulk) was added into deionized water and subsequently treated with ultrasonic agitation for 3 hours to get a homogeneous dispersed solution of g-C3N4. A pre-prepared TCNQ–DMF solution with a concentration of 5 mg mL−1 was added into the mixture above. Then, the mixture was treated by ultrasonication for an hour and stirring for 24 hours, followed by drying at 80 °C after volatilizing the solvent. Finally, photocatalysts with various mass ratios of TCNQ–C3N4 from 2% to 15% were synthesized, and named as (2%, 5%, 10%, 15%) TCNQ–C3N4. Besides, a control sample was prepared with unmodified g-C3N4 and TCNQ in the same way, aiming to investigate the effect of modification with APTES, which was named as 5% TCNQ–C3N4 (U). In all the analyses described below, we abbreviated the samples as bulk, 2%, 5%, 10%, 15% and 5% (U), respectively.2.5 Characterization of the photocatalysts
Zeta potentials of pure g-C3N4 (bulk), g-C3N4 (APTES), and TCNQ dispersed in aqueous solutions at pH = 6.5 were tested using a Zetasizer3000HSA analyzer (Malvern Instruments). Scanning electron microscopy (SEM, Hitachi S-4800) and high-resolution transmission electron microscopy (HRTEM, JEM-2100) were carried out to explore the morphologies of the samples. Powder X-ray diffraction (XRD) patterns of all samples were measured using an X'Pert powder diffractometer with Cu Kα radiation (λ = 0.15418 nm). Fourier transform infrared (FT-IR) spectroscopy was performed with a Tensor 27 FT-IR spectrometer at a resolution of 4 cm−1, which was utilized to confirm the characteristic functional groups and the conjugated structures of the composites. Electron paramagnetic resonance (EPR) spectra were obtained with a Bruker model ESRA-300 spectrometer at ambient temperature. X-ray photoelectron spectroscopy (XPS) was performed with a monochromatic Al Kα radiation source (Kratos AXIS Supra). UV-visible diffuse reflectance spectroscopy (DRS) was conducted with a Shimadzu UV-3600 spectrophotometer.Photoelectrochemical measurements were carried out using a CHI760B workstation (Chenhua Instrument) with a three-electrode cell (Pt plate as the counter electrode and Ag/AgCl as the reference electrodes, and 0.5 M Na2SO4 solution as the supporting electrolyte). A 300 W Xe lamp (Perfectlight Co., Beijing, China) with a cutoff channel (AM1.5G) served as the simulated solar light source. The working electrodes were fabricated as follows: 20 mg of each photocatalysts was separately dispersed in 20 μL Nafion (5%) aqueous solution and 500 μL ethanol to make a slurry by ultrasonication, which was dip-coated on conductive fluorine tin oxide glass substrates to produce electrodes with ca. 0.8 cm2 of active area. These electrolytes were dried completely overnight. The photocurrent intensity measurement was taken at 0 V versus Ag/AgCl with the light on and off. Electrochemical impedance spectroscopy (EIS) was conducted with an AC voltage of 10 mV amplitude in a frequency range of 10−2–106 Hz under an open circuit potential.
2.6 Photocatalytic H2 production performance
The photocatalytic hydrogen evolution activities of the different photocatalysts were determined in a quartz reaction vessel connected with a glass closed gas circulation system. Normally, 10 mg of catalyst powder was dispersed in 30 mL (5 mL methyl alcohol as hole scavenger, 1 wt% Pt as cocatalyst) aqueous solution. The aqueous reactant mixture was irradiated under visible light using a 300 W xenon lamp (Perfectlight Co., Beijing, China) with a 400 nm cutoff filter. During the photocatalytic process, the suspension was kept at room temperature by flowing cooling water. The produced H2 gas was extracted every half an hour and measured by an online gas chromatograph (FULI 9790) using a thermal conductivity detector and Ar gas carrier. In addition, apparent quantum yield (AQY) measurements were carried out by using a multichannel photochemical reaction system (PCX50B Discover, Perfectlight, Beijing) with monochromatic light (λ = 365, 420, 450, 485, 535, 595, 630 nm). The AQY value was calculated by eqn (1):
 | (1) |
3. Results and discussion
3.1 Synthesis and characterization of C3N4–TCNQ
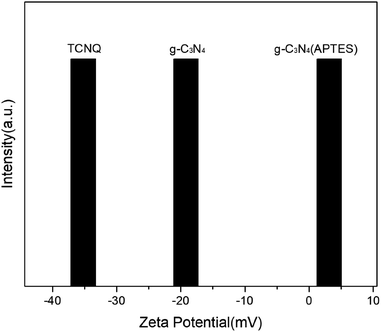
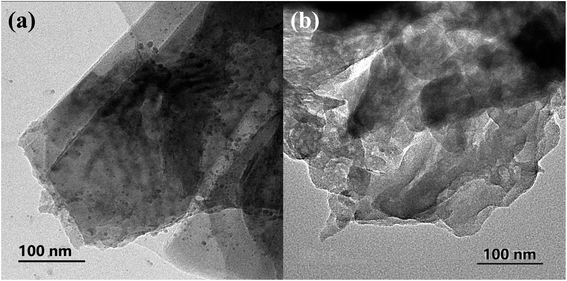
Zeta potential analysis was carried out to investigate the superiority of surface modification in deionized water at pH value of 6.5 for TCNQ, g-C3N4 (bulk) and g-C3N4 (APTES), as shown in Fig. 2. The zeta potential of TCNQ is −35.2 mV which is ascribed to the abundant cyano groups on its surface, while the zeta potential of g-C3N4 (bulk) is −19.2 mV. Apparently, it goes without saying that it is somewhat difficult to make a favorable surface interaction by mechanical agitation when the g-C3N4 (bulk) and TCNQ have the same electrical properties. After modification with APTES, g-C3N4 (APTES) shows a zeta potential of +3.14 mV, which could help form an electrostatic attractive interaction by electrostatic assembly when TCNQ and modified g-C3N4 (bulk) are stirred in aqueous solution.The morphologies of the synthesized photocatalysts were scrutinized by field emission SEM and HRTEM. As shown in the HRTEM images of bulk g-C3N4 and 5% TCNQ–C3N4 photocatalyst in Fig. 3, there are lamellar nanosheets without obvious crystal structure due to the intrinsic amorphous phase of graphitic carbon nitride. The bulk g-C3N4 displayed big and smooth layer sheets, while 5% TCNQ–C3N4 composite presented thin and unfolded flake sheets with many wrinkles. As shown in Fig. S1,† the series of g-C3N4 have very similar stacking lamellar structures, and TCNQ was larger than any other samples. After modification with APTES, g-C3N4 (APTES) shows similar structures as pure g-C3N4 (bulk), while the same thing happens with (2%, 5%, 10%, 15%) TCNQ–C3N4, as shown in Fig. S1(d–g),† which provides plenty of active sites that originated from more g-C3N4 hybridizing with TCNQ on the surface.
The XRD patterns of g-C3N4 (bulk), g-C3N4 (APTES) and (2%, 5%, 10%, 15%) TCNQ–C3N4 are shown in Fig. 4, indicating that the crystal phase of pure graphitic carbon nitride does not change on modification with APTES or loading with TCNQ. Notably, the obvious diffraction peaks of g-C3N4 (bulk) in Fig. 4(a) are observed at 13.1° and 27.7° corresponding to the (100) and (002) facets (PDF no. 87-1526, JCPDS), respectively. In addition, the peak at 13.1° is attributed to the repeated facet of tri-s-triazine units, while that at 27.7° arises from the interplanar stacking of π-conjugated system. After surface modification, g-C3N4 (APTES) which is abbreviated as (APTES) in Fig. 4(a) exhibits the characteristic peaks at the same positions, thus indicating that surface treatment does not alter the crystalline structure. From Fig. 4(b), only the intensities of the 27.7° peak are improved with increasing content of TCNQ, thus suggesting that TCNQ–C3N4 composites are successfully synthesized having consistent crystal structure without lattice expansion.
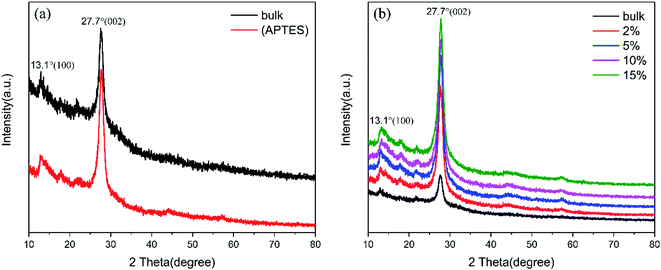 | ||
| Fig. 4 XRD patterns: (a) g-C3N4 (bulk) and g-C3N4 (APTES); (b) g-C3N4 (bulk) and (2%, 5%, 10%, 15%) TCNQ–C3N4. | ||
The chemical structures of g-C3N4 (bulk) and (2%, 5%, 10%, 15%) TCNQ–C3N4 were investigated by FT-IR spectroscopy (Fig. 5). For pristine g-C3N4, a series of peaks at 1200 cm−1 to 1650 cm−1 belonged to the characteristic stretching vibration of C–N heterocycles, and the sharp peak at 811 cm−1 was attributed to the out-of-plane breathing mode of s-triazine units. A vibration peak of TCNQ was clearly observed at 2223 cm−1, which originated from the stretching of C![[triple bond, length as m-dash]](https://www.rsc.org/images/entities/char_e002.gif) N, while similar peaks also appeared in the spectra of the TCNQ–C3N4 composites. Obviously, the stretching of C–N heterocycles and the breathing mode of triazine units in TCNQ–C3N4 became weaker as shown in Fig. 5(a), suggesting the formation of intermolecular interactions between carbon nitride and TCNQ to construct rigid conjugated structures.27 Besides, the vibration band at 1635 cm−1 of pure g-C3N4 shifted to 1640 cm−1 in the spectra of TCNQ–C3N4 composites as shown in Fig. 5(b), which indicated that charges may transfer from g-C3N4 to TCNQ.28 And, a stronger EPR intensity of 5% TCNQ–C3N4 compared with bulk g-C3N4 is observed in Fig. S2,† revealing a higher concentration of unpaired electrons, which was attributed to the cyano groups in TCNQ.
N, while similar peaks also appeared in the spectra of the TCNQ–C3N4 composites. Obviously, the stretching of C–N heterocycles and the breathing mode of triazine units in TCNQ–C3N4 became weaker as shown in Fig. 5(a), suggesting the formation of intermolecular interactions between carbon nitride and TCNQ to construct rigid conjugated structures.27 Besides, the vibration band at 1635 cm−1 of pure g-C3N4 shifted to 1640 cm−1 in the spectra of TCNQ–C3N4 composites as shown in Fig. 5(b), which indicated that charges may transfer from g-C3N4 to TCNQ.28 And, a stronger EPR intensity of 5% TCNQ–C3N4 compared with bulk g-C3N4 is observed in Fig. S2,† revealing a higher concentration of unpaired electrons, which was attributed to the cyano groups in TCNQ.
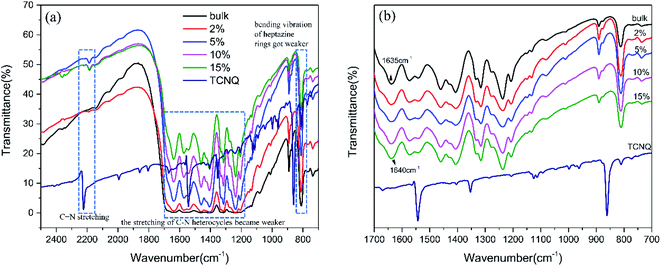 | ||
| Fig. 5 FT-IR spectra in the regions (a) 2500 to 700 cm−1 and (b) 1700 to 700 cm−1 of g-C3N4 (bulk) and (2%, 5%, 10%, 15%) TCNQ–C3N4. | ||
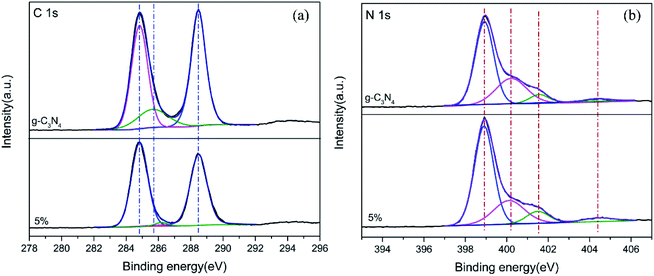
To confirm the surface interfacial interactions and to elucidate the corresponding chemical states of the photocatalysts, XPS analysis was performed for g-C3N4 (bulk) and 5% TCNQ–C3N4, as shown in Fig. 6. As seen in the C 1s XPS spectra of Fig. 6(a), three photoelectron peaks are present at binding energies of 284.8 eV, 285.6 eV and 288.4 eV, which are assigned to residual C, sp3-coordinated carbon nitride (C–N) and sp2-bonded C in the C–N heterocycle, respectively.32 Moreover, the C 1s XPS peaks of 5% TCNQ–C3N4 are fitted to three positions at 284.8 eV, 286.1 eV and 288.5 eV, with the 286.1 eV peak being associated with –C![[triple bond, length as m-dash]](https://www.rsc.org/images/entities/char_e002.gif) N.33 The binding energy shifts in the binary hybrids are ascribed to an intense interaction between the two components.34 Besides, the peak area of the 286.1 eV peak exhibited a decrease which may be attributed to the sp3 hybridization transforming to sp2 hybridization. For the N 1s XPS spectrum of g-C3N4 (bulk) in Fig. 6(b), four peaks are observed at 398.9 eV, 400.2 eV, 401.5 eV and 404.4 eV which can be attributed to the sp2-bonded N (C–N
N.33 The binding energy shifts in the binary hybrids are ascribed to an intense interaction between the two components.34 Besides, the peak area of the 286.1 eV peak exhibited a decrease which may be attributed to the sp3 hybridization transforming to sp2 hybridization. For the N 1s XPS spectrum of g-C3N4 (bulk) in Fig. 6(b), four peaks are observed at 398.9 eV, 400.2 eV, 401.5 eV and 404.4 eV which can be attributed to the sp2-bonded N (C–N![[double bond, length as m-dash]](https://www.rsc.org/images/entities/char_e001.gif) C) in the C–N heterocycle, tertiary N bonded to carbon atoms in the form of N–C3, amino groups (C–N–H) and π excitations respectively.35 Similarly, the binding energies of N 1s for 5% TCNQ–C3N4 shift to higher values by ca. 0.2 eV, which is attributed to the strong interactions between TCNQ and carbon nitride.32
C) in the C–N heterocycle, tertiary N bonded to carbon atoms in the form of N–C3, amino groups (C–N–H) and π excitations respectively.35 Similarly, the binding energies of N 1s for 5% TCNQ–C3N4 shift to higher values by ca. 0.2 eV, which is attributed to the strong interactions between TCNQ and carbon nitride.32
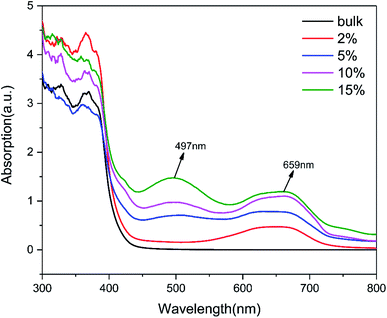
The photo-absorption properties of g-C3N4 (bulk) and (2%, 5%, 10%, 15%) TCNQ–C3N4 were investigated by UV-visible absorption spectra, as shown in Fig. 7. The g-C3N4 (bulk) exhibited negligible absorption above 400 nm, while (2%, 5%, 10%, 15%) TCNQ–C3N4 photocatalysts displayed obvious absorption in the visible light region. Remarkably, two charge-transfer bands of the TCNQ–C3N4 composites were observed at 497 nm and 659 nm, which were enhanced with increasing content of TCNQ. This may be attributed to the intense conjugation effect of cyano groups derived from TCNQ in the TCNQ–C3N4 composites, thereby producing more photoinduced carriers and improving the photosensitivity under visible light.
3.2 Photocatalytic performance
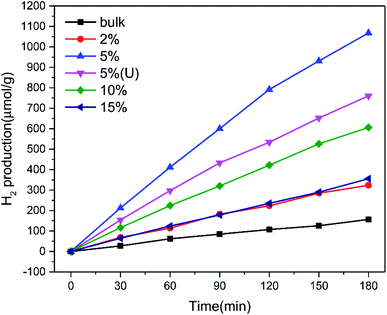
The photocatalytic hydrogen production rate of the pure graphitic carbon nitride and TCNQ–C3N4 composites was measured using methanol as sacrificial agent to quench generated holes during the photocatalytic process under visible light illumination (λ ≥ 400 nm). As displayed in Fig. 8, the TCNQ–C3N4 composites gave higher hydrogen production rates than pure g-C3N4 (bulk), with pure g-C3N4 (bulk) exhibiting a low H2 production rate of 44.92 μmol g−1 h−1. The enhanced hydrogen production rates could be attributed to the abundant cyano groups which were introduced into the TCNQ–C3N4 conjugated structures, thus broadening the visible-light absorption region and improving the separation efficiency of photogenerated carriers. Apparently, 5% TCNQ–C3N4 presented the highest H2 evolution rate of 425.64 μmol g−1 h−1, which was 9.48 times higher than that of the pure g-C3N4. Further increasing the content of TCNQ results in a decrease in photoactivity of the TCNQ–C3N4 composites, meaning that the yield of H2 does not increase linearly with the content of TCNQ. It was found that further increasing the mass ratios of the TCNQ beyond the optimized ratio at 5% led to a decrease in the photoactivity. This could be attributed to excess TCNQ not only leading to fewer reaction sites but also causing less light to enter into the suspension system. Besides, we also carried out the hydrogen evolution experiment with 5% TCNQ–C3N4 (U) aiming to confirm the necessity of surface modification of g-C3N4. Not surprisingly, 5% TCNQ–C3N4 (U) showed a lower H2 evolution rate of 308.64 μmol g−1 h−1, which was lower than that of 5% TCNQ–C3N4, being only 6.87 times higher than that of pure g-C3N4.Moreover, we compared the DRS and wavelength-dependent AQY for the 5% TCNQ–C3N4 photocatalyst under various monochromatic light illuminations, which exhibited the best hydrogen production performance among as-synthesized samples. As shown in Fig. 9, the AQY values were in accordance with the changing curve of the DRS line. The highest value among the different monochromatic light wavelengths was at 595 nm with the AQY reaching 1.79%. Besides, AQY values of 0.34, 0.50, 0.48, 0.30, 0.50, and 0.16% were obtained under λ = 365, 420, 450, 485, 535, and 630 nm monochromatic illumination for 5% TCNQ–C3N4, respectively.
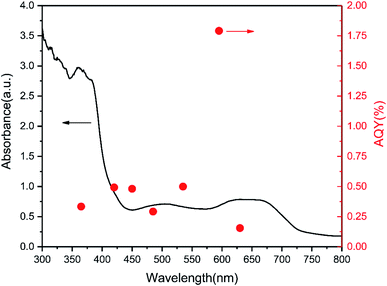 | ||
| Fig. 9 Wavelength-dependent AQY and DRS of 5% TCNQ–C3N4 (λ = 365, 420, 450, 485, 535, 595 and 630 nm). | ||
3.3 Photoelectrochemical properties
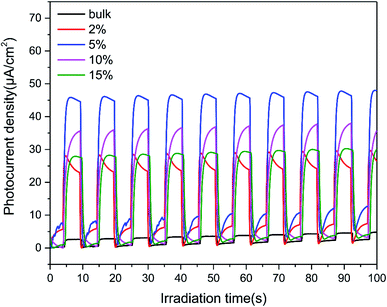
To further investigate the charge-transfer properties of the TCNQ–C3N4 composites, transient photocurrent measurements were carried out. As seen from Fig. 10, all TCNQ–C3N4 electrodes showed significantly higher photocurrent density compared with the pure g-C3N4 (bulk) during on/off irradiation cycles, which agrees with their photocatalytic H2 production performance. As expected, 5% TCNQ–C3N4 showed the highest photocurrent response of 45.85 μA cm−2, nearly 17.24 times as high as that of pristine g-C3N4 (bulk) of 2.66 μA cm−2, reflecting a better light response and more efficient separation of photoinduced electrons and holes. The higher transfer and separation efficiency of photoinduced carriers and the broader visible-light responses are caused by the interaction between TCNQ and g-C3N4, as a result of the strongly conjugated structure.Beyond that, the transfer efficiency of photogenerated electrons was further confirmed by the EIS results as shown in Fig. 11. The Nyquist plots for 5% TCNQ–C3N4 showed the minimal semicircle arc at high frequencies compared to the other samples, validating the reduced charge-transfer resistance and fast interfacial electron transfer of the 5% TCNQ–C3N4 system.
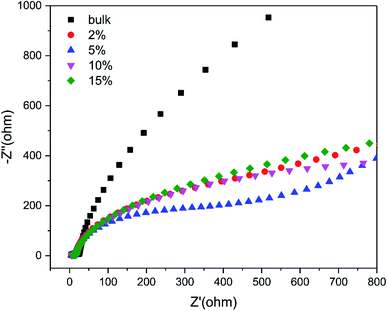 | ||
| Fig. 11 EIS Nyquist plots of g-C3N4 (bulk) and (2%, 5%, 10%, 15%) TCNQ–C3N4 at open circuit voltage of 10 mV. | ||
3.4 Possible photocatalytic mechanism
On the basis of the above analyses, a possible mechanism for the enhanced photocatalytic performance of the TCNQ–C3N4 composites could be proposed as shown in Fig. 12. In fact, both g-C3N4 and TCNQ can generate electrons and holes under visible light. It is regrettable that generated photocarriers are easily recombined in g-C3N4, which limits its photoactivity. In the present work, the TCNQ–C3N4 composites were successfully prepared via the intermolecular interaction between TCNQ and g-C3N4. Since both materials possess plenty of delocalized conjugated π-electrons, this allows the construction of strongly conjugated structures in order to transfer electrons, which has been confirmed by FT-IR analysis (Fig. 5). Therefore, the improvement of the photocatalytic performance is attributed to the interactions of π-conjugated electrons in the Z-scheme.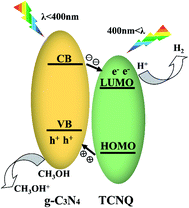 | ||
| Fig. 12 Schematic band structure and photoinduced charge transfer of TCNQ–C3N4 under visible light irradiation. | ||
In parallel, new absorption peaks appear in the visible region at 497 nm and 659 nm, whose intensities become stronger with increasing content of TCNQ, contributing to improve the utilization of visible light and enhance the photocatalytic activity of the TCNQ–C3N4 composites. This result reveals that inducing TCNQ could improve the optical absorption intensity in the visible-light region of g-C3N4.
We speculate that the electrons would be excited to the conduction band (CB) of g-C3N4 from its valence band (VB), and then transferred to the LUMO of TCNQ, leaving the holes in the VB of g-C3N4, as shown in Fig. 12. Meanwhile, the holes in the VB of g-C3N4 are consumed by methyl alcohol, thus resulting in efficient separation of photogenerated carriers in TCNQ–C3N4 and a much enhanced photocatalytic performance.26–28 However, excess TCNQ would reduce the photoactivities of the composites due to fewer reaction sites and less incident light acting on the surface of g-C3N4.
In general, the remarkably improved photocatalytic H2 production performance of TCNQ–C3N4 is mainly ascribed to the introduction of TCNQ, which not only enhances the photo-absorption but also promotes the separation of photoinduced holes and electrons effectively.
4. Conclusions
In conclusion, a series of TCNQ–C3N4 photocatalysts were synthesized via a two-step liquid ultrasonic method in water by modifying the surface of graphitic carbon nitride with APTES, which leads to excellent photocatalytic H2 evolution performance. The optimum photocatalytic H2 production rate of 5% TCNQ–C3N4 (425.64 μmol g−1 h−1) is nearly 9.48 times higher than that of pure g-C3N4 (bulk) (44.92 μmol g−1 h−1), while that of 5% TCNQ–C3N4 (U) (308.64 μmol g−1 h−1) is about 6.87 times higher than that of pure carbon nitride, thus confirming the importance of surface modification. In that way, the main reason for the improvement of H2 production is ascribed to the construction of a strongly conjugated structure, which efficiently promotes the separation of photoinduced carriers and widely broadens the absorption in the visible-light region, thus boosting photocatalytic activity. All in all, this work demonstrates the construction of molecular conjugated structures between TCNQ and graphitic carbon nitride, putting forward a new insight into promising conjugation effects in photocatalytic performance.Conflicts of interest
There are no conflicts to declare.Acknowledgements
This work was supported by National Natural Science Foundation of China under grant no. 51972283 and 91833301, and Zhejiang Provincial Natural Science Foundation of China under grant no. LY17E020005.References
- R. Asahi, T. Morikawa, H. Irie and T. Ohwaki, Chem. Rev., 2014, 114, 9824–9852 CrossRef CAS PubMed.
- J. Chen, C. Dong, D. Zhao, Y. Huang, X. Wang, L. Samad, L. Dang, M. Shearer, S. Shen and L. Guo, Adv. Mater., 2017, 29, 1606198 CrossRef PubMed.
- S. Chu, Y. Wang, Y. Guo, J. Feng, C. Wang, W. Luo, X. Fan and Z. Zou, ACS Catal., 2013, 3, 912–919 CrossRef CAS.
- Z. Lou, Y. Li, L. Zhu, W. Xie, W. Niu, H. Song, Z. Ye and S. Zhang, J. Mater. Chem. A, 2017, 5(6), 2732–2738 RSC.
- A. Fujishima and K. Honda, Nature, 1972, 238, 37–38 CrossRef CAS PubMed.
- X. Wang, K. Maeda, A. Thomas, K. Takanabe, G. Xin, J. Carlsson, K. Domen and M. Antonietti, Nat. Mater., 2009, 8, 76–80 CrossRef CAS PubMed.
- W. J. Ong, L. L. Tan, Y. H. Ng, S. T. Yong and S. P. Chai, Chem. Rev., 2016, 116, 7159–7329 CrossRef CAS PubMed.
- H. Wang, L. Zhang, Z. Chen, J. Hu, S. Li, Z. Wang, J. Liu and X. Wang, Chem. Soc. Rev., 2014, 43, 5234–5244 RSC.
- X. Han, C. Yao, A. Yuan, F. Xi, X. Dong and J. Liu, Mater. Res. Bull., 2018, 107, 477–483 CrossRef CAS.
- S. Yan, Z. Li and Z. Zou, Langmuir, 2010, 26, 3894–3901 CrossRef CAS PubMed.
- K. Wang, J. Fu and Y. Zheng, Appl. Catal., B, 2019, 254, 270–282 CrossRef CAS.
- J. Ran, T. Ma, G. Gao, X. Du and S. Qiao, Energy Environ. Sci., 2015, 8, 3708–3717 RSC.
- Z. Huang, F. Li, B. Chen, T. Lu, Y. Yuan and G. Yuan, Appl. Catal., B, 2013, 136–137, 269–277 CrossRef CAS.
- M. Shalom, S. Inal, C. Fettkenhauer, D. Neher and M. Antonietti, J. Am. Chem. Soc., 2013, 135, 7118–7121 CrossRef CAS PubMed.
- S. Kushwaha and L. Bahadur, J. Lumin., 2015, 161, 426–430 CrossRef CAS.
- Z. Li, Y. Wu and G. Lu, Appl. Catal., B, 2016, 188, 56–64 CrossRef CAS.
- K. Takanabe, K. Kamata, X. Wang, M. Antonietti, J. Kubota and K. Domen, Phys. Chem. Chem. Phys., 2010, 12, 13020–13025 RSC.
- Y. Zheng, J. Liu, J. Liang, M. Jaroniec and S. Qiao, Energy Environ. Sci., 2012, 5, 6717 RSC.
- X. Guegano, A. Kanibolotsky, C. Blum, S. Mertens, S. Liu, A. Neels, H. Hagemann, P. Skabara, S. Leutwyler, T. Wandlowski, A. Hauser and S. Decurtins, Chemistry, 2009, 15, 63–66 CrossRef CAS PubMed.
- J. Lu, X. Qu, G. Peleckis, J. Boas, A. Bond and L. Martin, J. Org. Chem., 2011, 76, 10078–10082 CrossRef CAS PubMed.
- X. Mei and J. Ouyang, Langmuir, 2011, 27, 10953–10961 CrossRef CAS PubMed.
- J. Chen, X. Tao, L. Tao, H. Li, C. Li, X. Wang, C. Li, R. Li and Q. Yang, Appl. Catal., B, 2019, 241, 461–470 CrossRef CAS.
- X. Han, D. Xu, L. An, C. Hou, Y. Li, Q. Zhang and H. Wang, Appl. Catal., B, 2019, 243, 136–144 CrossRef CAS.
- S. Patra, S. Rahut and J. Basu, New J. Chem., 2018, 42, 18598–18607 RSC.
- R. Sprick, J. Jiang, B. Bonillo, S. Ren, T. Ratvijitvech, P. Guiglion, M. Zwijnenburg, D. Adams and A. Cooper, J. Am. Chem. Soc., 2015, 137, 3265–3270 CrossRef CAS PubMed.
- F. Yang, F. Xia, J. Hu, C. Zheng, J. Sun and H. Yi, RSC Adv., 2018, 8, 1899–1904 RSC.
- F. Yu, Z. Wang, S. Zhang, H. Ye, K. Kong, X. Gong, J. Hua and H. Tian, Adv. Funct. Mater., 2018, 28, 1804502 CrossRef.
- M. Zhang, W. Yao, Y. Lv, X. Bai, Y. Liu, W. Jiang and Y. Zhu, J. Mater. Chem. A, 2014, 2, 11432–11438 RSC.
- Z. Zhang, L. Zhang, X. Yan, H. Wang, Y. Liu, C. Yu, X. Cao, L. van Eijck and B. Wen, J. Power Sources, 2019, 410–411, 162–170 CrossRef CAS.
- W. Zhou, T. Jia, H. Shi, D. Yu, W. Hong and X. Chen, J. Mater. Chem. A, 2019, 7, 303–311 RSC.
- F. Wang, Y. Zhou, X. Pan, B. Lu, J. Huang and Z. Ye, Phys. Chem. Chem. Phys., 2018, 20, 6959–6969 RSC.
- M. Zhu, S. Kim, L. Mao, M. Fujitsuka, J. Zhang, X. Wang and T. Majima, J. Am. Chem. Soc., 2017, 139, 13234–13242 CrossRef CAS PubMed.
- W. Wang, H. Zhang, S. Zhang, Y. Liu, G. Wang, C. Sun and H. Zhao, Angew. Chem. Int. Ed., 2019, 58, 16644–16650 CrossRef CAS PubMed.
- Z. Zhang, K. Liu, Z. Feng, Y. Bao and B. Dong, Sci. Rep., 2016, 6, 19221 CrossRef CAS PubMed.
- Q. Xu, B. Zhu, B. Cheng, J. Yu, M. Zhou and W. Ho, Appl. Catal., B, 2019, 255, 117770 CrossRef CAS.
Footnote |
| † Electronic supplementary information (ESI) available. See DOI: 10.1039/c9ra10819j |
| This journal is © The Royal Society of Chemistry 2020 |

