
 Open Access Article
 This Open Access Article is licensed under a Creative Commons Attribution-Non Commercial 3.0 Unported Licence
Strain-induced structural phase transition, electric polarization and unusual electric properties in photovoltaic materials CsMI3 (M = Pb, Sn)†
Xiao-Rong Cheng‡
a,
Xiao-Yu Kuang‡ a,
Hao Chenga,
Hao Tian*bc,
Si-Min Yanga,
Miao Yua,
Xi-Long Doua and
Ai-Jie Mao*a
a,
Hao Chenga,
Hao Tian*bc,
Si-Min Yanga,
Miao Yua,
Xi-Long Doua and
Ai-Jie Mao*a
aInstitute of Atomic and Molecular Physics, Sichuan University, Chengdu 610065, China. E-mail: scu_mij@126.com
bNational Laboratory of Solid State Microstructures and Collaborative Innovation Center of Advanced Microstructures, Department of Materials Science and Engineering, Nanjing University, Nanjing 210093, China. E-mail: tiao2007@126.com
cJiangsu Key Laboratory of Artificial Functional Materials, Nanjing University, Nanjing 210093, China
First published on 26th March 2020
Abstract
The structural phase transition, ferroelectric polarization, and electric properties have been investigated for photovoltaic films CsMI3 (M = Pb, Sn) epitaxially grown along (001) direction based on the density functional theory. The calculated results indicate that the phase diagrams of two epitaxial CsPbI3 and CsSnI3 films are almost identical, except critical transition strains varying slightly. The epitaxial tensile strains induce two ferroelectric phases Pmc21, and Pmn21, while the compressive strains drive two paraelectric phases P212121, P21212. The larger compressive strain enhances the ferroelectric instability in these two films, eventually rendering them another ferroelectric state Pc. Whether CsPbI3 or CsSnI3, the total polarization of Pmn21 phase comes from the main contribution of B-position cations (Pb or Sn), whereas, for Pmc21 phase, the main contributor is the I ion. Moreover, the epitaxial strain effects on antiferrodistortive vector, polarization and band gap of CsMI3 (M = Pb, Sn) are further discussed. Unusual electronic properties under epitaxial strains are also revealed and interpreted.
1 Introduction
Due to the improvement of public environmental awareness in recent years, the direct conversion of solar energy into electricity has attracted great attention.1,2 Organic–inorganic halide is a photoelectric conversion material, which is mainly used in dye-sensitized solar cells (DSCs) because it costs less and the raw materials are abundant, especially this CH3NH3PbI3 materials.3–6 In decades, the photovoltaic efficiency has reached nearly 20% for CH3NH3PbI3 materials, but practicability needs to improve on account of the volatile and thermodynamically unstable nature of organic molecules.7,8 Recently, a stable hexagonal phase with the face sharing PbI6 octahedra rather than the corner-connected octahedra of CH3NH3PbI3 has been reported based on the first-principles calculations.9 While all-inorganic halides not only made up for the thermodynamically unstable characteristics of organic molecules but also maintained a high photovoltaic efficiency.10–12 Numerous studies indicate the most ideal photovoltaic materials possess about 1.4 eV band gap.13,14 CsSnI3 (CSI) materials have band gap of about 1.3 eV at room temperature.15–18 On the other hand, the band gap values of CsPbI3 (CPI) materials are ranging from 1.75 eV to 2.13 eV, which further reveals that CsMI3 (M = Pb, Sn) are potential candidates for photovoltaic materials.19Unfortunately, CsMI3 (M = Pb, Sn) have phase instability in the ambient environment. One the one hand, the CSI will appear Pnma, Pm![[3 with combining macron]](https://www.rsc.org/images/entities/char_0033_0304.gif) m, P4/mbm phase separately when the temperature changes.16,20,21 On the other hand, although α-CsPbI3 is the ideal photovoltaic material for CPI,11,22 it can easily form other structures.11,23–25 Moreover, CsMI3 (M = Pb, Sn) have ferroelectric instability.18
m, P4/mbm phase separately when the temperature changes.16,20,21 On the other hand, although α-CsPbI3 is the ideal photovoltaic material for CPI,11,22 it can easily form other structures.11,23–25 Moreover, CsMI3 (M = Pb, Sn) have ferroelectric instability.18
Despite shortcomings, CsMI3 (M = Pb, Sn) have their own advantages. For CSI, firstly, the effective mass of the small pores directly results in good conductivity, high hole mobility and large energy.26,27 It is found that the black orthorhombic phase (Pnma) of CSI has one of the highest observed hole mobility in the p-type semiconductor with a direct band gap.28 Besides, Sn atom replaces toxic Pb atoms, which can be achieved with an excellent photovoltaic efficiency2,20 and more conducive to the commercial application of photovoltaic materials for the future.29,30 However, the phase instability of CSI is a critical hurdle in practical application. On the bright side, the experimentally synthesized CSI nanowires31 had a great commercial application with the controllable growth direction and size. And a novel stain-mediated phase stabilization strategy is demonstrated to significantly enhance the phase stability of cubic α-CsPbI3 phase.32 Thus, CPI as a photovoltaic efficiency material, the biggest advantage is more stable and efficient.23,33–39 In addition, quantum dots of CPI38 produced nearly 100% photoluminescence quantum yield. Furthermore, ferroelectric material can achieve good photovoltaic efficiency.40,41 As we all know, CsMI3 (M = Pb, Sn) are good photovoltaic materials and have ferroelectric performance,11,18,20,26,42 such as the BiFeO3, EuTiO3, BaTiO3 and PbTiO3 materials.27,40,43–45
Besides, through the study of Sn and Pb halides, we found that strain or pressure can change the band gap value,46,47 which can improve the absorption effect of photovoltaic materials and enhance the conversion efficiency. Hence, we adopted the misfit strain (tensile and compressive strain) method to realize the phase transition and search the suitable band gap of CsMI3 (M = Pb, Sn) halides to photovoltaic materials. The main purpose was to explore the possible phases of the (001) direction halide perovskite films. It is worth noting that two paraelectric phases P212121, P21212 and one polarization phase Pc are found under compressive strain, which was rarely studied in perovskite films previously.
2 Computational details
The electronic structures and properties of the CsMI3 (M = Pb, Sn) are investigated based on the density-functional theory (DFT) as implemented in the Vienna Ab initio Simulation Package (VASP).48 The exchange and correlation functional PBEsol49 implemented the generalized gradient approximation (GGA) method50 is employed in the whole calculation. The 550 eV as the plane wave energy cutoff and 6 × 6 × 4 k-points in the irreducible Brillouin zone are applied to relax fully all structures in this paper. The energy convergence criterion is 10−6 eV, and force criterion convergence in the structural optimization is 0.001 eV Å−1. For (001) epitaxial films, we control the lattice constants and
and  in the plane, and optimize the lattice constant a3 (=2aIP + δ) in the (001) direction. Hence, the lattice parameters a1, a2, a3 are directed along pseudocubic [110], [
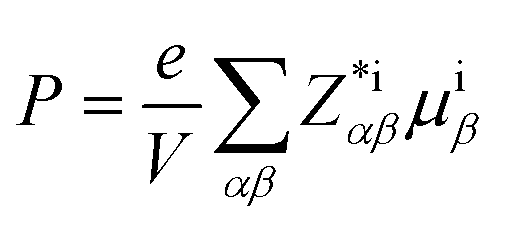
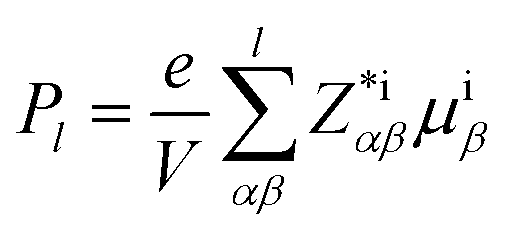
![[1 with combining macron]](https://www.rsc.org/images/entities/char_0031_0304.gif) 10] and [001]. Correspondingly, The misfit strain is defined as (a − a0)/a0 in our work. Then, two different methods are employed to estimate the electric polarization, one is Berry Phase method51 contained ionic and electronic polarization contribution, the other is Born effective charges with the atomic displacements:52
10] and [001]. Correspondingly, The misfit strain is defined as (a − a0)/a0 in our work. Then, two different methods are employed to estimate the electric polarization, one is Berry Phase method51 contained ionic and electronic polarization contribution, the other is Born effective charges with the atomic displacements:52
 | (1) |
Moreover, the space groups of these equilibrium phases are defined by the FINDSYM program.53 The crystal structures are drawn by the VESTA software.54 The phonon dispersion curve of a 2 × 2 × 2 cubic supercell is calculated by Phonopy with density functional perturbation theory (DFPT).55,56
3 Results and discussion
3.1 Structural phase transitions
As we all know, the rich structural phases of perovskite-type compounds can trace back to the phonon instability of highly symmetric cubic structure (with Pmm space group). Fig. S1(a)† reveal that unstable phonon modes at different high-symmetric Q points in the ideal cubic structure of CsPbI3, as evidenced by, e.g., gamma point (corresponding to ferroelectric instability), M point (associated with in-phase antiferrodistortive instability), and R point (related to anti-phase antiferrodistortive instability). How does the epitaxial strain effect these phonon instabilities? Which instability will possess the larger imaginary frequency and further play a leading role in structural transitions? Let us firstly start from the strain-dependent frequencies in CsPbI3, as shown in Fig. S1(b)†. The imaginary frequency of gamma point increases rapidly comparing with that of other points under lager compressive and tensile strains, which reveals the possibility of strain-driven ferroelectric phase transitions.
Based on this possibility, for CsMI3 (M = Pb, Sn) films in epitaxial (001) direction, the rich phase diagram has been investigated using first-principles calculation by taking compressive and tensile strains into consideration. In our investigation, a series of structural phases (such as Pbnm, I4/mcm, Pmc21, Pmn21, Pna21, Pc and so on.) are considered to obtain the stable structures under strain effect. In order to prove the reliability and effectiveness of our calculations, the total energy and axial ratio of the most stable phases vs. misfit strains are plotted in Fig. 1 for epitaxial (001) CPI and CSI thin films, enriching the phase diagram of CSI film in the epitaxial [001] direction reported previously.57 Fig. 1 shows that the phase diagrams of CsMI3 (M = Pb, Sn) are basically the same, except the different misfit strain values of the same phase. Moreover, the total energy of all the phases contained metastable phases vs. misfit strains are presented in Fig. S2† for epitaxial (001) CPI and CSI thin films. Fig. 1 and S2† show that our calculated results are not consistent with the report previously for CSI,57 especially in the compressive strain region. Herein, except for the structural phases Pbnm, P4bm, P4/mbm and Pmc21 reported by ref. 57–59, several stable phases are found under different misfit strains. Hence, six equilibrium states Pc, P212121, P21212, Pbnm, Pmc21, and Pmn21 for CPI (so do CSI) can be obtained, respectively. Correspondingly, the structural diagram of the most stable phases (Pc, P21212, P212121, Pbnm, Pmc21, Pmn21) are presented in Fig. S3.† In all calculations, the misfit strains are calculated as η = (a − a0)/a0, then we can get different η by adjusting a. The lattice parameter a0 = 8.59 Å of ground state Pbnm for CSI is in good agreement with the previous experimental results.28 The paraelectric phase Pbnm can be described by a−a−c+ tilting pattern, and the in-plane component of AAFDxy (antiphase antiferrodistortive) vector is about 8.89° for CPI (6.71° for CSI) and out-of-plane component of the IAFDz (in-phase antiferrodistortive) vector is about 12.56° (10.76° for CSI) seen from Fig. 2.
 | ||
| Fig. 1 The total energy and axial ratio vs. misfit strain in the [001] epitaxial CPI and CSI thin films. | ||
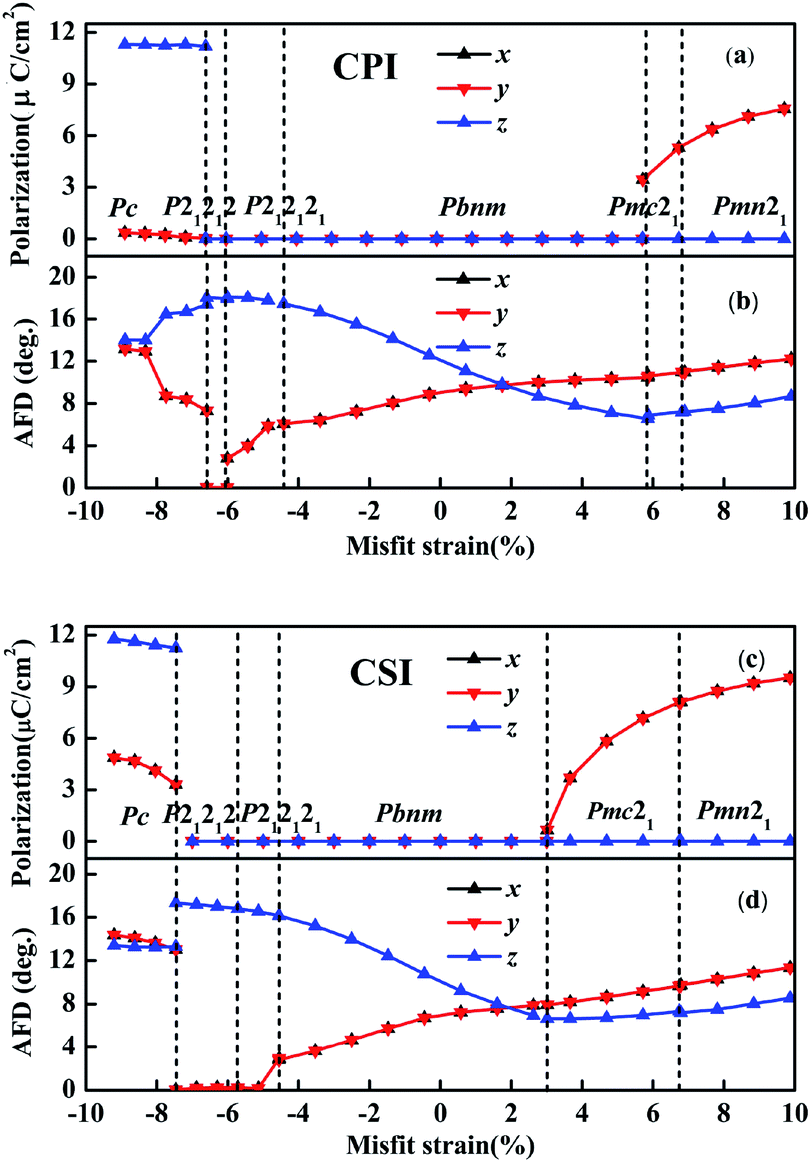 | ||
| Fig. 2 The polarization and AFD vs. misfit strain in the [001] epitaxial CPI and CSI thin films, where x, y, and z axes is directed along pseudocubic [100], [010], and [001], respectively. | ||
In the tensile strain region, our results are almost the same with previous results except for different misfit strain values for CSI.57 Whether CPI or CSI film, the stable phases Pbnm, Pmc21 and Pmn21 have been obtained under the epitaxial strain region. When the misfit strain varies from 0 to 5.85% for CPI and from 0 to 3.01% for CSI, the phase is still Pbnm. At misfit strain 5.85% and 3.01%, a phase transition has happened from Pbnm to Pmc21 for CPI and CSI, respectively. The Pmc21 phase is still retained with the misfit strain ranging from 5.85% to 6.89% for CPI, and from 3.01% to 6.74% for CSI, which can be described by a−a−c+ tilting pattern. When the misfit strains reach to 6.89% and 6.74%, a new phase Pmn21 is found for CPI and CSI, respectively. Pmn21 phase with a−a−c+ tilting pattern would be retained when the tensile strain increases.
In the compressive strain region, the biggest difference between our calculated results and the previous results is that the phases (P21212, P212121, Pc) are found, but P4bm and P4/mbm reported previously do not appear.57 From Fig. S2† (seen in SM), one can see that whether P4bm or P4/mbm has higher energy than P21212, P212121 or Pc at the corresponding strain values. When −4.42% < η < 0 for CPI (−4.55% < η < 0 for CSI), the ground state is always Pbnm state. When −6.01% < η < −4.42% for CPI (−5.71% < η < −4.55% for CSI), a new equilibrium phase P212121 appears, which had been reported by Prosandeev et al. with the property of interfering with ferroelectric anti-vortex and vortex in BiFeO3 material.60 It's a gyrotropic phase transition. When −6.58% < η < −6.01% for CPI (−7.45% < η < −5.71% for CSI), the stable state transforms from the original P212121 state to the P21212 state. When the η reaches to −6.58% and −7.45%, a phase transition from P21212 to Pc phase has been obtained for CPI and CSI, respectively. Where, Pc state is much more stable with lower energy in the misfit strain range of η < −6.58% for CPI (η < −7.45% for CSI). So far as we know, no report involves Pc phase for other perovskites under the compressive strain region. It is important that the Pc state is a ferroelectric phase, containing the iodine octahedron and iodine quadrangular pyramid seen in Fig. S3.† Besides, the Fig. 1 also indicates that the axial ratio decreases gradually from 1.35 to 0.87 for CPI (1.36 to 0.88 for CSI).
3.2 Antiferrodistortive vector and polarization
Antiferrodistortive (AFD) vector is an important measurement indicator to evaluate the deviate magnitude of iodine octahedron, which can be described by Cartesian components of the in-phase antiferrodistortive vector IAFD, and AAFD that of the antiphase antiferrodistortive vector. The IAFDz (out-of-plane component of the IAFD vector along z axis [001]) and AAFDxy (in-plane component of AAFD vector along x [100] or y [010] axis) of CsMI3 (M = Pb, Sn) thin films in epitaxial (001) vs. the misfit stain are plotted in Fig. 2. Fig. 2 indicates that the IAFDz vector first decreases, and then increases gradually, while the AAFDxy vector increases gradually with the tensile strain increasing for CPI and CSI, respectively. Similarly one can see that the IAFDz vector first increases, and then decreases, whereas AAFDxy vector has the reverse tendency at all compressive strain regions. Apparently, whether CPI or CSI, the tendency is almost the same in each stable phase region, the deviate magnitude may exit small difference. Corresponding polarization directed along x, y and z axis can be estimated by the Berry phase method as plotted in Fig. 2. Simultaneously, in order to further verify the correctness of our calculation and understand the polar mechanism, we selected given misfit strain for each polar phase as an example by employing Born effective charges with the atomic displacements. In addition, the ground state structure Pbnm and the ferroelectric phase Pmc21 and Pmn21 are shown in Fig. 3 (Pc phase is shown in Fig. S4†). Firstly four layers alternate array of supercells of CPI and CSI have been used to decompose the polarization along the pseudocubic [001] direction as shown in Fig. 3. This decomposed polarization had been reported in SrZrO3 to understand the polarization mechanism.59 According to eqn (1) the decomposed polarization Pl can be obtained by
 | (2) |
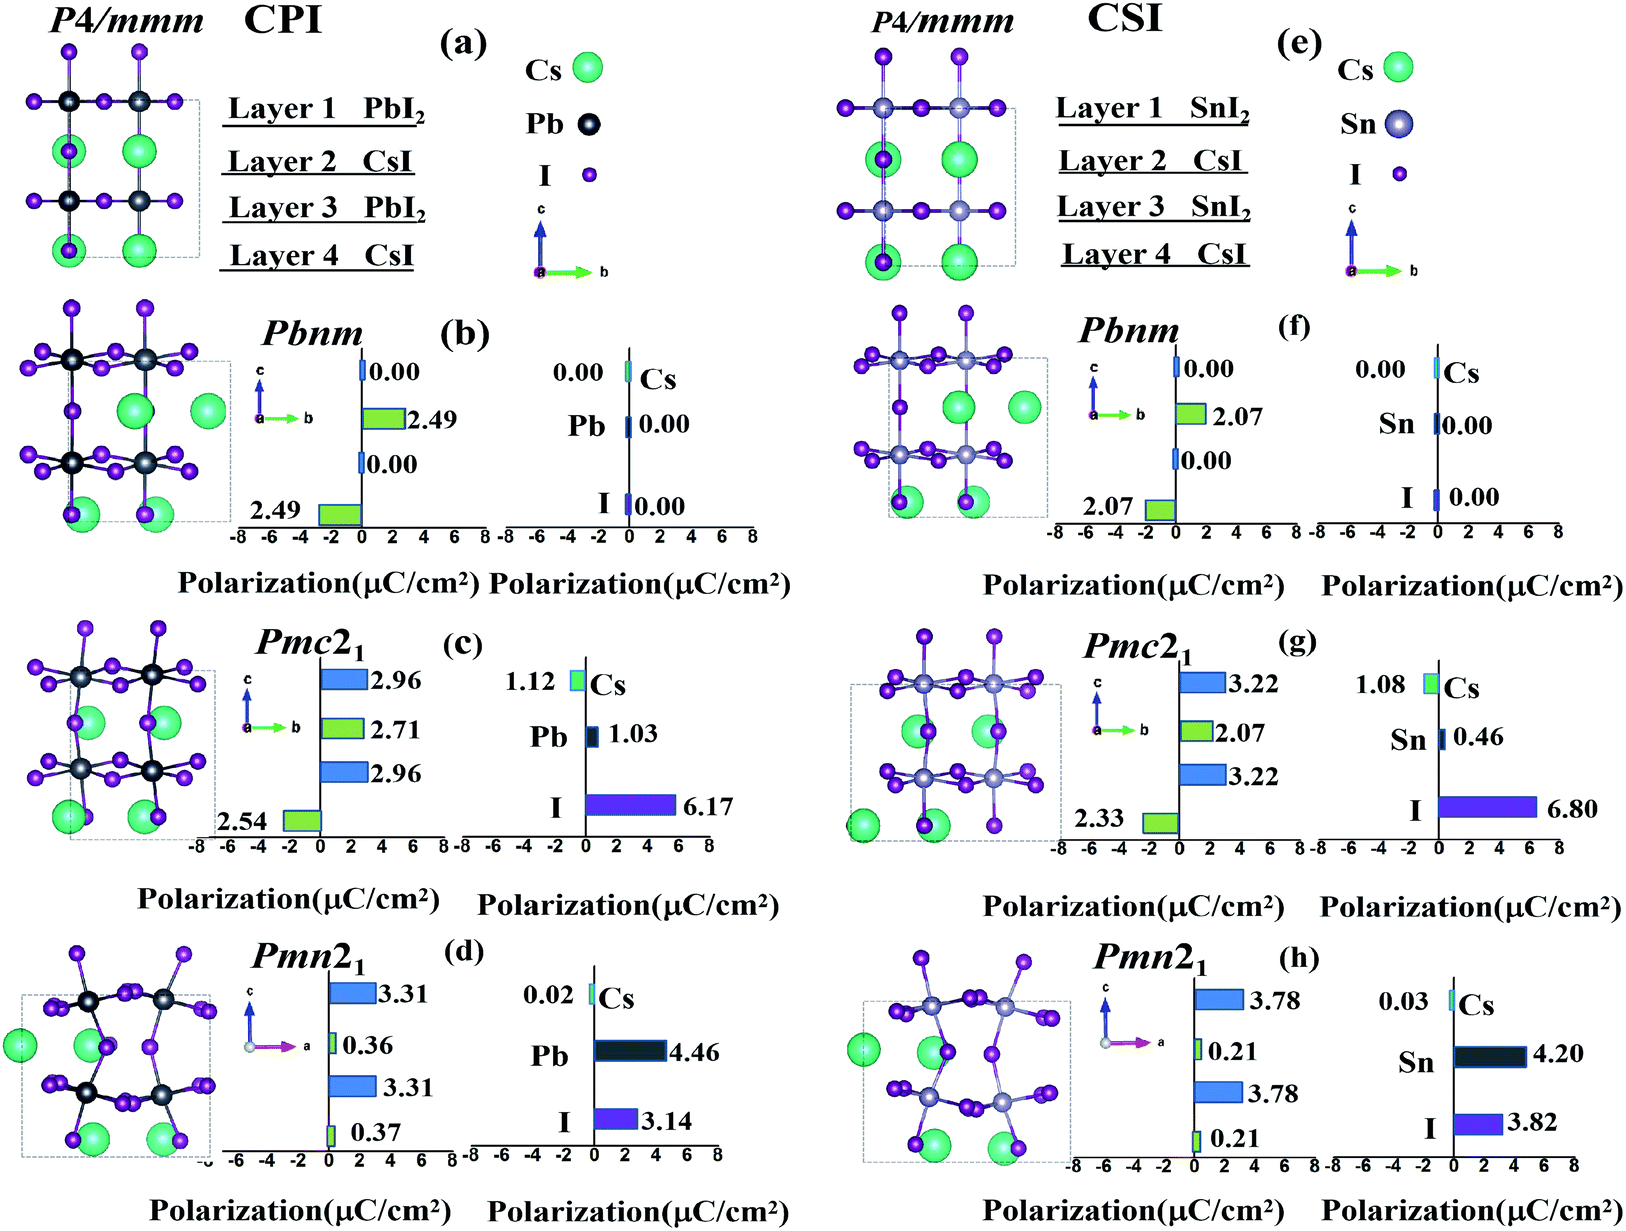 | ||
| Fig. 3 The layer-decomposed polarization in corresponding strained phases for CPI and CSI. Panel (a) and (e) display the schematic configuration of the centrosymmetric P4/mmm structure. Panel (b), (c), (d), (f), (g) and (h) represent the layer-decomposed polarization in Pbnm, Pmc21, and Pmn21 phase, respectively. | ||
Let us focus on Pbnm phase with misfit strain varying from −4.42% to 5.85% for CPI (−4.55% to 3.01% for CSI), Pbnm phase with an a−a−c+ tilting pattern can be macroscopically described by an in-plane component of the AAFDxy as well as the out-of-plane component of the IAFDz. IAFDz vector decreases gradually from 17.48° to 6.56° for CPI and from 16.14° to 6.65° for CSI. The tendency of AAFDxy is opposite to that of IAFDz varying from 6.09° to 10.47° for CPI (2.81° to 7.93° for CSI) as seen in Fig. 2. Even the degree of deviation of PbI6 octahedron from normal PbI6 octahedron is large, Pbnm phase is the paraelectric phase. The main reasons are (1) the polarization of each layer PbI2 is zero, (2) the polarization of each layer CsI is not zero, but their polarization directions are opposite as seen in Fig. 3(b and f), (3) the total polarization of each type of atom in CPI (CSI) is always zero.
With the tensile strain increasing, two polarization phases Pmc21 and Pmn21 appear. Within the misfit strain range of their existence, their AAFDxy vector increase monotonically from 10.63° to 12.23° for CPI (8.17° to 11.35° for CSI) approximately, and their tendencies are similar to those of IAFDz vector. Fig. 2 further indicates Pmc21 possesses a polarization along in-plane (FExy). Hence, Pmc21 phase can be macroscopically described by an in-plane polarization FExy and the in-plane component of the AAFDxy as well as the out-of-plane component of the IAFDz. Those macroscopical characters induced the mixing coupling modes FExy + AAFDxy and FExy + IAFDz, which is different from the pure coupling of FExy + AAFDxy or FExy + IAFDz reported for Pmc21 phase in SrZrO3 and BiFeO3.59,61,62 Of course, this mixing coupling mode had also been reported in LaFeO3 and other rare-earth orthoferrites.58,63 Moreover, from Fig. 2, as the misfit strain increases, the polarization FExy and antiferrodistortive AAFDxy, IAFDz are all enhanced. Herein, Cs ions exit inverse displacements, which lead to an opposite polarization direction in two CsI layers, further weakening the total macroscopical polarization. Whether CPI or CSI, the major contributors to the total polarization come from I ions as shown in Fig. 3(c and g). Compared with Pmc21 phase, Pmn21 is also a ferroelectric phase with the same a−a−c+ tilting pattern. Their difference is that (1) Cs ions exit homodromous displacements, and (2) the magnitude of polarization for CsI layer is very small compared to that of PbI2 layer. (3) The main contribution to the total polarization derived from B-position cations (Pb or Sn).
In the compressive strain region, a fascinating polarization phase Pc is obtained, similar to Pbnm, Pmc21 and Pmn21 phases, Pc phase with a−a−c+ tilting pattern can be described by in-plane component of the AAFDxy as well as out-of-plane component of the IAFDz. Moreover, we also found that the AAFDxy vector tends to increase with the compressive stain varying from −6.58% to −10% for CPI, which is opposite to its IAFDz and similar to that of P21212 and P212121 phases. As is presented in Fig. 2, the corresponding polarization is estimated varying from 0.021 to 0.35 μC cm−2 along xy axis and from 11.20 to 11.30 μC cm−2 along z axis under corresponding compress strain region of η < −6.58% for CPI (3.30–4.86 μC cm−2 along xy axis and 11.25–11.76 μC cm−2 along z axis correspond to η < −7.45% for CSI) based on berry phase method, where x, y, and z are directed along pseudocubic [100], [010] and [001], respectively. Furthermore, compared with other polarization phases (Pmc21 and Pmn21), the polarization of Pc phase is not only directed along xy axis, but also along z axis, which may be attributed to the crystal structure composed of iodine octahedron and iodine quadrangular pyramid. Noted that, similar to the Pmn21 phase, the polarization comes mainly from B-position cations (Pb or Sn).
3.3 Electronic properties
Based on those stable phases, we search the suitable band gap to photovoltaic materials, the band gaps of CsMI3 (M = Pb, Sn) are estimated based on PBEsol functional under different misfit strains as plotted in Fig. 4. Fig. 4 indicates that the band gap of the material can be adjusted by the epitaxial strain. And tendencies of band gap for CsMI3 (M = Pb, Sn) are approximately the same as that of strain. Besides, from Fig. 4(a) we found that the band gap values of Pbnm, P212121, and P21212 states for CPI are from 1.14 eV to 1.58 eV, which are beneficial candidates of photovoltaic materials. We also found the tendencies of the band gap under compressive and tensile strain are different for Pbnm phase. The band gap value of the Pbnm state decreases monotonically under compressive strain from 1.58 eV to 1.18 eV for CPI and from 0.42 eV to nearly zero eV for CSI, but from 1.58 eV to 1.55 eV for CPI and from 0.42 eV to 0.47 eV for CSI under tensile strain. Differently, except Pbnm phase, whether the compressive strain or tensile strain, the tendency of band gaps increases monotonically for CsMI3 (M = Pb, Sn).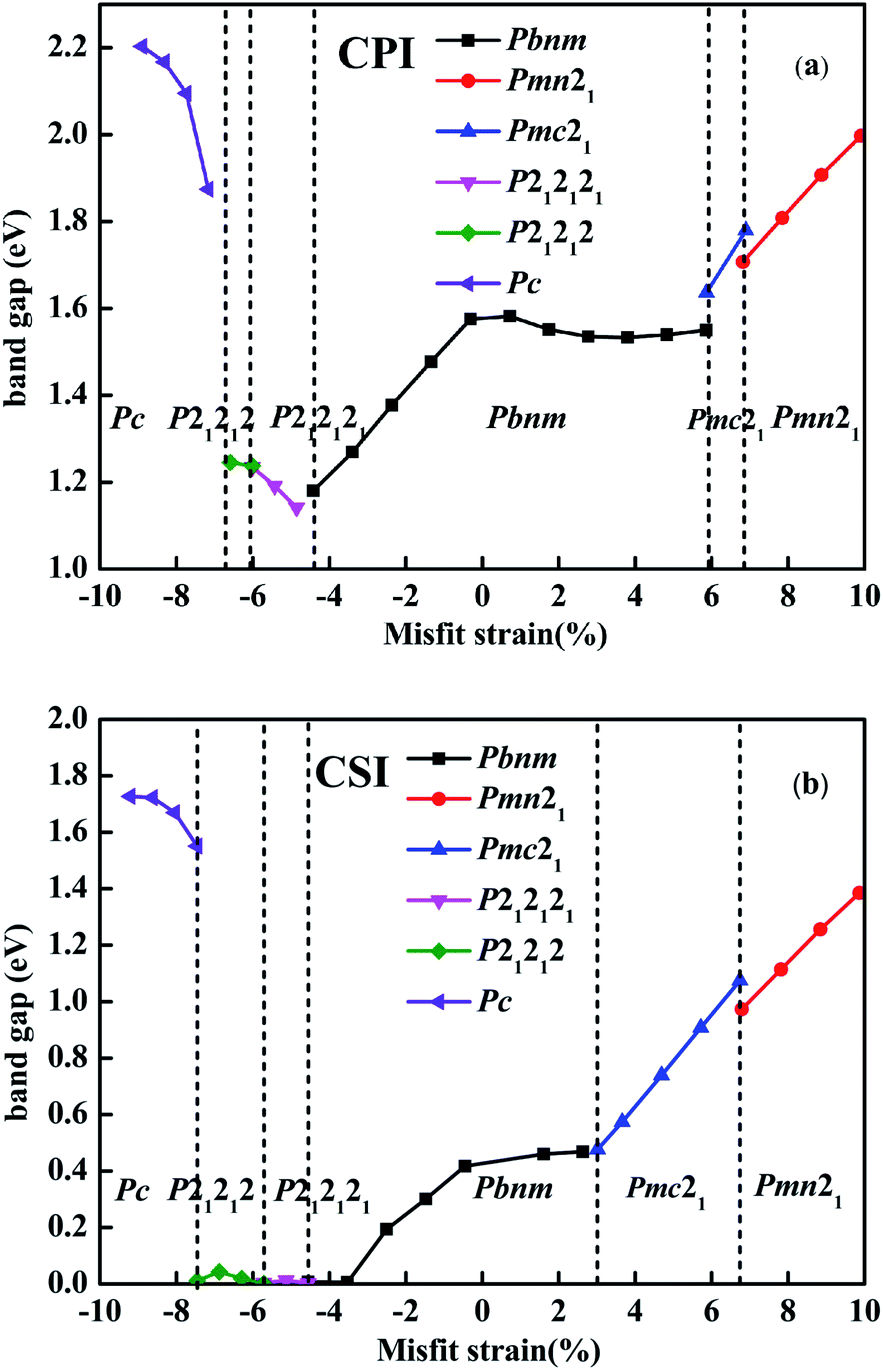 | ||
| Fig. 4 Band gaps of different stable phases vs. misfit strain of CPI and CSI, respectively. | ||
A noteworthy feature of electronic properties in Pbnm state is the diminution of band gap with the increasing of compressive strain, corresponding to the nearly unchanged band gap under tensile strain. Particularly, the unusual electronic properties are not associated with structural phase transition as we commonly expected, which are demonstrated by the same structural symmetry (i.e., Pbnm) and the linear changes of bond angles and bond lengths (as shown in Fig. S5†). In order to better understand the origin of the unusual electronic properties, we calculate the band structure and density of states, as well as the corresponding charge density at G point of the conduction-band minimum of Pbnm state for CPI film with strains of −3.39% and 1.74%, respectively. Note that the conduction-band minimum is dominated by Pb-px orbital under tensile strain, while that is dominated by Pb-pz orbital under compressive strain, as shown in Fig. 5. In other words, the compressive strain lows the energy of antibonding Pb-pz orbital, which results in the rapid shift of the corresponding conduction band towards the valence-band maximum and the occupation of conduction-band minimum. As a result, the band gap rapidly decreases when the compressive strain increases. Such striking electronic properties hint towards unusual optical properties—such as electric dipole transition and piezochromic effects.64–66 In fact, we numerically found (see Fig. 4(b)) that such feature also exists in CsSnI3 film but the band gap changes from 0.42 eV to 0 eV with strain-induced insulator-to-metal transitions under −3.8% compressive strain, which further emphasizes the significance.
 | ||
| Fig. 5 The calculated (a) band structure and density of states, as well as (b) the corresponding charge density at Γ point of the conduction-band minimum of Pbnm state with strains of −3.39%, respectively. Panels (c) and (d): the same as in panels (a) and (b), respectively, but for 1.74% strain in CPI film. | ||
4 Conclusions
The first-principles calculations are carried out to explore the structural phase transition, electric polarization and electric properties of CsMI3 (M = Pb, Sn) epitaxial films along (001) direction. Taken the strain effect into account, the phase diagrams of CsMI3 (M = Pb, Sn) epitaxial films have been presented, which exhibits three ferroelectric phases Pmc21, Pmn21, Pc and two paraelectric phases P212121, P21212. The difference is that the misfit strain of the same phase transition is different in two phase diagrams. Surprisingly, a ferroelectric phase Pc and a paraelectric phase P212121 with gyrotropic phase transitions are found in two photovoltaic materials. By comparison, the magnitudes of antiferrodistortive vector and electric polarization of CsPbI3 epitaxial films are always smaller than that of in CsSnI3 epitaxial films under given misfit stain, which may be attributed to the fact that it’s easier to deviate from the corresponding center symmetric position for Sn ions with the small atomic radius compared to Pb ions. Unusual electronic properties in Pbnm state under epitaxial strains are also revealed to be directly related to the strain effect on electric structure, as, e.g., evidenced by the rapid shift of pz conduction band towards the valence-band maximum and the occupation of conduction-band minimum, without structural phase transition as we commonly expected. We thus hope that the present work broadens the general and important fields of, e.g., phase transitions in films, and will encourage scientists to observe such unusual effects in all-inorganic halides as well as in other compounds.Conflicts of interest
There are no conflicts to declare.Acknowledgements
This work was supported by the National Natural Science Foundation of China (No. 11574220 and 11874043). H. T. is thankful for the support of the China Postdoctoral Science Foundation (No. 2018M642205) and the Jiangsu Planned Projects for Postdoctoral Research Funds (No. 2019K249).References
- Y. El Ajjouri, F. Locardi, M. C. Gélvez-Rueda, M. Prato, M. Sessolo, M. Ferretti, F. C. Grozema, F. Palazon and H. J. Bolink, Energy Technol., 2019, 1900788 CrossRef.
- D.-J. Yang, Y.-H. Du, Y.-Q. Zhao, Z.-L. Yu and M.-Q. Cai, Phys. Status Solidi B, 2019, 1800540 CrossRef CAS.
- B. Zhao, S.-F. Jin, S. Huang, N. Liu, J.-Y. Ma, D.-J. Xue, Q. Han, J. Ding, Q.-Q. Ge and Y. Feng, et al., J. Am. Chem. Soc., 2018, 140, 11716–11725 CrossRef CAS PubMed.
- J. Bisquert, J. Phys. Chem. Lett., 2013, 4, 2579–2598 Search PubMed.
- N.-G. Park, J. Phys. Chem. Lett., 2013, 4, 2423–2429 CrossRef CAS.
- A. Kojima, K. Teshima, Y. Shirai and T. Miyasaka, J. Am. Chem. Soc., 2009, 131, 6050–6051 CrossRef CAS PubMed.
- S. Zhang, X. Yang, Y. Numata and L. Han, Energy Environ. Sci., 2013, 6, 1443–1464 RSC.
- M. M. Lee, J. Teuscher, T. Miyasaka, T. N. Murakami and H. J. Snaith, Science, 2012, 338, 643–647 CrossRef CAS PubMed.
- A. S. Thind, X. Huang, J. Sun and R. Mishra, Chem. Mater., 2017, 29, 6003–6011 CrossRef CAS.
- R. J. Sutton, G. E. Eperon, L. Miranda, E. S. Parrott, B. A. Kamino, J. B. Patel, M. T. Hörantner, M. B. Johnston, A. A. Haghighirad and D. T. Moore, et al., Adv. Energy Mater., 2016, 6, 1502458 CrossRef.
- Y. Hu, F. Bai, X. Liu, Q. Ji, X. Miao, T. Qiu and S. Zhang, ACS Energy Lett., 2017, 2, 2219–2227 CrossRef CAS.
- J. K. Nam, S. U. Chai, W. Cha, Y. J. Choi, W. Kim, M. S. Jung, J. Kwon, D. Kim and J. H. Park, Nano Lett., 2017, 17, 2028–2033 CrossRef CAS PubMed.
- Y. Chen, J. Barnard, R. Palmer, M. Watanabe and T. Sasaki, Phys. Rev. Lett., 1999, 83, 2406 CrossRef CAS.
- W. Shockley and H. J. Queisser, J. Appl. Phys., 1961, 32, 510–519 CrossRef CAS.
- C. Yu, Y. Ren, Z. Chen and K. Shum, J. Appl. Phys., 2013, 114, 163505 CrossRef.
- K. Shum, Z. Chen, J. Qureshi, C. Yu, J. J. Wang, W. Pfenninger, N. Vockic, J. Midgley and J. T. Kenney, Appl. Phys. Lett., 2010, 96, 221903 CrossRef.
- Z. Chen, C. Yu, K. Shum, J. J. Wang, W. Pfenninger, N. Vockic, J. Midgley and J. T. Kenney, J. Lumin., 2012, 132, 345–349 CrossRef CAS.
- E. L. Da Silva, J. M. Skelton, S. C. Parker and A. Walsh, Phys. Rev. B: Condens. Matter Mater. Phys., 2015, 91, 144107 CrossRef.
- E. M. Sanehira, A. R. Marshall, J. A. Christians, S. P. Harvey, P. N. Ciesielski, L. M. Wheeler, P. Schulz, L. Y. Lin, M. C. Beard and J. M. Luther, Sci. Adv., 2017, 3, eaao4204 CrossRef PubMed.
- K. Marshall, M. Walker, R. Walton and R. Hatton, Nature Energy, 2016, 1, 16178 CrossRef CAS.
- K. Yamada, S. Funabiki, H. Horimoto, T. Matsui, T. Okuda and S. Ichiba, Chem. Lett., 1991, 20, 801–804 CrossRef.
- S. Xiang, Z. Fu, W. Li, Y. Wei, J. Liu, H. Liu, L. Zhu, R. Zhang and H. Chen, ACS Energy Lett., 2018, 3, 1824–1831 CrossRef CAS.
- J. Pan, Y. Shang, J. Yin, M. De Bastiani, W. Peng, I. Dursun, L. Sinatra, A. M. El-Zohry, M. N. Hedhili and A.-H. Emwas, et al., J. Am. Chem. Soc., 2017, 140, 562–565 CrossRef PubMed.
- Q. Wang, X. Zheng, Y. Deng, J. Zhao, Z. Chen and J. Huang, Joule, 2017, 1, 371–382 CrossRef CAS.
- R. J. Sutton, M. R. Filip, A. A. Haghighirad, N. Sakai, B. Wenger, F. Giustino and H. J. Snaith, ACS Energy Lett., 2018, 3, 1787–1794 CrossRef CAS.
- P. Xu, S. Chen, H.-J. Xiang, X.-G. Gong and S.-H. Wei, Chem. Mater., 2014, 26, 6068–6072 CrossRef CAS.
- S. M. Young and A. M. Rappe, Phys. Rev. Lett., 2012, 109, 116601 CrossRef PubMed.
- I. Chung, J.-H. Song, J. Im, J. Androulakis, C. D. Malliakas, H. Li, A. J. Freeman, J. T. Kenney and M. G. Kanatzidis, J. Am. Chem. Soc., 2012, 134, 8579–8587 CrossRef CAS PubMed.
- M. Han, J. Sun, M. Peng, N. Han, Z. Chen, D. Liu, Y. Guo, S. Zhao, C. Shan and T. Xu, et al., J. Phys. Chem. C, 2019, 123, 17566–17573 CrossRef CAS.
- J. S. Han, Q. V. Le, J. Choi, H. Kim, S. G. Kim, K. Hong, C. W. Moon, T. L. Kim, S. Y. Kim and H. W. Jang, ACS Appl. Mater. Interfaces, 2019, 11, 8155–8163 CrossRef CAS PubMed.
- J. Chen, Z. Luo, Y. Fu, X. Wang, K. J. Czech, S. Shen, L. Guo, J. C. Wright, A. Pan and S. Jin, ACS Energy Lett., 2019, 4, 1045–1052 CrossRef CAS.
- S. Ma, S. H. Kim, B. Jeong, H.-C. Kwon, S.-C. Yun, G. Jang, H. Yang, C. Park, D. Lee and J. Moon, Small, 2019, 15, 1900219 CrossRef PubMed.
- J. B. Hoffman, A. L. Schleper and P. V. Kamat, J. Am. Chem. Soc., 2016, 138, 8603–8611 CrossRef CAS PubMed.
- A. Waleed, M. M. Tavakoli, L. Gu, S. Hussain, D. Zhang, S. Poddar, Z. Wang, R. Zhang and Z. Fan, Nano Lett., 2017, 17, 4951–4957 CrossRef CAS PubMed.
- A. Swarnkar, W. J. Mir and A. Nag, ACS Energy Lett., 2018, 3, 286–289 CrossRef CAS.
- G. E. Eperon, G. M. Paterno, R. J. Sutton, A. Zampetti, A. A. Haghighirad, F. Cacialli and H. J. Snaith, J. Mater. Chem. A, 2015, 3, 19688–19695 RSC.
- A. Swarnkar, A. R. Marshall, E. M. Sanehira, B. D. Chernomordik, D. T. Moore, J. A. Christians, T. Chakrabarti and J. M. Luther, Science, 2016, 354, 92–95 CrossRef CAS PubMed.
- T. Zhang, M. I. Dar, G. Li, F. Xu, N. Guo, M. Grätzel and Y. Zhao, Sci. Adv., 2017, 3, e1700841 CrossRef PubMed.
- P. Luo, W. Xia, S. Zhou, L. Sun, J. Cheng, C. Xu and Y. Lu, J. Phys. Chem. Lett., 2016, 7, 3603–3608 CrossRef CAS.
- S. Yang, J. Seidel, S. Byrnes, P. Shafer, C.-H. Yang, M. Rossell, P. Yu, Y.-H. Chu, J. Scott and J. Ager III, et al., Nat. Nanotechnol., 2010, 5, 143 CrossRef CAS PubMed.
- R. Guo, L. You, Y. Zhou, Z. S. Lim, X. Zou, L. Chen, R. Ramesh and J. Wang, Nat. Commun., 2013, 4, 1990 CrossRef PubMed.
- L.-y. Huang and W. R. Lambrecht, Phys. Rev. B: Condens. Matter Mater. Phys., 2013, 88, 165203 CrossRef.
- T. Choi, S. Lee, Y. J. Choi, V. Kiryukhin and S.-W. Cheong, Science, 2009, 324, 63–66 CrossRef CAS PubMed.
- J. Seidel, D. Fu, S.-Y. Yang, E. Alarcón-Lladó, J. Wu, R. Ramesh and J. W. Ager III, Phys. Rev. Lett., 2011, 107, 126805 CrossRef PubMed.
- X. Wang, S. Zhen, Y. Min, P. Zhou, Y. Huang, C. Zhong, Z. Dong and J. Liu, J. Appl. Phys., 2017, 122, 194102 CrossRef.
- Y. Li, X. Gong, P. Zhang and X. Shao, Chem. Phys. Lett., 2019, 716, 76–82 CrossRef CAS.
- Y. Huang, Z. Hu, K. Li and X. Shao, Comput. Mater. Sci., 2018, 143, 403–410 CrossRef CAS.
- G. Kresse and D. Joubert, Phys. Rev. B: Condens. Matter Mater. Phys., 1999, 59, 1758 CrossRef CAS.
- J. P. Perdew, A. Ruzsinszky, G. I. Csonka, O. A. Vydrov, G. E. Scuseria, L. A. Constantin, X. Zhou and K. Burke, Phys. Rev. Lett., 2008, 100, 136406 CrossRef PubMed.
- J. P. Perdew, K. Burke and M. Ernzerhof, Phys. Rev. Lett., 1996, 77, 3865 CrossRef CAS PubMed.
- R. King-Smith and D. Vanderbilt, Phys. Rev. B: Condens. Matter Mater. Phys., 1994, 49, 5828 CrossRef CAS PubMed.
- R. Resta, M. Posternak and A. Baldereschi, Phys. Rev. Lett., 1993, 70, 1010 CrossRef CAS PubMed.
- H. T. Stokes and D. M. Hatch, J. Appl. Crystallogr., 2005, 38, 237–238 CrossRef CAS.
- K. Momma and F. Izumi, J. Appl. Crystallogr., 2011, 44, 1272–1276 CrossRef CAS.
- S. Baroni, S. De Gironcoli, A. Dal Corso and P. Giannozzi, Rev. Mod. Phys., 2001, 73, 515 CrossRef CAS.
- K. Refson, P. R. Tulip and S. J. Clark, Phys. Rev. B: Condens. Matter Mater. Phys., 2006, 73, 155114 CrossRef.
- G. Song, B. Gao, G. Li and J. Zhang, RSC Adv., 2017, 7, 41077–41083 RSC.
- A. Mao, H. Tian, X. Kuang, J. Jia and J. Chai, RSC Adv., 2016, 6, 100526–100531 RSC.
- H. Tian, A.-J. Mao, H. J. Zhao, Y. Cui, H. Li and X.-Y. Kuang, Phys. Chem. Chem. Phys., 2016, 18, 7680–7687 RSC.
- S. Prosandeev, I. A. Kornev and L. Bellaiche, Phys. Rev. Lett., 2011, 107, 117602 CrossRef CAS PubMed.
- Y. Yang, W. Ren, M. Stengel, X. Yan and L. Bellaiche, Phys. Rev. Lett., 2012, 109, 057602 CrossRef PubMed.
- S. Prosandeev, D. Wang, W. Ren, J. Íñiguez and L. Bellaiche, Adv. Funct. Mater., 2013, 23, 234–240 CrossRef CAS.
- H. J. Zhao, Y. Yang, W. Ren, A.-J. Mao, X. M. Chen and L. Bellaiche, J. Phys.: Condens. Matter, 2014, 26, 472201 CrossRef PubMed.
- W. Meng, X. Wang, Z. Xiao, J. Wang, D. B. Mitzi and Y. Yan, J. Phys. Chem. Lett., 2017, 8, 2999–3007 CrossRef CAS PubMed.
- H. Tian, X.-Y. Kuang, A.-J. Mao, Y. Yang, C. Xu, S. O. Sayedaghaee and L. Bellaiche, Phys. Rev. B, 2018, 97, 020103 CrossRef CAS.
- D. Sando, Y. Yang, E. Bousquet, C. Carrétéro, V. Garcia, S. Fusil, D. Dolfi, A. Barthélémy, P. Ghosez and L. Bellaiche, et al., Nat. Commun., 2016, 7, 10718 CrossRef CAS.
Footnotes |
| † Electronic supplementary information (ESI) available. See DOI: 10.1039/c9ra10791f |
| ‡ Authors contributed equally to this work. |
| This journal is © The Royal Society of Chemistry 2020 |