 Open Access Article
Photochemical anti–syn isomerization around the –N–N![[double bond, length as m-dash]](https://www.rsc.org/images/entities/h2_char_e001.gif) bond in heterocyclic imines†
bond in heterocyclic imines†
Michal Hricovínia,
James Asherb and
Miloš Hricovíni *c
*c
aInstitute of Chemistry, Slovak Academy of Sciences, Dúbravská cesta 9, 845 38 Bratislava, Slovak Republic
bInstitute of Inorganic Chemistry, Slovak Academy of Sciences, Dúbravská cesta 9, 845 36 Bratislava, Slovak Republic
cInstitute of Chemistry, Slovak Academy of Sciences, Dúbravská cesta 9, 845 38 Bratislava, Slovak Republic. E-mail: milos.hricovini@savba.sk; Fax: +421-2-5940222; Tel: +421-2-59410323
First published on 4th February 2020
Abstract
EPR and NMR experiments on a quinazolinone-based Schiff's base in DMSO solution showed that irradiation with UV light (365 nm) leads to photochemically-induced isomerization from the anti- to the higher-energy syn-form around the –N–N![[double bond, length as m-dash]](https://www.rsc.org/images/entities/char_e001.gif) linkage. The anti- to syn-isomerization was relatively fast, and the maximum amount of conversion detected (25%) was reached within 10 min; thermodynamic equilibrium re-established itself in about 15 min. DFT calculations were performed on the investigated compound and small model systems, and reproduced the experimental fact of the anti-conformer being lower in energy than the syn. Theoretical analysis of excited states, including visualisation of natural transition orbitals, identified possible pathways for syn–anti isomerisation, although the details vary with π-system size, making the use of small models of limited utility. The investigated compound probably isomerises through the third singlet excited state (S3), a π–π* excitation, relaxing through S2, also a π–π* state.
linkage. The anti- to syn-isomerization was relatively fast, and the maximum amount of conversion detected (25%) was reached within 10 min; thermodynamic equilibrium re-established itself in about 15 min. DFT calculations were performed on the investigated compound and small model systems, and reproduced the experimental fact of the anti-conformer being lower in energy than the syn. Theoretical analysis of excited states, including visualisation of natural transition orbitals, identified possible pathways for syn–anti isomerisation, although the details vary with π-system size, making the use of small models of limited utility. The investigated compound probably isomerises through the third singlet excited state (S3), a π–π* excitation, relaxing through S2, also a π–π* state.
1. Introduction
The effects of ultraviolet (UV) and optical (vis) radiation on molecular structures have been widely studied, as energy transfer in the UV/vis region plays an important role in a number of chemical and biological processes.1,2 The transformation from the energetically more favourable anti-isomer to the syn-isomer by UV/vis excitation has been found to occur in many organic molecules.3,4 Systems possessing a double bond between two atoms with bulky substituents tend to undergo an isomerisation process,5 but then relax back to the more stable isomer by thermal relaxation or when exposed to a particular wavelength of light.6,7 The re-isomerisation process can sometimes proceed very rapidly, especially in the case of highly-conjugated systems with small substituents and an aliphatic backbone.8 On the other hand, some systems relax significantly more slowly and relax to the lower-energy isomer only after days or months.9The are many photochemically-induced biological processes associated with nitrogen-containing heterocyclic compounds, such as Schiff's bases.10,11 These compounds have shown a broad spectrum of applications in pharmacology and medicine,12 but they also serve as catalysts,13 optical materials and dyes,14,15 and play an important role in inorganic biochemistry.16,17 Depending on their structure, compounds of this type have a wide range of biological activities and are well-known for their antibiotic activities, including anticancer, antiviral and anticonvulsant effects.18,19 These activities can be increased by coordination with various metal ions, and complexes with metal ions are currently being used as successful models of biologically-active agents and precursors for pharmaceutical development.20,21 Quinazoline and quinazolinones also belong to the class of nitrogen-containing heterocyclic compounds which possess significant therapeutic potential, having antimicrobial,22 anticancer,23 anti-inflammatory,24 or other25 beneficial effects. Unlike the previously mentioned Schiff's bases,26 however, little is known about their photochemical properties. Only a few photochemical studies have been performed dealing with quinazolinones.27–29 Recently, photochemically-induced isomerization of a quinazolinone derivative containing a large π-system (consisting of two C6 rings linked by a reduced quinazolinone moiety and a Nring–N![[double bond, length as m-dash]](https://www.rsc.org/images/entities/char_e001.gif) CH–Caromatic bridge) has been described.30 Unlike previous studies describing isomerization around a C–C linkage27–29 or a N
CH–Caromatic bridge) has been described.30 Unlike previous studies describing isomerization around a C–C linkage27–29 or a N![[double bond, length as m-dash]](https://www.rsc.org/images/entities/char_e001.gif) N linkage (in the case of azobenzene and its derivatives),31,32 isomerization proceeded around a N–N linkage in the N–N
N linkage (in the case of azobenzene and its derivatives),31,32 isomerization proceeded around a N–N linkage in the N–N![[double bond, length as m-dash]](https://www.rsc.org/images/entities/char_e001.gif) CH array of this system. This finding prompted us to study similar molecular systems, and in this paper we present experimental data and in-depth theoretical analysis to identify the excited states that are likely to be involved in the photochemically-induced isomerization process.
CH array of this system. This finding prompted us to study similar molecular systems, and in this paper we present experimental data and in-depth theoretical analysis to identify the excited states that are likely to be involved in the photochemically-induced isomerization process.
The subject of this paper is a Schiff base possessing a quinazolinone moiety30,33 (S1; Fig. 1), with a series of model compounds M1–M4 (Fig. 2) also being studied at the computational level in order to investigate the photochemical behaviour of the –N–N![[double bond, length as m-dash]](https://www.rsc.org/images/entities/char_e001.gif) linkage. We shall focus on the photoswitching properties of the N–N linkage under UV radiation in DMSO solution. Photochemically-induced anti-/syn-isomerization around the N–N bond has been analysed by means of UV/vis, EPR, and NMR spectroscopy, complemented by DFT calculations, to understand the photochemistry of the N–N
linkage. We shall focus on the photoswitching properties of the N–N linkage under UV radiation in DMSO solution. Photochemically-induced anti-/syn-isomerization around the N–N bond has been analysed by means of UV/vis, EPR, and NMR spectroscopy, complemented by DFT calculations, to understand the photochemistry of the N–N![[double bond, length as m-dash]](https://www.rsc.org/images/entities/char_e001.gif) CH array.
CH array.
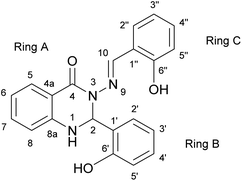 | ||
| Fig. 1 The structure of Schiff base (S1) with atom and ring labelling. The compound is depicted in the syn-form. | ||
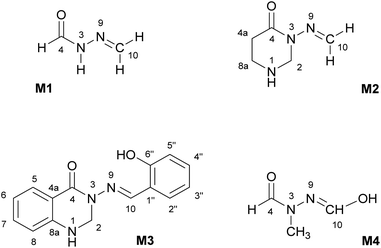 | ||
Fig. 2 Model compounds (M1–M4) containing the N–N![[double bond, length as m-dash]](https://www.rsc.org/images/entities/char_e001.gif) CH moiety. The atom labelling is according to compound S1. All compounds are depicted in the anti-form. CH moiety. The atom labelling is according to compound S1. All compounds are depicted in the anti-form. | ||
2. Experimental section
2.1. Instruments
Stock solutions of compound S1 (c = 1 mM) in DMSO (SeccoSolv, Merck, Germany) were freshly prepared directly before measurements. The solutions of all spin traps were prepared in dried DMSO (SeccoSolv, Merck, Germany). The spin-trapping agent 5,5-dimethyl-1-pyrroline-N-oxide (DMPO; Sigma-Aldrich, Switzerland) was distilled before application, 2,3,5,6-α-(4-pyridyl-N-oxide)-N-tert-butylnitrone (POBN; Sigma-Aldrich, Switzerland) and 2,3,5,6-tetramethylnitrosobenzene (nitrosodurene, ND, Sigma-Aldrich, Switzerland) were used without any previous purification. Saturated ND solutions were prepared before the experiments due to the limited solubility of ND in DMSO. Solutions of the investigated compounds with a spin-trapping agent present (DMPO, POBN and ND) were mixed before the EPR measurements in the presence of air. The final mixtures were immediately transferred to a quartz flat cell (WG 808-Q, Wilmad-LabGlass, USA) and directly irradiated at 20 °C in a standard rectangular EPR cavity (ER 4102 ST, Bruker, Germany). A monochromatic radiator (λmax = 365 nm; Bluepoint LED, Hönle UV Technology, Germany) was used as a source of UV light. The presence of reactive paramagnetic intermediates generated upon UV/VIS irradiation was monitored by cw-EPR spectroscopy using a Bruker EMX Plus (Germany) spectrometer at 9.5 GHz (X-band). The g-values were determined by the built-in magnetometer. The in situ EPR spectra were then processed and simulated by the WinEPR (Bruker, Germany) and Winsim 2002 (NIEHS, USA) software.High-resolution NMR spectra of S1 were recorded in a 5 mm cryoprobe on a Bruker Avance III HD (Germany) spectrometer at 14 T. One-dimensional 600 MHz 1H and 150 MHz 13C NMR spectra, together with two-dimensional COSY, NOESY, ROESY, HSQC, and HMBC, enabled determination of the 1H and 13C chemical shifts (referenced to internal TMS) and 1H–1H intramolecular NOEs. Variable-temperature measurements (from 20 °C up to 65 °C) were performed in order to monitor the variations in the chemical shifts of the labile protons. Samples were then exposed to high-powered (500 μW cm−2 at a distance of 10 cm) UV irradiation (365 nm) using a UV lamp (Krüss Optronics, Germany) equipped with VIS filters which effectively filter the visible light from the tubes. The irradiation times were 2, 4, 6, 8, 10, 20, 30 and 60 minutes. 1D and 2D NMR spectra of the irradiated samples were then measured at 14 T under the same experimental conditions as before UV light exposure.
2.2. Computational details
Calculations were performed on the smaller model systems (M1–M4) and on the full Schiff's base (S1) with Gaussian 09 (ref. 34) using the ωB97XD35 functional. The basis sets chosen were LanL2DZ,36 6-311++G(2d,2p)37 and DGDZVP38 combined with the SMD model39 for the approximation of the DMSO solvent environment. The functional ωB97XD was employed in all types of calculations as it was previously found suitable for calculating similar organic systems.40 The convergence criteria were set to tight unless otherwise noted, using (for S1 only) an ultrafine integration grid. Additionally, some calculations with CCSD41 and basis sets cc-pVDZ42 and cc-pVTZ43 were performed for comparison (with normal, not tight, convergence criteria). Excited state calculations – both single-point and, in some cases, optimisation – were performed using TD-DFT44 and, for benchmarking, EOM-CCSD.45 Additionally, CAS-SCF calculations were performed for benchmarking purposes, using OpenMolcas.46 Only singlet excited states were considered.3. Results and discussion
3.1. EPR spectroscopy
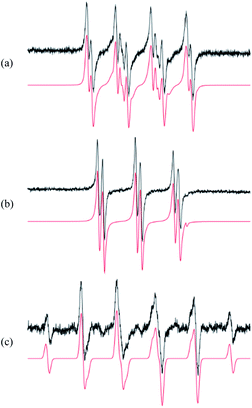
The first step in analysis of the compounds was to apply EPR spin-trapping techniques to study the photoinduced generation of reactive paramagnetic intermediates on UV irradiation. Multiple spin-trapping agents (DMPO, POBN, ND) were used in order to detect and identify reactive species. Exposure of S1 to UV caused immediate generation of the EPR signals of the corresponding spin-adducts. Photoactivation of S1 in aerated DMPO/DMSO solution resulted in the generation of a twelve-line signal (aN = 1.276 mT, aβH = 1.033 mT, aγH = 0.137 mT; g = 2.0059) attributed to the ˙DMPO–O2− adduct (Fig. 3a). The spin-adduct ˙DMPO–O2− is formed by the interaction of the excited states of S1 with atmospheric oxygen via consecutive electron-transfer reactions.47 In addition, other oxygen-centred radical adducts were found, namely ˙DMPO–OCH3 (aN = 1.304 mT, aβH = 0.844 mT, aγH = 0.189 mT; g = 2.0059, 37%) and other alkoxy radicals (˙DMPO–OR′) (aN = 1.362 mT, aβH = 1.175 mT; g = 2.0058, 3%). The formation of the aforementioned spin-adducts is associated with the interaction of in situ formation of O2˙− with the DMSO solvent.48Application of POBN resulted in the formation of an EPR signal (Fig. 3b) wherein two oxygen-centred adducts with very similar coupling constants were identified. The hyperfine coupling constants indicated the adduct ˙POBN–OCH3 (aN = 1.358 mT, aβH = 0.169 mT, g = 2.0059) to be the dominant product in the system (98%). The other adduct, ˙POBN–O2− (aN = 1.479 mT, aβH = 0.219 mT, g = 2.0059), represented about 2% of the total radical concentration. Furthermore, carbon-centred adducts were also investigated. The spin-trapping agent nitrosodurene, suitable for the detection of carbon-centred radicals, unambiguously confirmed the production of methyl radical, forming ˙ND–CH3 (aN = 1.394 mT, aβH(3H) = 1.27 mT; g = 2.006, 100%) (Fig. 3c) and no other radicals.
The presence of reactive intermediates in the system gives us information on the photochemical behaviour of compounds upon irradiation. The detected radicals arise from consecutive reactions between superoxide (produced by electron transfer from excited-state S1) and the solvent.49,50 The resulting spin-adducts cannot be directly used for complete structural analysis, but are sufficient to confirm the presence of radical intermediates.
Photoexcitation is in many cases associated with chemical bond rearrangement, especially in conjugated systems.3,51 Many studies52–54 have described these processes, wherein structural changes in the excited state allows the system to undergo photochemical isomerization via several pathways.55–57 The NMR and DFT calculations were therefore focused on the analysis of structural changes in S1 that may plausibly be induced by the photochemical processes.
3.2. NMR spectroscopy
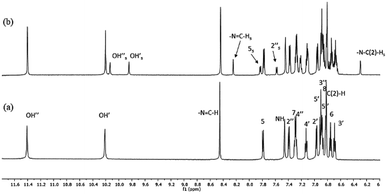
High-resolution 1H NMR spectra of the newly-synthesized compound S1 in DMSO is shown in Fig. 4a. The analysis of the solution structure confirmed that the pure anti-isomer had been obtained from the synthesis. UV irradiation (365 nm) in DMSO at room temperature led to considerable changes in the NMR spectra, and new resonances arose whose intensities increased with UV irradiation time (Fig. 4b). 2D HSQC and NOESY spectra, as well as comparison with our previous data,30 confirmed that these resonances originated from the syn-isomer, indicating anti–syn photoisomerization. Formation of the syn-isomer was relatively fast with respect to the previously-analysed analogues,30 and the maximum amount of conversion (25%) was observed within 10 min. The re-establishment of thermodynamic equilibrium (at room temperature), i.e. reversion to the anti-form, took about 15 min. Critically, experiments under inert atmosphere (to exclude atmospheric oxygen) made no visible difference to the spectra, making it unlikely that isomerisation proceeds through a radical mechanism involving electron transfer.The temperature coefficients of the –N3–N![[double bond, length as m-dash]](https://www.rsc.org/images/entities/char_e001.gif) C(H) protons and OH protons were determined from the chemical shift variations collected in high-resolution NMR spectra between 20 °C and 65 °C for the anti-isomer (Table 1). The coefficients for the OH protons for S1 were −5.36 and −6.11 ppb K−1 and indicated that the OH groups are involved in intramolecular H-bonds with comparable strengths. Similarly, data for the –N3–N
C(H) protons and OH protons were determined from the chemical shift variations collected in high-resolution NMR spectra between 20 °C and 65 °C for the anti-isomer (Table 1). The coefficients for the OH protons for S1 were −5.36 and −6.11 ppb K−1 and indicated that the OH groups are involved in intramolecular H-bonds with comparable strengths. Similarly, data for the –N3–N![[double bond, length as m-dash]](https://www.rsc.org/images/entities/char_e001.gif) C(H) protons (−2.24 ppb K−1) and the NH protons (−5.11 ppb K−1) indicated that these groups are also involved in weak intra- and intermolecular H-bonds,58 as seen previously.30 However, fast reversion to the anti-isomer prevented us from performing temperature-dependent NMR measurements for the syn-isomer.
C(H) protons (−2.24 ppb K−1) and the NH protons (−5.11 ppb K−1) indicated that these groups are also involved in weak intra- and intermolecular H-bonds,58 as seen previously.30 However, fast reversion to the anti-isomer prevented us from performing temperature-dependent NMR measurements for the syn-isomer.
![[double bond, length as m-dash]](https://www.rsc.org/images/entities/char_e001.gif) C(H) and –OH protons in S1
C(H) and –OH protons in S1
| (20 °C) | (25 °C) | (35 °C) | (45 °C) | (55 °C) | (65 °C) | ppb K−1 | |||
|---|---|---|---|---|---|---|---|---|---|
| S1 | anti- | –OH′ | 10.233 | 10.203 | 10.142 | 10.080 | 10.020 | 9.958 | −6.11 |
| –OH′′ | 11.434 | 11.409 | 11.353 | 11.299 | 11.246 | 11.193 | −5.36 | ||
N3–N![[double bond, length as m-dash]](https://www.rsc.org/images/entities/char_e001.gif) CH CH |
8.441 | 8.454 | 8.477 | 8.499 | 8.522 | 8.542 | −2.24 | ||
| –NH | 7.484 | 7.460 | 7.408 | 7.357 | 7.305 | 7.254 | −5.11 | ||
3.3. DFT calculations
The relative energies between the anti- and syn-forms for all model compounds M1–M4 and S1 are listed in Table 2 and the selected geometry parameters are in Table 3. The energy difference between the anti- and syn-forms is 7.56 kJ mol−1 (3.00 mH) for S1 (for comparison with M1–M4, see Table 2) and is comparable to those previously analysed.30,59,60 Comparison of M2 with M3 indicates that the energy gap between the two isomers is slightly decreased by extending the π-system with additional benzene rings; on going from M3 to S1, additional interactions between ring B and ring C (presumably dispersion and/or electrostatic effects) then stabilise the anti-form, increasing the energy gap again. However, as noted in Section 3.3.2, the DFT calculations may not be completely reliable for energy differences.
| Compound | M1 | M2 | M3 | M4 | S1 |
| ΔEsyn − ΔEanti | 7.88 | 6.09 | 4.99 | 2.39 | 7.56 |
| M1 | M2 | M3 | M4 | S1 | |||||||
|---|---|---|---|---|---|---|---|---|---|---|---|
| anti- | syn- | anti- | syn- | anti- | syn- | anti- | syn- | anti- | syn- | ||
| Bond length | C1′′–C6′′ | — | — | — | — | 1.410 | 1.409 | — | — | 1.410 | 1.410 |
| C10–C1′′ | — | — | — | — | 1.458 | 1.453 | — | — | 1.457 | 1.453 | |
| N3–N9 | 1.365 | 1.371 | 1.365 | 1.375 | 1.357 | 1.387 | 1.374 | 1.402 | 1.360 | 1.386 | |
| C10–N9 | 1.267 | 1.272 | 1.270 | 1.272 | 1.278 | 1.280 | 1.265 | 1.268 | 1.278 | 1.279 | |
| C4–N3 | 1.356 | 1.356 | 1.380 | 1.368 | 1.385 | 1.385 | 1.358 | 1.349 | 1.388 | 1.384 | |
| C2–N3 | — | — | 1.463 | 1.471 | 1.459 | 1.462 | 1.449 | 1.447 | 1.458 | 1.459 | |
| Bond angle | N3–N9–C10 | 120.7 | 116.5 | 120.1 | 123.1 | 122.7 | 117.5 | 118.6 | 113.4 | 122.5 | 117.9 |
| N9–C10–C1′′ | — | — | — | — | 119.4 | 120.7 | — | — | 119.4 | 120.3 | |
| C4–N3–C2 | — | — | 123.8 | 122.3 | 121.3 | 118.2 | 121.2 | 122.5 | 122.5 | 120.8 | |
| C8a–N1–C2 | — | — | 110.4 | 109.8 | 116.7 | 115.2 | — | — | 116.8 | 116.3 | |
| N1–C2–N3 | — | — | 110.4 | 110.2 | 109.0 | 108.0 | — | — | 108.2 | 107.4 | |
| C4–N3–N9 | 121.6 | 130.8 | 115.8 | 126.5 | 114.9 | 119.8 | 117.1 | 120.8 | 115.0 | 120.6 | |
| C1′–C2–N3 | — | — | — | — | — | — | — | — | 112.4 | 113.4 | |
| Torsion angle | C4–N3–N9–C10 | −180 | 0 | −170.9 | 14.8 | −165.7 | 58.9 | −180 | −67.1 | −167.3 | 57.4 |
| C2–N3–N9–C10 | — | — | 3.4 | −177.7 | −1.5 | −156.8 | 0 | 131.1 | 1.3 | −151.9 | |
| N3–N9–C10–C1′′ | — | — | — | — | −179.5 | −178.0 | — | — | 179.9 | −178.1 | |
| N9–C10–C1′′–C6′′ | — | — | — | — | −2.2 | 1.0 | — | — | −2.3 | 2.0 | |
| N3–C2–C1′–C2′ | — | — | — | — | — | — | — | — | −9.3 | −11.7 | |
| N1–C2–N3–C4 | — | — | −21.8 | −31.1 | −41.8 | −53.6 | — | — | −38.7 | −48.1 | |
The bond lengths in the aromatic rings of both the anti- and syn-forms S1 were generally in the range of 1.38–1.41 Å (Table 3) and correspond to those in structurally-related molecules.61,62 Virtually no differences were observed in the C10–C1′′ bond lengths (1.53–1.57 Å), which are comparable with single bonds in similar systems.63 The N3–N9 bond has partial double-bond character (1.360 Å for anti- and 1.386 Å for the syn-isomer in S1) as it partakes in a delocalised system stretching from the ring A to ring C (Fig. 5). The effect of the delocalisation along the C4–N3–N9–C10 array is clearly visible from the calculated bond length values. The C4–N3 bond is shortest for M1 and longest for S1, indicating the elongation of this bond with addition of the substituents (Table 3, row 5). Incorporation of the heterocyclic moiety (M2) to the structure of M1 caused elongation of the bond (1.380 vs. 1.356 Å). A significant effect is also seen after addition of the aromatic ring C to the carbon atom C10; there is a visible zigzag double-bond formation in the C4–N3–N9–C10 linkage, where the N3–N9 bond was shortened and the N9–C10 bond was prolonged (Table 3, rows 3 and 4, respectively). On the other hand, the differences between M3 and S1 are minimal; the presence of the ring B has a negligible effect on the C4–N3–N9–C10 moiety (Fig. 1). Due to the absence of heterocyclic or aromatic rings in the M4 structure, different structural changes were seen in this derivative, namely a significant prolongation of the N3–N9 bond (the longest of all derivatives; Table 3) as the result of the shortening of both the N9–C10 (the shortest out of all compounds, Table 3) and the C4–N3 bonds. This effect is caused by the conjugation of the non-bonding pairs from the nearby electron-donating OH group with the N9–C10 linkage. This is also confirmed by the N3–N9–C10 bond angle, which is more than 2° narrower (3° for syn-) compared to M1 (Table 3, first row). The effect of OH group is further discussed in Section 2.4.3.
The computed values of the N3–N9![[double bond, length as m-dash]](https://www.rsc.org/images/entities/char_e001.gif) C10 bond angles vary by less than 5°, i.e. the system is quite rigid. Similar differences between anti- and syn-forms are also seen for the C4–N3–N9 bond angle (up to 10°). As seen from the calculated dihedral angles, the C4–N3–N9
C10 bond angles vary by less than 5°, i.e. the system is quite rigid. Similar differences between anti- and syn-forms are also seen for the C4–N3–N9 bond angle (up to 10°). As seen from the calculated dihedral angles, the C4–N3–N9![[double bond, length as m-dash]](https://www.rsc.org/images/entities/char_e001.gif) C10 torsion angle – representing planarity of the system around the N3–N9 moiety – is more sensitive to the presence of functional groups, including aromatic systems. Whereas the angle is about 13° away from planar for the anti-isomer, a significant deviation from planarity is observed in the case of syn-isomer (approx. 57°); this will be discussed in Section 3.3.3 below. As expected, the torsion angle for N3–N9
C10 torsion angle – representing planarity of the system around the N3–N9 moiety – is more sensitive to the presence of functional groups, including aromatic systems. Whereas the angle is about 13° away from planar for the anti-isomer, a significant deviation from planarity is observed in the case of syn-isomer (approx. 57°); this will be discussed in Section 3.3.3 below. As expected, the torsion angle for N3–N9![[double bond, length as m-dash]](https://www.rsc.org/images/entities/char_e001.gif) C10–C1′′ is close to 0° (varying by up to 2°) for S1. The difference between M3 and S1 is minimal, indicating that ring B has no effect on the N3–N9
C10–C1′′ is close to 0° (varying by up to 2°) for S1. The difference between M3 and S1 is minimal, indicating that ring B has no effect on the N3–N9![[double bond, length as m-dash]](https://www.rsc.org/images/entities/char_e001.gif) C10–C1′′ the dihedral angle. The effect of ring B was seen only for dihedral angle N1–C2–N3–C4 (varying by approx. 5°), as expected.
C10–C1′′ the dihedral angle. The effect of ring B was seen only for dihedral angle N1–C2–N3–C4 (varying by approx. 5°), as expected.
![[double bond, length as m-dash]](https://www.rsc.org/images/entities/char_e001.gif) C10 torsion angle (Fig. S1†) is qualitatively similar for all methods. (We will henceforth label this torsion angle as ϕ(C–N–N–C) for simplicity.) The ωB97XD functional with the smaller basis – labelled WB-L2 – overestimates the height of the energy barrier, but WB-6+ (the larger basis) gives more reasonable results. The syn–anti energy difference is also more accurate with WB-6+ than WB-L2. However, the results for M2 and M4 show that the syn–anti energy difference is not too reliable even with the larger basis set. The overestimate of energy barriers by WB-L2 is a general trend, though; and, as discussed below, WB-L2 fails to describe certain features of the ground-state energy profile for both M2 and M4.
C10 torsion angle (Fig. S1†) is qualitatively similar for all methods. (We will henceforth label this torsion angle as ϕ(C–N–N–C) for simplicity.) The ωB97XD functional with the smaller basis – labelled WB-L2 – overestimates the height of the energy barrier, but WB-6+ (the larger basis) gives more reasonable results. The syn–anti energy difference is also more accurate with WB-6+ than WB-L2. However, the results for M2 and M4 show that the syn–anti energy difference is not too reliable even with the larger basis set. The overestimate of energy barriers by WB-L2 is a general trend, though; and, as discussed below, WB-L2 fails to describe certain features of the ground-state energy profile for both M2 and M4.The vertical excitation energy curves for the first three singlet excited states of M1 are compared to EOM-CCSD and CASSCF results in the ESI.† The energy curves look somewhat similar for CC-TZ and WB-6+; the CASSCF results depend on the excitations included, but frequently differ in having a small peak in the 120–150° region for the first excited state, and possibly the second. TD-DFT and CASSCF have the same state ordering for the first three excited states (in order, excitations from HOMO-1, HOMO, and HOMO-2 to LUMO); EOM-CCSD has the 2nd and 3rd of these swapped around, and accordingly has the oscillator strengths swapped as well (TD-DFT has ES1 and ES3 as dark states; EOM-CCSD has ES1 and ES2 as dark states. CASSCF, however, predicts all three states to be dark.) Overall, the WB-6+ level seems to be mostly accurate enough for our purposes, but should be treated with caution regarding the syn–anti energy difference.
Calculations at EOM-CCSD level have also been performed for the first excited state of M2; these are in approximate agreement with TD-DFT results (see ESI†).
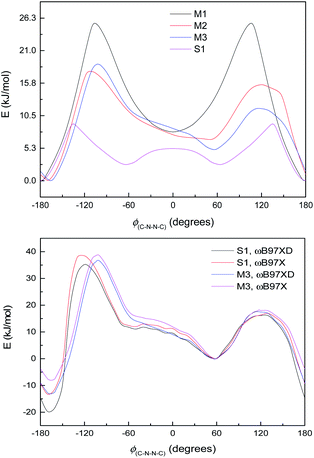
The difference between S1 and M3 is the aromatic ring B, which does not participate in the large π-system, and whose principal effect on the energy curve will be steric, electronic and possibly dispersion interactions with ring C on the other side of the N–N bond. Fig. 6, bottom, shows the energy curves of S1 and M3, adjusted so the syn minima coincide; the difference made by the extra –C6H4OH group is to lower the energy of the anti-conformer in S1 and also to shift the position of the peak at ∼−100 to −110° in the direction of the anti-conformer. Calculations with the ωB97X functional,64 i.e. without dispersion corrections, are also shown in Fig. 6, bottom (adjusted relative to the syn-form); these indicate that the lower energy of the anti-conformer is due to dispersion interactions (presumably between rings B and C), although the shift in the peak position remains unexplained.
The small shoulder around 0° in S1 and M3 (Fig. 6, bottom), which pushes the syn minimum to >50°, is visible as a peak in its own right in the energy curve for M4 (Fig. 7, top), which lacks an extended π-system and has an OH group attached directly to the Schiff's base moiety. M4 displays minima at ±60° and 180°, with a small peak at 0° and larger peaks at ±135° (Fig. 7, top). This suggests that the peak (or shoulder) at 0° arises from resonance structures with negative charge at the Schiff's base nitrogen (Fig. 7, bottom). M4, with a nearby electron-donating OH group, naturally shows such effects most strongly; in the larger π-systems of S1 and M3, where the OH group is further away and the peaks at ±100–130° are asymmetric, the 0° peak is merely a shoulder to whichever peak is closer to 0°. In M2, which has no electron-donating group, this effect is weaker: the shoulder is less pronounced, and disappears when a polarisable continuum model (PCM) is used instead of SMD. (PCM encourages charge separation less than SMD, so would understate the effects of charge-separated resonance structures. However, PCM only removes this peak/shoulder for M2; it is found even with PCM for M3, M4 and S1.)
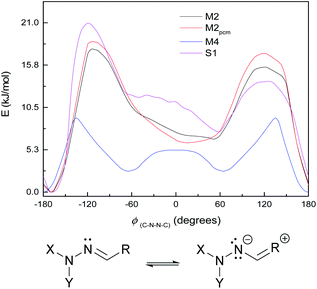 | ||
| Fig. 7 Top: ground-state energy curves for S1, M2, M4, and M2pcm against ϕ(C–N–N–C). Bottom: resonance structure with negative charge on Schiff's-base nitrogen. | ||
(We note that we chose M4 as a striking example of this effect; for the system HCO–NH–N![[double bond, length as m-dash]](https://www.rsc.org/images/entities/char_e001.gif) CH–OH, i.e. M4 with CH3 replaced by H or M1 with an additional OH, the peak around 0° is present but weaker and noisier. The effect is also seen with NH2 instead of OH.)
CH–OH, i.e. M4 with CH3 replaced by H or M1 with an additional OH, the peak around 0° is present but weaker and noisier. The effect is also seen with NH2 instead of OH.)
These curves were all calculated at the WB-6+ level (except where noted). It is also notable that the WB-L2 level fails to find the peak/shoulder at 0° for M2 and M4, and does not find a significant shoulder for the larger model systems (see ESI†); it appears that this effect needs a large basis to be treated properly. (This effect is present at CC-DZ level for M2 and M4, so it is not an artefact of the ωB97XD functional.) The appearance of peaks at 0° and a little over 120°, but not at 180°, suggests an explanation of steric repulsion between the C![[double bond, length as m-dash]](https://www.rsc.org/images/entities/char_e001.gif) O group and the electron pairs (two lone pairs, one N–C bond) on sp3-hybridised N−.
O group and the electron pairs (two lone pairs, one N–C bond) on sp3-hybridised N−.
The topic of how the π-system responds to substituents on the aromatic rings (and how this relates to the experimentally-observable properties of differently-substituted Schiff's bases) is an interesting one, and we are preparing a second paper which will discuss the matter in more depth.
Fig. 8 shows the energy curves for the ground state and first three singlet excited states of M1, the most basic model system. (These are energy curves using the ground-state geometries rather than geometries reoptimised for the excited states.) The excited states have kinks or discontinuities around 107° for reasons that are discussed in the ESI (section Excited states):† essentially, the ground state has a slightly different character for the ranges 0–107° and 107–180°, and so do the excited states as a result. The first excited state, according to DFT (and EOM-CCSD), has its highest energy at 180°, and its lowest energy at 0°; although as mentioned the CASSCF calculations have 180° as a local minimum and a small peak around 120° (ESI, section Excited states†). Attempted optimisation of the excited states leads to very small energy differences, indicating a conical intersection of ES1 with the ground state across most of the range of ϕ(C–N–N–C) – in spite of the large vertical excitation energies and also a conical intersection between the first and second excited states. (The optimisation leads to negligibly small energy differences.)
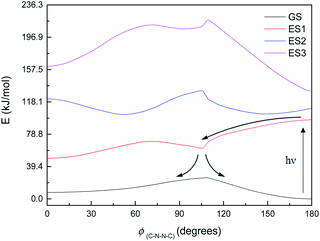 | ||
| Fig. 8 Energy curves for the ground state (GS) and first three excited states (ES1–ES3) of M1. Relative energies (kJ mol−1) of the states have been heavily adjusted for clarity. | ||
The first excited state has a vertical excitation energy profile that could lend itself to anti–syn isomerisation – generally decreasing in energy from anti to syn (though as mentioned, CAS-SCF disagrees with TD-DFT and EOM-CCSD on this). (However, the energy profile of the GS-S1 conical intersection has an energy barrier around 105°, as for the ground state.) The second excited state similarly has an appropriate energy profile, with a local minimum around 120–150° that could relax to the top of the GS energy barrier. However, the oscillator strength for the transition to ES1 is very low according to all methods (f < 0.01 for the anti-conformer); ES2 is accessible according to TD-DFT (f = 0.480) but not CASSCF or EOM-CCSD. Isomerisation would thus require some higher-energy excitation, which would then relax to S1 and perhaps cross to the other side of the 107° energy barrier before falling through the conical intersection; or could relax to ES2, move to the local minimum around 120–150°, and then relax to ES1 and thence to GS. We note that ES1 arises from an n–π* transition, and ES2 from a π–π* transition; these correspond to HOMO–LUMO or nHOMO–LUMO (according to whether the HOMO or nHOMO are n or π in character; this changes with dihedral angle). ES3 and ES4 are π–π* states. The NTOs for these states are depicted in the ESI (section Excited states).†
This, however, is the simplest possible system. M2 is slightly closer to the full system, having the C4N2 ring but not the extensive π-system. The excited state energy curves for M2 are shown in Fig. 9. There are significant differences from M1: the ES1 state has an energy maximum around 0° (the syn conformation), instead of an energy minimum; and ES2 looks more like the ground state than it does in M1. More importantly, however, the oscillator strengths are a little higher: still very small for ES1 (f = 0.035) but f > 0.1 for both ES2 and ES3. (ES3 – data not shown – looks similar to ES3 for M1, including a deep minimum at 180°.) We can imagine a similar mechanism to M1: excitation to ES2 and relaxation to ES1 and then GS, with movement to the other side of the energy barrier while in ES1. (Again, there seem to be conical intersections between the states.)
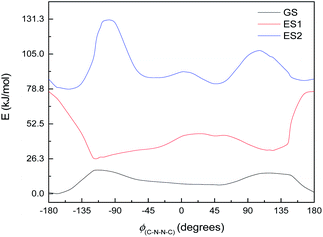 | ||
| Fig. 9 Ground state (GS) and first two excited states (ES1 and ES2) energy curves for M2. Relative energies of the curves have been adjusted for clarity. | ||
By the time we get to M3 and S1, the situation looks a little different. The π-system is significantly larger, and as a result, there are now three π–π* excitations lying below the n–π* excitation, so the n–π* excited state is now the 4th (ES4), instead of the 1st as seen in M1. (The energy curves are shown in Fig. 10; the excited states look very similar for both M3 and S1.) The n–π* excited state energy curve also has minima in-plane and maxima out-of-plane, just like the ground state; it is therefore not expected to play any role in isomerization. (Its oscillator strength continues to be rather low – f = 0.016.)
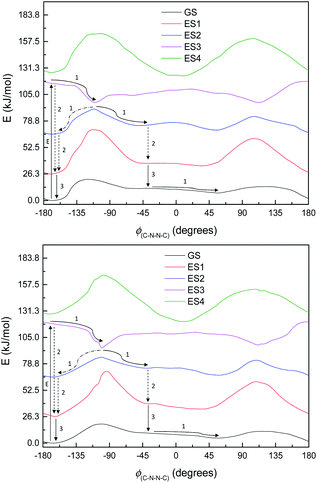
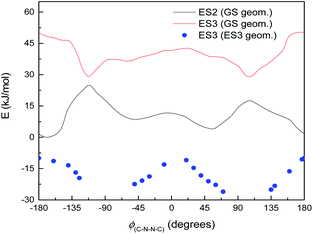
Of the three lower-lying π–π* excited states, the first two have similar energy profiles to the ground state; but the third has an inverted energy profile, and a conical intersection with the 2nd excited state. (These excitations also have moderately high oscillator strengths – 0.478, 0.236, 0.295.) This provides an obvious pathway for photoisomerization, similar to the pathway in the model systems: a molecule excited to ES3 undergoes structural relaxation to the conical intersections at ±90°, and thence to either the syn- or anti-conformer of ES2, and then undergoes internal conversion (IC) to ES1 (or undergoes IC from ES2 before relaxing to the syn- or anti-form). Unlike in other systems, however, our proposed isomerisation mechanism would compete with IC, which, after excitation, would relax the molecule to the anti-conformer of ES2 and then ES1, preventing isomerisation. These two pathways are labelled in Fig. 10.
Normally in photochemical reactions, IC is fast enough to ensure that only the lowest excited state (of the relevant multiplicity) undergoes any reaction, due to the population of higher excited states diminishing too quickly for reactions to take place; this is the extension of Kasha's rule65 to photochemistry. However, in cases where either IC is slowed down or the reaction is sufficiently fast, reaction from higher excited states may be seen (see ref. 66 and 67 for an overview). Our suggested mechanism fits the latter criterion: movement down the potential energy slope is simple structural relaxation, without so much as an energy barrier. This would be expected to take place on the timescale of nuclear motion (<1 ps), and thus be competitive with IC. The third excited state has been optimised for much of the ϕ(C–N–N![[double bond, length as m-dash]](https://www.rsc.org/images/entities/char_e001.gif) C) curve: Fig. 11 shows the energies, compared to the vertical excitation energies for the 2nd and 3rd excited state. (There are gaps in the energy curve due to the ES2/ES3 energy difference becoming negligible, i.e. conical intersection.)
C) curve: Fig. 11 shows the energies, compared to the vertical excitation energies for the 2nd and 3rd excited state. (There are gaps in the energy curve due to the ES2/ES3 energy difference becoming negligible, i.e. conical intersection.)
Natural transition orbitals (NTOs) for multiple states of S1 are shown in Fig. 12.
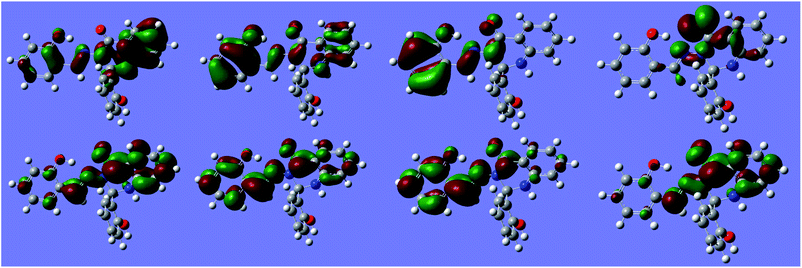 | ||
| Fig. 12 Natural Transition Orbitals (NTOs) for S1 at −170° (anti minimum). Top: hole orbital. Bottom: excited orbital. Left to right: states ES1 to ES4. Isosurface value: 10−1.29. | ||
Our calculations thus indicate that, for these systems, whether photoisomerization involves n–π* excitations or proceeds purely via π–π* states is determined by the π-system size – a large enough π-system will have a suitable π–π* excitation lower than the n–π* excitation; furthermore, the n–π* excitation changes its energy profile with size, having a more suitable energy profile for isomerisation in the smaller systems than in the larger. Small model calculations are thus of limited use here; the full π-system needs to be simulated in order to investigate the excited states properly.
4. Conclusions
Experimental and theoretical analysis of the photoswitching behaviour of the N–N linkage in Schiff base (S1) possessing a quinazolinone moiety, as well as calculations on model compounds (M1–M4), have been performed. UV irradiation (365 nm) caused generation of reactive intermediates of S1 in DMSO solutions. The formation of radicals (detected by EPR spectroscopy using the spin-trapping technique) resulted from the activation of molecular oxygen by interaction with the excited states of S1 via an electron-transfer process. The activated oxygen molecules further interacted with the DMSO solvent in a series of consecutive reactions to form several spin-adducts, predominantly the ˙DMPO–O2− adduct. Other spin-adducts, namely ˙DMPO–OCH3, ˙DMPO–OR′ and ˙DMPO–CH3, were detected as well. Subsequent NMR experiments clearly showed formation of the new resonances in high-resolution NMR spectra as the consequence of UV irradiation. The analysis confirmed that these resonances originated from the syn-isomer due to isomerization at the N–N linkage. The anti- to syn-isomerization was relatively fast and the maximum amount of conversion (25%) was detected within 10 min; the thermodynamic equilibrium re-established itself in about 15 min.Theoretical analysis was performed, involving geometry optimisation at the DFT level (ωB97XD/6-311++G(2d,2p)) and TD-DFT calculations of excited states. Use of a smaller basis set (LANL2DZ) led to qualitatively different energy profiles in some cases. The calculations found the anti-form to be lower in energy than the syn-form, in accordance with experiment. Isomerization was accompanied by variation of various geometrical parameters, mainly those of or near the C4–N3–N9–C10 array. The N3–N9 bond length varied by 0.026 Å between the anti- and syn-forms due to different electron delocalisation in the different forms of S1; marked differences in this bond length were seen in the model compounds M1–M4 as well. The torsion angle C4–N3–N9–C10, whose minima constitute the syn- and anti-conformers, is affected by the structure and substitution of the molecule in various ways; these have been discussed for M1–M4 and S1 and will be further analysed in a future paper.
The excited state energy curves and natural transition orbitals of the excitations differ with size. For the models with minimal π-systems (M1 and M2), the lowest excitation with an appropriate energy profile is an n–π* transition; there are few π*-orbitals due to the minimal π-system, and therefore no π–π* transitions below the n–π* transition. However, the low oscillator strengths of the n–π* transitions would require a route through a π–π* transition and subsequent relaxation. The larger model, M3, reproduces the behaviour of the full system (S1) reasonably well, in terms of both the ground-state energy curve and the nature of the excited states. For M3 and S1, the 3rd singlet–singlet excitation (π–π*) results in an excited state with an appropriate energy profile for isomerisation; lower excitations are unlikely to be involved.
Conflicts of interest
All authors declare that there are no conflicts of interests.Acknowledgements
The authors acknowledge financial support from the Slovak Grant Agency VEGA grants no. 2/0022/18 and grant APVV-15-0726. Part of the Gaussian calculations were performed at the Computing Centre of the SAS using the supercomputing infrastructure acquired in projects ITMS 26230120002 and 26210120002, both supported by the Research & Development Operational Program funded by the ERDF. Some calculations (those using OpenMolcas) were performed on the Prašivá cluster of the University of Comenius, Bratislava.References
- H. Kandori, Y. Shichida and T. Yoshizawa, Biochemistry, 2001, 66, 1197–1209 CAS.
- C. Dugave, Cis–trans Isomerization in Biochemistry, Wiley, Weinheim, Germany, 1st edn, 2006 Search PubMed.
- C. Dugave and L. Demange, Chem. Rev., 2003, 103, 2475–2532 CrossRef CAS PubMed.
- S. Gozem, H. L. Luk, I. Schapiro and M. Olivucci, Chem. Rev., 2017, 117, 13502–13565 CrossRef CAS PubMed.
- T. Kumpulainen, B. Lang, A. Rosspeintner and E. Vauthey, Chem. Rev., 2017, 117, 10826–10939 CrossRef CAS PubMed.
- I. K. Lednev, T.-Q. Ye, P. Matousek, M. Towrie, P. Foggi, F. V. R. Neuwahl, S. Umapathy, R. E. Hester and J. N. Moore, Chem. Phys. Lett., 1998, 290, 68–74 CrossRef CAS.
- G. Hegde, A. R. Yuvaraj, W. Sinn-Yam and M. M. Yusoff, Macromol. Symp., 2015, 353, 240–245 CrossRef CAS.
- C. Kubli-Garfias, K. Salazar-Salinas, E. C. Perez-Angel and J. M. Seminario, J. Mol. Model., 2011, 17, 2539–2547 CrossRef CAS PubMed.
- A. R. Yuvaraj, G. S. Mei, A. D. Kulkarni, M. Y. Mashitah, G. Hegde, D. N. Rodríguez and J. M. Otón, RSC Adv., 2014, 4, 50811–50818 RSC.
- A. Sinicropi, A. Migani, L. De Vico and M. Olivucci, Photochem. Photobiol. Sci., 2003, 2, 1250–1255 RSC.
- K. P. Rakesh, H. M. Manukumar and D. C. Gowda, Bioorg. Med. Chem. Lett., 2015, 25, 1072–1077 CrossRef CAS PubMed.
- G. Murtaza, A. Mumtaz, F. A. Khan, S. Ahmad, S. Azhar, M. Najam-Ul-Haq, M. Atif, S. A. Khan, A. Maalik, F. Alam and I. Hussain, Acta Pol. Pharm., 2014, 71, 531–535 Search PubMed.
- W. Al Zoubi and Y. G. Ko, Appl. Organomet. Chem., 2017, 31, 1–12 Search PubMed.
- K. M. Abuamer, A. A. Maihub, M. M. El-Ajaily, A. M. Etorki, M. M. Abou-Krisha and M. A. Almagani, Int. J. Org. Chem., 2014, 4, 7–15 CrossRef.
- S. M. Borisov, R. Pommer, J. Svec, S. Peters, V. Novakova and I. Klimant, J. Mater. Chem. C, 2018, 6, 8999–9009 RSC.
- W. Al Zoubi, Int. J. Org. Chem., 2013, 03, 73–95 CrossRef.
- K. Andiappan, A. Sanmugam, E. Deivanayagam, K. Karuppasamy, H. S. Kim and D. Vikraman, Sci. Rep., 2018, 8, 1–12 CrossRef CAS PubMed.
- A. Kajal, S. Bala, S. Kamboj, N. Sharma and V. Saini, J. Catal., 2013, 2013, 1–14 Search PubMed.
- E. Akila, M. Usharani, P. Maheswaran and R. Rajavel, International Journal of Advanced Scientific and Technical Research, 2013, 5, 477–491 Search PubMed.
- D. Chaturvedi and M. Kamboj, Chem. Sci. J., 2016, 7, e114 Search PubMed.
- E. L. de Araújo, H. F. G. Barbosa, E. R. Dockal and É. T. G. Cavalheiro, Int. J. Biol. Macromol., 2017, 95, 168–176 CrossRef PubMed.
- G. Grover and S. G. Kini, Eur. J. Med. Chem., 2006, 41, 256–262 CrossRef CAS PubMed.
- B. Marvania, P. C. Lee, R. Chaniyara, H. Dong, S. Suman, R. Kakadiya, T. C. Chou, T. C. Lee, A. Shah and T. L. Su, Bioorg. Med. Chem., 2011, 19, 1987–1998 CrossRef CAS PubMed.
- R. A. Smits, M. Adami, E. P. Istyastono, O. P. Zuiderveld, C. M. E. Van Dam, F. J. J. De Kanter, A. Jongejan, G. Coruzzi, R. Leurs and I. J. P. De Esch, J. Med. Chem., 2010, 53, 2390–2400 CrossRef CAS PubMed.
- I. Khan, S. Zaib, S. Batool, N. Abbas, Z. Ashraf, J. Iqbal and A. Saeed, Bioorg. Med. Chem., 2016, 24, 2361–2381 CrossRef CAS PubMed.
- N. M. Thong, T. C. Ngo, T. X. N. Phan, D. Q. Dao, T. Van Nam, P. T. T. Trinh and P. C. Nam, Am. J. Chem., 2015, 5, 91–95 Search PubMed.
- I. G. Ovchinnikova, G. A. Kim, E. G. Matochkina, M. I. Kodess, N. V. Barykin, O. S. Eltsov, E. V. Nosova, G. L. Rusinov and V. N. Charushin, Russ. Chem. Bull., 2014, 63, 2467–2477 CrossRef CAS.
- I. G. Ovchinnikova, G. A. Kim, E. G. Matochkina, M. I. Kodess, P. A. Slepukhin, I. S. Kovalev, E. V. Nosova, G. L. Rusinov and V. N. Charushin, J. Photochem. Photobiol., A, 2018, 351, 16–28 CrossRef CAS.
- E. S. Kelbysheva, L. N. Telegina, T. V. Strelkova, M. G. Ezernitskaya, E. V. Nosova, Y. A. Borisov, B. V. Lokshin and N. M. Loim, Eur. J. Inorg. Chem., 2018, 2018, 1945–1952 CrossRef CAS.
- M. Hricovíni and M. Hricovíni, Tetrahedron, 2017, 73, 252–261 CrossRef.
- C. R. Crecca and A. E. Roitberg, J. Phys. Chem. A, 2006, 110, 8188–8203 CrossRef CAS PubMed.
- K. Bujak, H. Orlikowska, J. G. Małecki, E. Schab-Balcerzak, S. Bartkiewicz, J. Bogucki, A. Sobolewska and J. Konieczkowska, Dyes Pigm., 2019, 160, 654–662 CrossRef CAS.
- Z. Hricovíniová, M. Hricovíni and K. Kozics, Chem. Pap., 2017, 72, 1041–1053 CrossRef.
- M. J. Frisch, G. W. Trucks, H. B. Schlegel, G. E. Scuseria, M. A. Robb, J. R. Cheeseman, G. Scalmani, V. Barone, B. Mennucci, G. A. Petersson, H. Nakatsuji, M. Caricato, X. Li, H. P. Hratchian, A. F. Izmaylov, J. Bloino, G. Zheng, J. L. Sonnenberg, M. Hada, M. Ehara, K. Toyota, R. Fukuda, J. Hasegawa, M. Ishida, T. Nakajima, Y. Honda, O. Kitao, H. Nakai, T. Vreven, J. A. Montgomery, J. E. Peralta, F. Ogliaro, M. Bearpark, J. J. Heyd, E. Brothers, K. N. Kudin, V. N. Staroverov, R. Kobayashi, J. Normand, K. Raghavachari, A. Rendell, J. C. Burant, S. S. Iyengar, J. Tomasi, M. Cossi, N. Rega, J. M. Millam, M. Klene, J. E. Knox, J. B. Cross, V. Bakken, C. Adamo, J. Jaramillo, R. Gomperts, R. E. Stratmann, O. Yazyev, A. J. Austin, R. Cammi, C. Pomelli, J. W. Ochterski, R. L. Martin, K. Mokoruma, G. Zakrzewski, G. A. Voth, P. Salvador, J. J. Dannenberg, S. Dapprich, A. D. Daniels, Ö. Farkas, J. V. Foresman, J. V. Ortiz, J. Cioslowski and D. J. Fox, Gaussian 09, Revision D.01, Gaussian, Inc., Wallingford CT, 2009 Search PubMed.
- J.-D. Chai and M. Head-Gordon, Phys. Chem. Chem. Phys., 2013, 9, 263–272 Search PubMed.
- T. H. Dunning and J. P. Hay, Gaussian basis sets for molecular calculations, Plenum Press, New York, 1977, vol. 3 Search PubMed.
- A. D. McLean and G. S. Chandler, J. Chem. Phys., 1980, 72, 5639–5648 CrossRef CAS.
- N. Godbout, D. R. Salahub, J. Andzelm and E. Wimmer, Can. J. Chem., 1992, 70, 560–571 CrossRef CAS.
- A. V. Marenich, C. J. Cramer and D. G. Truhlar, J. Phys. Chem. B, 2009, 113, 6378–6396 CrossRef CAS PubMed.
- N. Acar, C. Selçuki and E. Coşkun, J. Mol. Model., 2017, 23, 1–12 CrossRef CAS PubMed.
- G. D. Purvis and R. J. Bartlett, J. Chem. Phys., 1982, 76, 1910–1918 CrossRef CAS.
- J. T. H. Dunning, J. Chem. Phys., 1989, 90, 1007–1023 CrossRef.
- R. A. Kendall, T. H. Dunning and R. J. Harrison, J. Chem. Phys., 1992, 96, 6796–6806 CrossRef CAS.
- F. Trani, G. Scalmani, G. Zheng, I. Carnimeo, M. J. Frisch and V. Barone, J. Chem. Theory Comput., 2011, 7, 3304–3313 CrossRef CAS PubMed.
- J. F. Stanton and R. J. Bartlett, J. Chem. Phys., 1993, 98, 7029–7039 CrossRef CAS.
- I. F. Galván, M. Vacher, A. Alavi, C. Angeli, F. Aquilante, J. Autschbach, J. J. Bao, S. I. Bokarev, N. A. Bogdanov, R. K. Carlson, L. F. Chibotaru, J. Creutzberg, N. Dattani, M. G. Delcey, S. S. Dong, A. Dreuw, L. Freitag, L. M. Frutos, L. Gagliardi, F. Gendron, A. Giussani, L. González, G. Grell, M. Guo, C. E. Hoyer, M. Johansson, S. Keller, S. Knecht, G. Kovačević, E. Källman, G. Li Manni, M. Lundberg, Y. Ma, S. Mai, J. P. Malhado, P. Å. Malmqvist, P. Marquetand, S. A. Mewes, J. Norell, M. Olivucci, M. Oppel, Q. M. Phung, K. Pierloot, F. Plasser, M. Reiher, A. M. Sand, I. Schapiro, P. Sharma, C. J. Stein, L. K. Sørensen, D. G. Truhlar, M. Ugandi, L. Ungur, A. Valentini, S. Vancoillie, V. Veryazov, O. Weser, T. A. Wesołowski, P. O. Widmark, S. Wouters, A. Zech, J. P. Zobel and R. Lindh, J. Chem. Theory Comput., 2019, 15, 5925–5964 CrossRef PubMed.
- A. A. Krasnovsky, Biochemistry, 2007, 72, 1065–1080 CAS.
- R. Herscu-Kluska, A. Masarwa, M. Saphier, H. Cohen and D. Meyerstein, Chem.–Eur. J., 2008, 14, 5880–5889 CrossRef CAS PubMed.
- G. V. Buxton, C. L. Greenstock, W. P. Helman and A. B. Ross, J. Phys. Chem. Ref. Data, 1988, 17, 513–886 CrossRef CAS.
- M. Hayyan, M. A. Hashim and I. M. Alnashef, Chem. Rev., 2016, 116, 3029–3085 CrossRef CAS PubMed.
- L. Sobczyk, S. J. Grabowski and T. M. Krygowski, Chem. Rev., 2005, 105, 3513–3560 CrossRef CAS PubMed.
- L. Vuković, C. F. Burmeister, P. Král and G. Groenhof, J. Phys. Chem. Lett., 2013, 4, 1005–1011 CrossRef PubMed.
- Y. Wang, Z. Liu, Y. Xu and B. Zhang, J. Chem. Phys., 2015, 143, 064304 CrossRef PubMed.
- P. J. Coelho, M. C. R. Castro and M. M. M. Raposo, J. Photochem. Photobiol., A, 2013, 259, 59–65 CrossRef CAS.
- T. Fujino, S. Y. Arzhantsev and T. Tahara, J. Phys. Chem. A, 2001, 105, 8123–8129 CrossRef CAS.
- H. M. D. Bandara and S. C. Burdette, Chem. Soc. Rev., 2012, 41, 1809–1825 RSC.
- A. J. Pepino, M. A. Burgos Paci, W. J. Peláez and G. A. Argüello, Phys. Chem. Chem. Phys., 2015, 17, 12927–12934 RSC.
- Y. C. Lee, P. L. Jackson, M. J. Jablonsky, D. D. Muccio, R. R. Pfister, J. L. Haddox, C. I. Sommers, G. M. Anantharamaiah and M. Chaddha, Biopolymers, 2001, 58, 548–561 CrossRef CAS PubMed.
- E. W.-G. Diau, J. Phys. Chem. A, 2004, 108, 950–956 CrossRef CAS.
- E. Tajkhorshid, B. Paizs and S. Suhai, J. Phys. Chem. B, 1997, 101, 8021–8028 CrossRef CAS.
- T. T. Quang, K. P. P. Nguyen and P. E. Hansen, Magn. Reson. Chem., 2005, 43, 302–308 CrossRef PubMed.
- V. Ferraresi-Curotto, G. A. Echeverría, O. E. Piro, R. Pis-Diez and A. C. González-Baró, Spectrochim. Acta, Part A, 2015, 137, 692–700 CrossRef CAS PubMed.
- P. Suna, P. Hota and P. K. Misra, Indian J. Chem., Sect. A: Inorg., Bio-inorg., Phys., Theor. Anal. Chem., 2016, 55, 1192–1201 Search PubMed.
- Y. S. Lin, G. De Li, S. P. Mao and J. Da Chai, J. Chem. Theory Comput., 2013, 9, 263–272 CrossRef CAS PubMed.
- M. Kasha, Discuss. Faraday Soc., 1950, 9, 14 RSC.
- H. W. Tseng, J. Y. Shen, T. Y. Kuo, T. S. Tu, Y. A. Chen, A. P. Demchenko and P. T. Chou, Chem. Sci., 2016, 7, 655–665 RSC.
- A. P. Demchenko, V. I. Tomin and P. T. Chou, Chem. Rev., 2017, 117, 13353–13381 CrossRef CAS PubMed.
Footnote |
| † Electronic supplementary information (ESI) available. See DOI: 10.1039/c9ra10730d |
| This journal is © The Royal Society of Chemistry 2020 |

