DOI:
10.1039/C9RA10712F
(Paper)
RSC Adv., 2020,
10, 13066-13075
Human IgG1 Fc pH-dependent optimization from a constant pH molecular dynamics simulation analysis†
Received
19th December 2019
, Accepted 11th March 2020
First published on 31st March 2020
Abstract
The binding of IgG Fc with FcRn enables the long circulating half-life of IgG, where the Fc–FcRn complex interacts in a pH-dependent manner. This complex shows stronger interaction at pH ≤ 6.5 and weaker interaction at pH ≥ 7.4. The Fc–FcRn binding mechanism that promotes the long circulating half-life of IgG has prompted several IgG Fc-related mutational studies to focus on the pH-dependent Fc–FcRn complex interactions in order to improve the pharmacokinetic properties of Fc. Hence, in this study, we applied the in silico constant pH molecular dynamics (CpHMD) simulation approach to evaluate the human Fc–FcRn complex binding (pH 6.0) and dissociating (pH 7.5) mechanism at the molecular level. The analysis showed that the protonated state of the titratable residues changes from pH 6.0 to pH 7.5, where the disrupting energy for Fc–FcRn complex formation was found to be due to the electrostatic repulsion between the complex. According to the analysis, an Fc variant was computationally designed with an improved binding affinity at pH 6.0, which is still able to dissociate at pH 7.5 with FcRn at the in silico level. The binding free energy calculation via the MMPB/GBSA approach showed that the designed Fc mutant (MutM4) has increased binding affinity only at pH 6.0 compared with the reported mutant (YTE) Fc. This work demonstrates an alternative Fc design with better binding properties for FcRn, which can be useful for future experimental evaluation and validation.
Introduction
Monoclonal antibody (mAb) drugs have remained in a mainstream in the field of medical therapeutics with ∼80 drugs being approved by the Food and Drug Administration (FDA) till date.1 These mAbs have been used to treat various conditions such as cancer, infectious diseases and autoimmune disorders.2 Most of the approved mAbs apply full-size immunoglobulin G (IgG), which possesses powerful effector functions found in the full IgG scaffold such as antibody-dependent cellular cytotoxicity (ADCC), antibody-dependent cell-mediated phagocytosis (ADCP) and complementary-dependent cytotoxicity (CDC).3,4 Besides the aforementioned effector functions, the long in vivo serum half-life observed in a few IgG subclasses (IgG1, IgG2 and IgG4)5 has allowed the advantages of the potential therapeutics design to be conjugated with the effector function-containing IgG crystallisable fragment (Fc) region. This naturally occurring IgG1 has a circulating half-life of ∼21 days due to its low degradation rate, which is related to its escape from lysosomal protein catabolism by binding to the neonatal Fc receptor (FcRn) in a pH-dependent manner.6,7 The Fc–FcRn interaction is described to be strong at acidic pH (≤6.5) but weaker at neutral pH (≥7.4),8,9 where the binding of FcRn occurs at the Fc inter-β-sheet loops (CH2:loopAB, loopDE and CH3:loopFG). A detailed schematic representation of IgG-Fc was described in a review paper.2 From a biological aspect, an improved Fc–FcRn binding mechanism may contribute to an enhancement in the pharmacokinetics of mAb drugs. The prolonged half-life of designed drugs will encourage lower requirements for administration doses and frequencies.
To date, experimental pH-dependent solved structures are yet to be discovered, hence the in silico method can be an alternative approach to study the structural details of the IgG–FcRn complex at the molecular level, i.e. evaluation of the pH-dependent binding mechanism of the Fc–FcRn. The overall stoichiometry arrangement of Fc–FcRn complexes was found to be similar in both rodents and humans,8,10,11 where studies revealed the involvement of the FcRn α1-α2 domain platform interacting with the Fc CH2–CH3 domain interface loops. Engineering studies on IgG1 for FcRn have also been reported,12–18 with one of the most noteworthy Fc variant, the IgG1 Fc YTE mutant (Met252Tyr, Ser254Thr and Thr256Glu mutations). The IgG1 Fc YTE mutant was reported to show ∼10-fold improved pH-dependent binding affinity whilst exhibiting ∼2 to 4-fold prolonged serum half-life in humans.14
Often, the effects of the solvent environment such as pH are key factors in biochemical reactions, including the Fc–FcRn binding mechanism.5,11,15,19 Although conventional molecular dynamics (MD) simulation has prompted molecular discovery in biological studies, system settings with a fixed protonation state for solute titratable residues throughout the simulation may hinder the visualization of complex conformational changes in different pH environments. Thus, an auxiliary for MD simulation, constant pH molecular dynamics (CpHMD) simulation, which allows dynamic changes in the protonation states of titratable residues based on changes in the environmental pH was applied in this study. The CpHMD performs dynamic simulation of a system coupled with periodic Monte Carlo (MC) sampling of the protonation states for solute titratable residues. In this study, the simulation trajectories for all systems were further evaluated for their molecular interactions, characterized by the molecular mechanics Poisson–Boltzmann and generalized Born surface area (MMPB/GBSA) approach for binding free energy calculation. The data illustrated the agreement between the binding free energy calculations and the binding trend of other reported experimental results.
Methodology
Generating control complex structures
The initial human Fc–FcRn structure was obtained from the Protein Data Bank (PDB) with 3.80 Å resolution (PDB ID: 4N0U).8 This X-ray crystallographic structure is comprised of mutant-type IgG1 YTE Fc with three-point mutations (Met252Tyr, Ser254Thr and Thr256Glu mutation; denoted as MutYTE). However, the structure of wild-type (WT) human Fc complexed with FcRn is not available. Hence, the WT Fc was manually reverse mutated from MutYTE. Since Ile253, His310 and His435 were reported to be vital the residues for the FcRn interactions,20–22 a mutant Fc (Ile253Ala, His310Ala and His435Ala mutations; denoted as MutAAA) that was mutated from MutYTE was modelled and used as a counter measure for the non-binding Fc–FcRn complex. The IgG Fc variants (WT and MutAAA) were modelled using MODELLERv9.21.23 This work focused on the Fc interactions with the membrane-bound FcRn heavy chain (HC). The non-covalently bound β2-microglobulin (β2m) was excluded from FcRn in all the systems.
Constant pH molecular dynamics (CpHMD) simulation
AMBER18 suite24 was used for the simulation of all the systems, in accordance with the negative control MutAAA–FcRn and positive controls WT–FcRn and MutYTE–FcRc. The residue names for ASP, GLU and HIS were manually changed to AS4, GL4 and HIP to allow them to be detected as titratable residues in all the complexes, respectively. The AMBER ff99SB force field25 was used to describe the complex and the charges were neutralized by counter ions. Each system was solvated in a truncated TIP3P octahedron water box extended 10 Å from each direction of the solute. All systems were minimized to relieve atomic close contacts of the protein side chains with the solvent by 2000 steps of steepest descent followed by 2000 steps of conjugate gradient method at a constant volume and restraint being set only on protein backbones to ensure minimal adjustment during minimization. After minimization, the complexes were slowly heated to 300 K within 900 ps using a Langevin thermostat26 and equilibrated without any restraint for 100 ps. The production stage was performed using CpHMD simulation with Monte Carlo (MC) sampling techniques27,28 carried out in the pmemd.cuda module on a Dell Precision Tower 5810 equipped with an NVIDIA GeForce GTX 1060 CUDA GPU system. A total of 300 ns CpHMD simulation was performed on each system at pH 6.0 and 7.5, with a 2 fs time step, as implemented in AMBER18. The constant pH setting was turned on for explicit solvent running under the GBOBC model against a salt concentration of 0.1 M (Debye–Hückel based) as a variable control for the binding free energy calculations. The protonation state changing attempts for the titratable residues were set to 3 ps, while the temperature was maintained at 300 K with the Langevin dynamics algorithm with SHAKE algorithm29 being turned on throughout the simulation. The system was set to retain a constant pressure of 1 atm without imposing any atomic restraints. The particle mesh Ewald (PME) algorithm was used to calculate long range electrostatic interaction and 10 Å as the non-bonded calculation cutoff distance. Representative structures from each system were selected from the clustering of the last 5 ns from all the system trajectories using the kclust binary from MMTSB toolset.30 Protein stability check including the analysis of root mean square deviation (RMSD), root mean square fluctuation (RMSF) by residues and secondary structure analysis was carried out using the cpptraj31 software incorporated in the AMBER18 software suite. The pKa calculation, hydrogen bond and binding free energy analysis were performed by taking the median results from a total of 3000 trajectories at (200 ns, 250 ns and 300 ns) intervals of 5 ps as the representative predicted value. The predicted pKa values for the system titratable residues were obtained from the cpout output file.
Binding free energy calculation and per-residue decomposition
The absolute binding free energies, ΔGbind, for the intermolecular non-covalent interaction of the Fc–FcRn complex was calculated using the molecular mechanics Poisson–Boltzmann and generalized Born surface area (MMPB/GBSA) approaches available in AMBER18 with 1 ns trajectories (1000 snapshots) at 5 ps for each 200 ns, 250 ns and 300 ns, respectively. The ΔGbind for each system was calculated according to (eqn (1)).| | |
ΔGbind = ΔGcomplex − (ΔGreceptor + ΔGligand)
| (1) |
where ΔGcomplex, ΔGreceptor, and ΔGligand are the free energies of the Fc–FcRn complex, FcRn and Fc, respectively. The difference in free energies (ΔG) for the Fc–FcRn complex, FcRn and Fc in (eqn (1)) was calculated as follows:| | |
ΔG = ΔEMM + ΔGsolvation − TΔSconformation
| (2) |
where ΔEMM is the sum of the internal strain energy, also known as the difference in molecular mechanics energy, ΔGsolvation is the solvation free energy, while TΔSconformation is the absolute temperature (in Kelvin), and the vibrational entropy contribution of the complex was calculated using the quasi-harmonic approximation.32 ΔEMM and ΔGsolvation required for ΔG calculation were obtained from:| | |
ΔEMM = ΔEint + ΔEvdW − ΔEele
| (3) |
| | |
ΔEint = ΔEbond + ΔEangle − ΔEtorsion
| (4) |
| | |
ΔGsolvation = ΔGpolar + (γΔSASA − β)
| (5) |
where ΔEMM (eqn (3)) is the sum of the molecular energy contribution by bonded (ΔEint), non-bonded van der Waals (ΔEvdW) and electrostatic forces (ΔEele). ΔEint (eqn (4)) is the molecule internal strain energy calculated from the summation of three energy terms: covalent bonds (ΔEbond), bond angles (ΔEangle) and torsion angles at a single rotation bond (ΔEtorsion). ΔGsolvation was calculated based on the summation of the polar (ΔGpolar) and non-polar (γΔSASA – β) contribution. The polar (ΔGpolar) contribution was solved using the Poisson–Boltzmann (PB) and generalized Born (GB) equation,33 while the non-polar (γΔSASA – β) contribution was calculated from the solvent-accessible surface area (SASA), which was estimated using fast linear combination of pairwise overlap (LCPO) algorithm.34 The Eint is cancelled out for the Gbind calculations as stable energies were obtained from the MD simulations. The binding free energy decomposition was used to analyse the contribution of residues (side chain (ΔTS) or backbone (ΔTB)) to the total binding free energy of all systems. By summing up the energy contribution (eqn (2)), the residues that interact in complex formation can be determined. The polar contribution (ΔEelec+pol) was calculated by summation of two energy terms (ΔEelec) and (ΔEpol), whilst the non-polar contribution (ΔEvdW+np) was calculated by energy terms (ΔEvdW) and (ΔEnp) summation.
Design of human IgG1 Fc
We used the MutYTE structure obtained from CpHMD at pH 6.0 as the initial structure for the new Fc variant design, which aimed to further improve the binding with FcRn only in an acidic environment (pH 6.0). In order to improve the binding affinity of Fc for FcRn only at pH 6.0, the complex structure imposed with single-point mutation was obtained based on clustering analysis based on pH 6.0 crystal structure (MutYTE Fc–FcRn complex) CpHMD simulation system. The Fc interacting residues for FcRn was observed earlier on based on the jsPISA interface analyser,35 consisting of three loop regions (CH2loopAB residues 249-257, CH2loopDE residues 307-315 and CH3loopFG residues 428-440). Every position in these loop regions were submitted for mutation to 19 alternative amino acids (except His at positions 310 and 435, which were found to be involved in pH-dependent binding mechanism) using the Single Amino Acid Mutation related change of Binding Energy (SAAMBE) web server.36 The SAAMBE prediction server allows the identification changes in binding free energy upon mutation, where (ΔΔG becomes negative) indicates an improvement in the binding free energy of the complex upon that particular single amino acid mutation. The final combination of single amino acid substitutions into a single Fc was remodelled using MODELLERv9.21(23). The new Fc design (denoted as MutM4 since it consists of four-mutation points) was then studied using CpHMD simulation. A similar CpHMD system setup was reapplied for the MutM4–FcRn complex at pH 6.0 and pH 7.5. The results were then compared with that of the earlier mentioned 3 systems (WT–FcRn, MutYTE–FcRc and MutAAA–FcRn).
Results
CphMD simulations
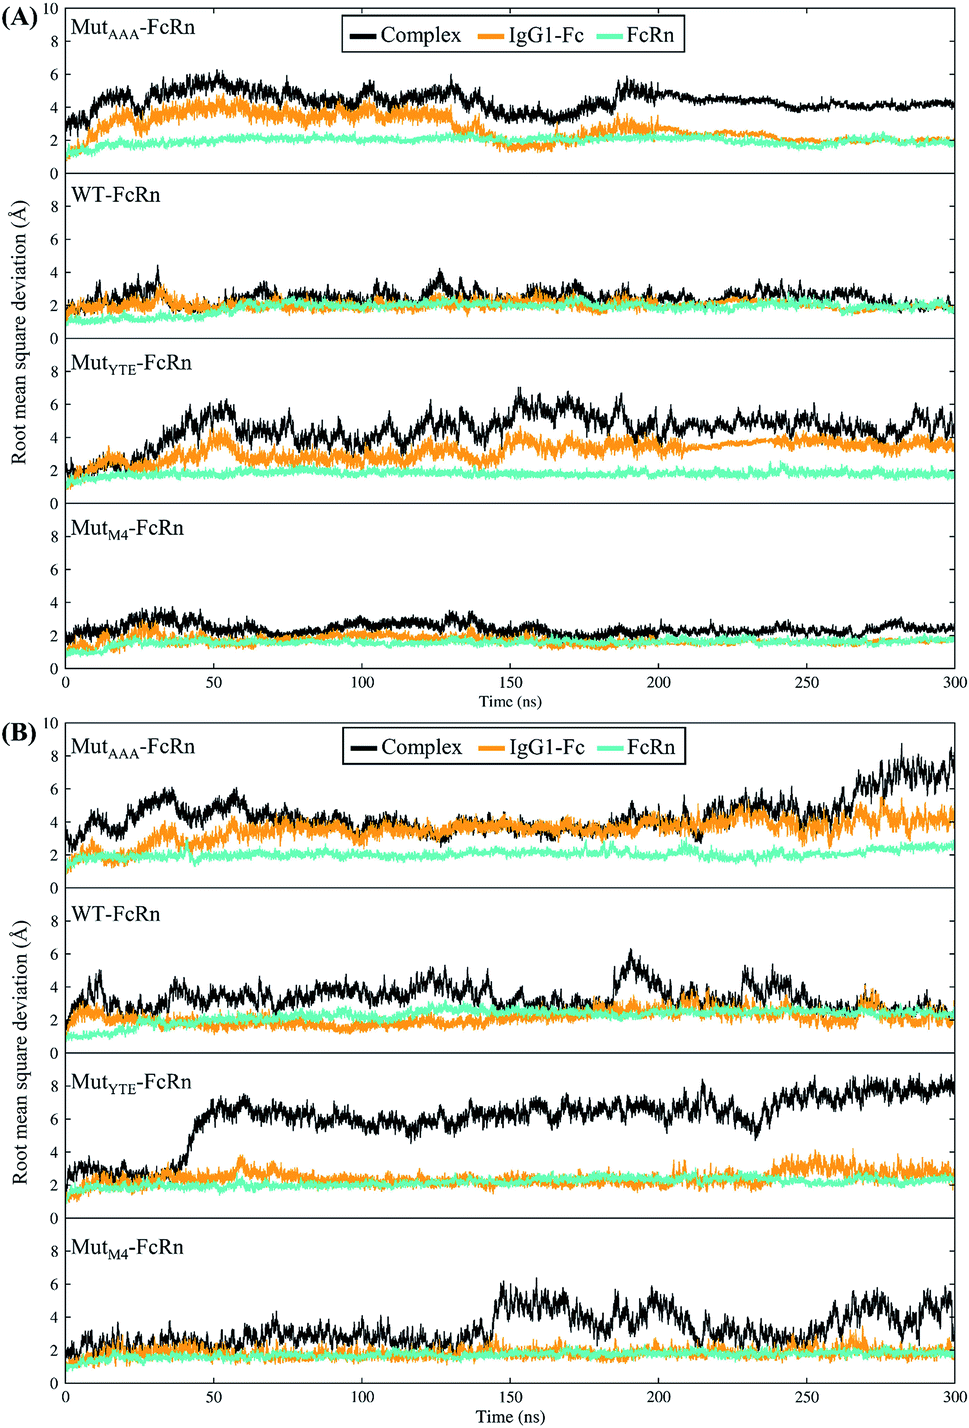
In this study, in silico prediction utilizing CpHMD was done as an experimental guide to capture the Fc–FcRn complex physico-chemical binding property at pH 6.0 and 7.5. The engineering of the IgG Fc region with increased binding affinity for FcRn at pH 6.0 but not pH 7.5 aimed to promote the prolonged therapeutic drug half-life of mAbs or chemical-conjugated Fc drugs based on the biological advantages of IgG1 such as the prolonged serum half-life in humans. This can be viewed as a step to improvise the pharmaco-kinetic properties of Fc-based drug design. Currently, certain therapeutic drugs may be confined by limitations such as complex instability and rapid clearance. Thus, utilizing the Fc–FcRn binding mechanism in Fc-fused drug constructions, in theory may allow its biological advantages to be inherited. Accordingly, by prolonging the drug serum half-life will increase the drug bioavailability, which may benefit patients. Meanwhile, the design of new Fc for FcRn without compromising the pH-dependent binding mechanism remains a challenge in Fc engineering procedures. Thereby, this study modelled a new Fc mutant (MutM4) by mutating the Fc residues found interacting with FcRn to 19 alternative amino acids using the SAMMBE prediction server. The resulting MutM4 (Asp249Ala, Thr254Phe, Pro257Trp and Asp312Gly) was designed, which showed that Asp249Ala, Thr254Phe, Pro257Trp and Asp312Gly show improve binding affinity (ΔΔGMut) for FcRn (ESI, Fig. S1†). The Fc–FcRn interacting residues are located at the Fc (CH2-loopAB: 244-257; CH2-loopDE: 308-318; and CH3-loopFG: 429-435) and FcRn heavy chain (loopα′1-β′C: 82-89; loopβ′DE: 112-115; and loopβ′G-α′2: 129-133) (ESI Fig. S2†). The designed MutM4–FcRn complex was subjected to simulation, resulting in a total of four Fc mutations complexed with FcRn (Table 1). RMSD analysis showed that while approaching 300 ns, the Fc–FcRn complex backbone carries a trajectory convergence with a lower RMSD (max of ∼5 Å and min of ∼2 Å) at pH 6.0 compared to that at pH 7.5 (max of ∼8 Å and min of ∼2 Å) (Fig. 1). In each system, the structure falling in the major cluster with the closest centroid mass RMSD from the last 5 ns trajectories was selected as the representative structure of the system. The selected structures were used for comparison with the available crystal structure (PDB_ID: 4NOU), showing that the complexes at pH 6.0 are more similar to the crystal structure (ESI Fig. S3†). The extracted trajectories from all systems were compared among each other and showed higher quaternary conformational changes at pH 7.5 (Fig. 2). Noticeably, FcRn showed a positional shift in MutYTE–FcRn and MutM4–FcRn in the two different pH environments compare with WT–FcRN and MutAAA–FcRn. The final recorded RMSD difference between the representative structures was 3.7 Å, 1.6 Å, 6.0 Å, and 4.6 Å for MutAAA–FcRn, WT–FcRn, MutYTE–FcRn and MutM4–FcRn, respectively, with no major secondary structure changes observed in the individual Fc and FcRn at either pH 6.0 or pH 7.5 for all systems (ESI, Fig. S4†).
Table 1 Interacting residues of IgG1-Fc region for FcRn. The underlines denote the mutant residues
| Fc variant |
CH2(loopAB) |
CH2(loopDE) |
CH3(loopFG) |
| Residue number |
249-257 |
307-315 |
428-440 |
| AAA-mutant (MutAAA) |
DTLM![[A with combining low line]](https://www.rsc.org/images/entities/char_0041_0332.gif) SRTP SRTP |
TVLQDWLN |
MHEALHNYTQKS |
| Wildtype (WT) |
DTLMISRTP |
TVLHQDWLN |
MHEALHNHYTQKS |
| YTE-mutant (MutYTE) |
DTL![[Y with combining low line]](https://www.rsc.org/images/entities/char_0059_0332.gif) I I![[T with combining low line]](https://www.rsc.org/images/entities/char_0054_0332.gif) R R![[E with combining low line]](https://www.rsc.org/images/entities/char_0045_0332.gif) P P |
TVLHQDWLN |
MHEALHNHYTQKS |
| M4-mutant (MutM4) |
TLYI![[F with combining low line]](https://www.rsc.org/images/entities/char_0046_0332.gif) RE RE![[W with combining low line]](https://www.rsc.org/images/entities/char_0057_0332.gif) |
TVLHQ![[G with combining low line]](https://www.rsc.org/images/entities/char_0047_0332.gif) WLN WLN |
MHEALHNHYTQKS |
 |
| | Fig. 1 Root mean square deviation of the backbone atoms (RMSDCα,N,C,O) with the function of time at (A) pH 6.0 and (B) pH 7.5 for Fc MutAAA, WT, MutYTE and MutM4, respectively, in the complex with FcRn. | |
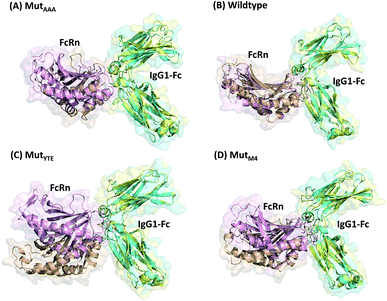 |
| | Fig. 2 Superimposition of (A) MutAAA–FcRn, (B) WT–FcRn, (C) MutYTE–FcRn, and (D) MutM4–FcRn complexes at pH 6.0 (Fc: cyan and FcRn: pink ribbon presentation) and pH 7.5 (Fc: yellow & FcRn: orange ribbon presentation). Figure was prepared using Pymol.37 | |
Fc domain interface mutation induced shifts in Fc–FcRn complex binding affinity
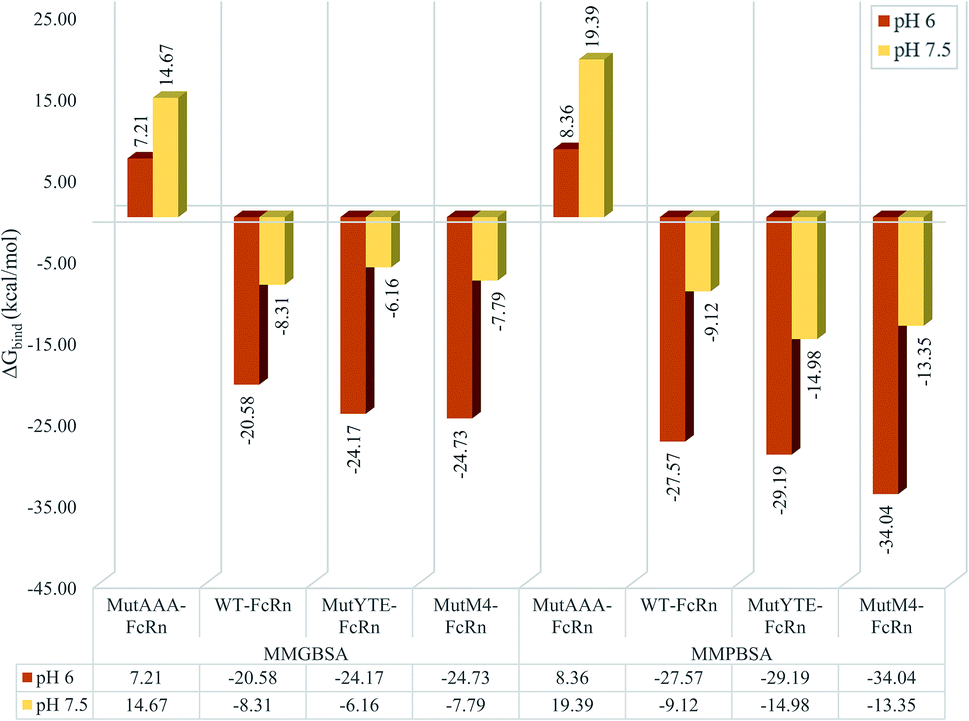
MMPB/GBSA approach binding free energy calculation taking the average binding free energy from 200 ns, 250 ns and 300 ns with each 1000 trajectories at 5 ps intervals was carried out (resulting in 200 trajectories in each nanosecond, and a total of 600 trajectories to be used in the calculation). Fig. 3 presents the average binding energy contributions of all the complexes. Compared to the Fc variants at pH 6 (red bars), ΔGbind showed an increase for all the Fc variants against FcRn at pH 7.5 (yellow bars), indicating the loss in binding affinity for the Fc–FcRn complexes at higher pH. MMGBSA predicted the difference in binding affinity (ΔΔGbind) between MutYTE and WT to be −3.58 kcal mol−1 and +2.14 kcal mol−1 at pH 6.0 and pH 7.5, while the difference in ΔΔGbind between MutM4 and WT to be −4.15 kcal mol−1 and +0.52 kcal mol−1 at pH 6.0 and pH 7.5, respectively, indicating the improved binding of MutM4 over MutYTE for FcRn at pH 6.0 (ΔΔGbind of −0.56 kcal mol−1) with dissociating potential. Similarly, the MMPBSA calculation predicted the difference in ΔΔGbind between MutYTE and WT to be −1.61 kcal mol−1 and −5.87 kcal mol−1 at pH 6.0 and pH 7.5, respectively, while the difference in ΔΔGbind between MutM4 and WT to be −6.46 kcal mol−1 and −4.23 kcal mol−1 at pH 6.0 and pH 7.5, respectively, indicating an improved binding of MutM4 over MutYTE for FcRn at pH 6.0 (ΔΔGbind of −4.85 kcal mol−1).
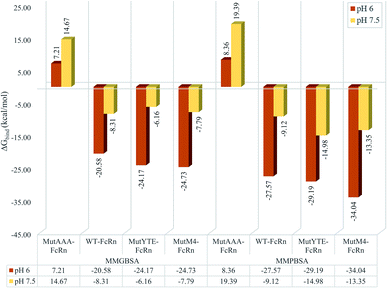 |
| | Fig. 3 Bar chart demonstrating the Fc–FcRn complex average binding free energy (ΔGbind) calculated using MMGBSA (left four columns) and MMPBSA (right four columns) for MutAAA–FcRn, WT–FcRn, MutYTE–FcRn, and MutM4–FcRn complexes at pH 6.0 (red) and pH 7.5 (yellow). | |
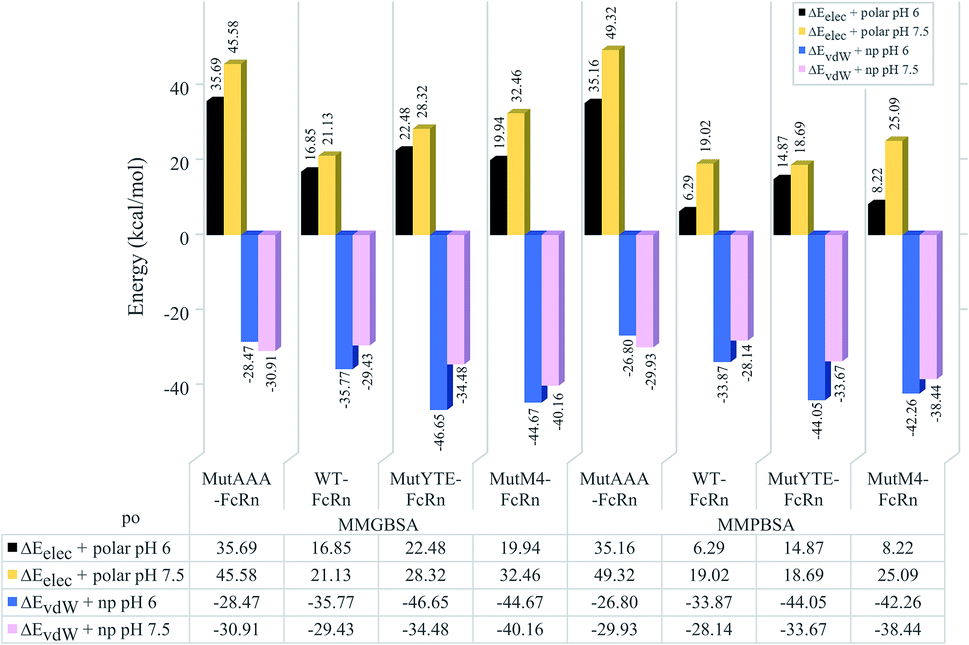
The non-polar interaction was analyzed based on the summation of the van der Waals and non-polar contribution (ΔEvdW+np), while electrostatic interaction and hydrogen bonding was analyzed based on the summation of the electrostatic and polar contribution (ΔEelec+polar). Regardless of the pH value, all the complexes were shown to be stabilized with non-polar interactions (ΔEvdW+np) in the sequence of binding affinity ranked from high to low as follows: MutYTE > MutM4 > WT > MutAAA at pH 6.0 and MutM4 > MutYTE > WT > MutAAA at pH 7.5 (Fig. 4 blue (pH 6) and pink (pH 7.5) bars). The pair-wise decomposition energies involved in complex formation are listed in ESI, Table S1† (MMGBSA) and Table S2† (MMPBSA). In addition to the interacting residues listed based on the MMPB/GBSA calculation, representing structures were analyzed for close contacts in the Fc–FcRn complexes (ESI, Table S3†).
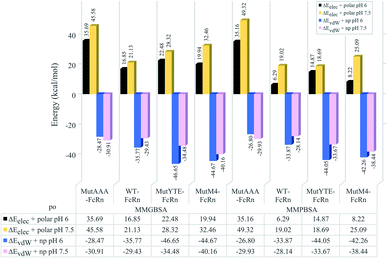 |
| | Fig. 4 Bar chart demonstrating the hydrophilic (ΔEelec+polar) and hydrophobic interaction (ΔEvdW+np) calculated using MMGBSA (left four columns) and MMPBSA (right four columns) for the MutAAA–FcRn, WT–FcRn, MutYTE–FcRn, and MutM4–FcRn complexes at pH 6.0 (black and blue bars) and pH 7.5 (blue and pink bars). | |
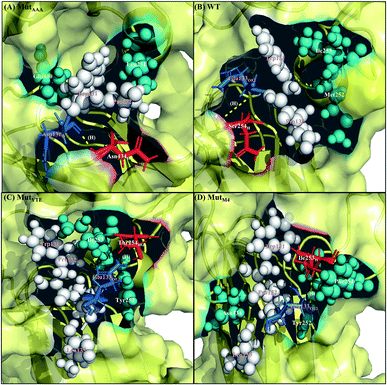
Along with aforementioned interaction analysis, hydrogen bond frequency was examined from the trajectories used in the ΔΔGbind calculations. Table 2 provides information on the hydrogen bonding that occurred > 50% of the extracted simulation time between Fc and FcRn at pH 6.0 and pH 7.5, which identified that the higher binding affinity of MutYTE–FcRn over WT at pH 6.0 is probably due to the stronger hydrogen bonds (higher percentage of occupancies) involved in complex formation. Besides, the decomposition ΔΔGbind also revealed sizeable interactions between the spatially adjacent residues in the complex related to stronger electrostatic interactions and hydrogen bonding at pH 6.0. If the Fc–FcRn complexes were to be drawn closer, an increase in core hydrophobic interactions is likely to occur. In contrast, most of the electrostatic interactions were unstable and did not achieve 50% occupancy of the extracted trajectories. It was observed that His310 (Fc) lost its hydrogen bond interaction with Glu115 (FcRn) at pH 7.5. With the chemical property of His to naturally performs protonation state fluctuations around pH 6.6, it was predicted that a basic pH will cause the His residue to be deprotonated and end up with a net neutral charge. Overall, this will reduce the electrostatic interaction between Fc and FcRn by hydrogen bond deformation, and hence, can be used to explain the release of IgG1 Fc from FcRn at pH 7.5. Despite the loss of the Fc:FcRn (His310:Glu115) hydrogen bond interaction, Fc:FcRn (Ser254:Glu133) contact remained at both pH 6 and 7.5. This can explain why there is still a binding affinity for WT–, MutYTE– and MutM4–Fc with FcRn at pH 7.5 and can possibly cause the slow release of Fc from the complex at higher pH. The Fc–FcRn interaction figures were depicted. The interacting residues were pooled from pairwise decomposition energy, structure and hydrogen bond analysis. The observed interactions in each system at both pH are depicted in Fig. 5 and6, respectively. Generally, the results show a reduction in the number of favorable interacting residues at pH 7.5.
Table 2 Hydrogen bonds formed between Fc and FcRn at pH 6.0 and pH 7.5. Only hydrogen bonds occurring >50% are reported. Bold residues are the titratable residues
| |
pH 6.0 |
pH 7.5 |
| IgG1-Fc |
FcRn |
Occupancies (%) |
Average distance (Å) |
Average angle (°) |
IgG1-Fc |
FcRn |
Occupancies (%) |
Average distance (Å) |
Average angle (°) |
| MutAAA |
Ser254HG |
Glu133OE1 |
96.5 |
2.7 |
165.0 |
Asn434H |
Asp130O |
72.4 |
2.8 |
155.1 |
| Gln311H |
Glu115OE1 |
64.8 |
2.9 |
161.2 |
— |
— |
— |
— |
— |
| WT |
Ser254HG |
Glu133OE2 |
99.0 |
2.7 |
165.6 |
Ser254H |
Glu133OE2 |
65.7 |
2.9 |
159.7 |
| His310HD1 |
Glu115OE2 |
80.7 |
2.8 |
159.2 |
— |
— |
— |
— |
— |
| Leu253O |
Asn113HD22 |
65.2 |
2.9 |
160.0 |
— |
— |
— |
— |
— |
| MutYTE |
Thr254OG1 |
Glu133HE11 |
95.0 |
2.7 |
165.9 |
— |
— |
— |
— |
— |
| His310ND1 |
Glu115HE12 |
88.3 |
2.8 |
162.6 |
Thr254HG1 |
Glu133OE2 |
61.3 |
2.7 |
165.8 |
| His435HD1 |
Asp130O |
83.9 |
2.8 |
158.9 |
— |
— |
— |
— |
— |
| MutM4 |
His310HD1 |
Glu115OE1 |
92.9 |
2.8 |
154.1 |
Phe254H |
Glu133OE2 |
59.5 |
2.9 |
155.8 |
| Gln311HE22 |
Glu116O |
85.0 |
2.8 |
162.0 |
— |
— |
— |
— |
— |
| Ile253H |
Glu133OE1 |
55.9 |
2.9 |
158.0 |
— |
— |
— |
— |
— |
| Phe254H |
Glu133OE2 |
54.9 |
2.9 |
161.7 |
— |
— |
— |
— |
— |
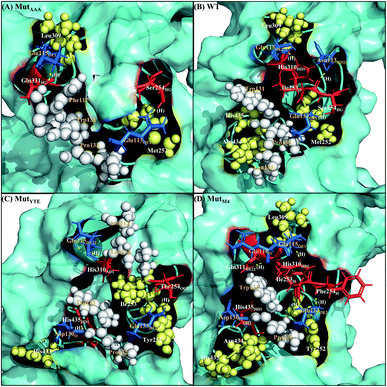 |
| | Fig. 5 Interaction interfaces of (A) MutAAA, (B) WT, (C) MutYTE, and (D) MutM4 with FcRn at pH 6.0. IgG1-Fc residues involved in electrostatic interaction are displayed as red sticks, while the FcRn residues involved in electrostatic interactions are displayed as blue sticks. IgG1-Fc residues involved in hydrophobic interactions are displayed as yellow spheres, while FcRn residues involved in hydrophobic interactions are displayed as white spheres. Yellow dots labelled with (H) are the hydrogen bonds between Fc and FcRn. Figure was prepared using Pymol.37 | |
 |
| | Fig. 6 Interaction interface of (A) MutAAA, (B) WT, (C) MutYTE, and (D) MutM4 with FcRn at pH 7.5. IgG1-Fc residues involved in electrostatic interactions are displayed as red sticks, while FcRn residues involved in electrostatic interactions are displayed as blue sticks. IgG1-Fc residues involved in hydrophobic interactions are displayed as teal spheres, while FcRn residues involved in hydrophobic interactions are displayed as white spheres. Yellow dots labelled with (H) are the hydrogen bonds between Fc and FcRn. Figure was prepared using Pymol.37 | |
Protonation states of titratable residues
Overall, there are ∼100 titratable residues for the four complexes (∼52 acidic and ∼48 basic titratable residues). Table 3 lists the predicted pKa values predicted by cpstats (AMBER18) for the acidic titratable residues resides on the Fc–FcRn complex interface. The theoretical pKa values were calculated using Delphi pKa prediction38 by submitting a single trajectory complex structure utilizing the AMBER force field. Delphi pKa prediction was performed on the crystal structures and representative structures from all the simulation systems. However, only the cpstats pKa prediction results for interacting titratable residues of all simulation systems are presented since they show observable pKa shifts. The pKa value deviated from the reference value (predicted by Delphi) under the circumstances of interaction with neighboring residues. For instance, considering that His310 (reference pKa: 6.6) showed lower predicted pKa values, the residue needs a lower pH environment to be protonated. This can be related to the electronegative atoms of the residue, which is constantly involved in hydrogen bonding with its neighboring residues. This leads to difficulty in accepting additional protons, hence decreasing the predicted pKa value. The pKa prediction from the Delphi program showed similar results for all the submitted structures as the program rebuilt the environment for solute pKa prediction and is insufficient to provide an observable correlation between the quaternary complex changes and difference in the respective pKa values (data not presented). Albeit, the following point can be deduced from the pKa results of both the Delphi and cphstats pKa prediction. The aforementioned His310, which is important in Fc–FcRn complex formation, can have a trapped hydrogen atom that hovers between His310 (Fc) and Glu115 (FcRn). Under the influence of mutations in the neighbor loop (CH2loopAB), an extreme protonation state can be seen between Fc:FcRn (His310:Glu115) at pH 6, indicating there is a stronger hydrogen bond between both residues. This result agrees with the hydrogen bond analysis. Referring to the protonation fraction of both residues, FcRn (Glu115) acts as a hydrogen donor in the MutYTE–FcRn complex while a hydrogen acceptor in the MutM4–FcRn complex. In contrast, WT–Fc, which binds with lower affinity compared to MutYTE and MutM4, shows an equal distribution of protonation fractions between both residues at pH 6. Meanwhile, MutAAA with the absence of Fc His310 causes FcRn Glu115 to take up the solvent hydrogen, leading to an increase in its pKa value at pH 6. The property of Fc His310 seems essential for Fc–FcRn formation. This was observed in the WT–FcRn complex at pH 6, where the Fc His 310 pKa value is close to its reference pKa value, while the high pKa in Glu115 (FcRn) (pKa: 5.9) indicates less stable hydrogen bond formation. A similar pKa value was found at pH 7.5 for WT, MutYTE and MutM4–FcRn, which shows the loss in this interaction is sufficient to cause complex dissociation at higher pH. Overall, the pKa values agree with the calculated hydrogen bond occupancies.
Table 3 The average pKa value from 200 ns, 250 ns and 300 ns of Fc–FcRn complex titratable interacting residuesa
| |
|
|
Predicted pKa |
Protonation fraction |
| pH 6.0 |
pH 7.5 |
pH 6.0 |
pH 7.5 |
| Crystal |
MutAAA |
WT |
MutYTE |
MutM4 |
MutAAA |
WT |
MutYTE |
MutM4 |
MutAAA |
WT |
MutYTE |
MutM4 |
MutAAA |
WT |
MutYTE |
MutM4 |
| Crystal structure: (PDB ID: 4N0U). |
| Fc |
His310 |
7.99 |
Null |
6.12 |
3.99 |
−∞ |
Null |
6.96 |
5.99 |
6.53 |
Null |
42.5 |
2.9 |
67.3 |
Null |
49.2 |
40.8 |
22.9 |
| His433 |
6.98 |
5.91 |
5.85 |
6.85 |
5.80 |
6.86 |
5.78 |
4.18 |
5.95 |
45.8 |
41.8 |
86.0 |
39.0 |
19.6 |
7.2 |
0.2 |
3.5 |
| His435 |
6.61 |
Null |
7.79 |
4.81 |
8.83 |
Null |
8.51 |
9.05 |
9.17 |
Null |
98.2 |
100.0 |
99.8 |
Null |
95.3 |
97.2 |
97.7 |
| FcRn |
Glu115 |
2.41 |
7.85 |
5.90 |
6.48 |
3.70 |
6.66 |
6.97 |
5.80 |
6.18 |
97.7 |
64.4 |
70.0 |
0.4 |
26.7 |
47.8 |
2.0 |
8.5 |
| Glu116 |
3.23 |
5.24 |
4.67 |
4.24 |
4.30 |
5.42 |
5.06 |
4.34 |
4.75 |
15.3 |
7.0 |
2.8 |
2.0 |
6.8 |
8.0 |
0.2 |
0.2 |
| Asp130 |
3.15 |
5.69 |
4.73 |
4.21 |
3.89 |
5.35 |
5.50 |
5.34 |
5.02 |
35.3 |
6.7 |
1.7 |
0.8 |
11.2 |
10.3 |
0.7 |
0.3 |
| Glu133 |
2.45 |
1.60 |
−∞ |
5.23 |
2.48 |
6.61 |
4.76 |
4.10 |
3.40 |
33.3 |
0.0 |
43.3 |
0.0 |
20.5 |
7.6 |
0.0 |
0.0 |
Discussion
This study applied CpHMD, which allowed the study of the Fc and FcRn pH-dependent binding mechanism. Since the major pH-dependent interacting surface was found in the reside between the FcRn heavy chain and the Fc region, the use of CpHMD simulation was expected to capture the complex quaternary configuration changes at different pH, namely pH 6.0 and pH 7.5. The simulation study showed that the performance of monomeric Fc with FcRn does not lose the pH-dependent binding mechanism, where monomeric Fc was employed for all the simulation systems.39–43 All the systems showed some degree of conformation rearrangement, with a greater extent observed at pH 7.5 (Fig. 1 and ESI Fig. S2†). However, the lower RMSD at pH 6.0 can possibly be due to the closer pH environment when the crystal structure is obtained (pH 5.2). All the complexes (WT–FcRn, MutAAA–FcRn, MutYTE–FcRn and MutM4–FcRn) showed higher stability at pH 6.0 with an average RMSD of 1.0 Å, 0.4 Å 3.2 Å and 2.3 Å, respectively. The low RMSD values of MutAAA–FcRn for both pH was expected since this Fc variant has been proven to lose its binding capability for FcRn at both pH 6.0 and pH 7.5 (Kim et al., 1994).44 Hence, it was expected that the MutAAA binding with FcRn at pH 6.0 and 7.5 should show less significant quaternary structural deviation. The analysis of the RMSD demonstrated that MutYTE and MutM4 variant complexes at pH 7.5 exhibited a higher RMSD value. Further analysis from the superimposition of the complex structures at pH 6.0 and 7.5 revealed that not all the quaternary complexes showed obvious detachment of FcRn from the IgG1-Fc interface (FcRn moving downwards from the Fc region was only observed in MutYTE and MutM4) (Fig. 2). Analysis of the distance between Fc Thr307 and Val427 with FcRn Thr89 showed that only MutYTE and MutM4 have a greater distance from FcRn at pH 7.5 (ESI, Fig. S5†). For instance, an increased in the distance between FcRn Thr89 and Fc Thr307 from ∼18 Å to ∼24 Å was observed in these two mutants (MutYTE and MutM4) at pH 7.5, while the others (WT and MutAAA) maintained a similar distance with FcRn (ESI, Fig. S6†). Both the backbone and distance RMSD information led to the conjecture of the importance of the Fc residues at positions 252, 254 and 256 as the mutations resulted in observable posture changes in the Fc–FcRn complex at pH 6.0 and pH 7.5. Since the structural superimposition did not show the total detachment of Fc–FcRn, the Fc–FcRn binding affinity at pH 6.0 and pH 7.5 was further calculated by applying physical principles to explain their molecular interactions. The predicted binding energies are consistent with the reported experimental data,11,17,45 with the binding affinity following the order of MutYTE > WT > MutAAA (Fig. 3). Despite the absence of the FcRn light chain (β2-microglobulin), MutYTE, which was reported to show an increased IgG serum half-life and binding affinity at pH 6.0 compared to WT,8,46 and thus our calculated total binding energy is agreement with the binding trend of the reported results.
In nature, changes in the His protonation states occur at around pH 6.6, which is within the range of this study. The pKa prediction results (Table 3) showed that three His residues are supposed to be protonated at pH 6.0 with the side chain being positively charged whilst deprotonation should occur at pH 7.5, which carries a neutral net charge. Compared to the crystal structure, the CpHMD simulation systems show lower predicted pKa values for Fc His310 and His433 at both pH 6.0 and pH 7.5 (Table 3). His433 showed hydrophobic interaction with FcRn Asp130 in some variants (MutAAA and MutM4). The positively charged Fc His433 and His435 with the negatively charged FcRn Asp130 and Glu133 also contributed to Fc–FcRn complex formation at pH 6.0. Supposedly, at pH 7.5, Fc His433 and His435 are neutral, while FcRn Asp130 and Glu133 remain negatively charged, thus leading to the loss of binding interactions with Fc. However, only His433 showed deprotonation at pH 7.5, while His435 remained highly protonated, suggesting this is the cause of the favorable binding free energy calculated at pH 7.5. His433 showed lower pKa values, while His435 showed a higher pKa value, which is caused by the competition between neighboring residues. The His residue in solution carries a pKa of around 6.6, but the value can vary widely from 3 to 9 depending on its burial position or polar and ionic interaction with the neighboring residues.47 Accordingly, an inconsistent pKa value calculation can occur in the presence of close interactions with neighboring residues, as described in the literature.48,49 Both residues can be competing for protonation with the favorable protonation position in His435, as evidenced by the high protonation fraction of His435, whilst His433 showed a drastic decrease in protonation fraction at pH 7.5 for the all variants. Another inconsistent pKa value was observed for IgG1-Fc His310, which was found to have consistent involvement in electrostatic interactions or hydrogen bonding with FcRn Glu115, in agreement with a report stating the importance of the His310 in complex formation with FcRn.8 The per residue decomposition of binding free energies (ESI, Table S1†) and hydrogen bond analysis (Table 2) predicted the consistent presence of Fc–FcRn interactions as Fc:FcRn: (His310:Glu115; Ser/Thr254:Glu133), indicating the importance of these four residues in Fc–FcRn complex formation.
The design of the new Fc mutant was aimed to further improve MutYTE without interfering with the important pH-dependent residues, e.g. His310, at pH 6.0, but able to dissociate at pH 7.5. The MutM4 design showed higher binding affinity with FcRn at pH 6.0 in both MMPB/GBSA calculation with the average binding free energy (ΔGbind_PB = −34.04 ± 0.66 kcal mol−1; ΔGbind_GB = −24.73 ± 0.46 kcal mol−1) compared with MutYTE (ΔGbind_PB = −29.19 ± 0.97 kcal mol−1; ΔGbind_GB = −24.17 ± 0.79 kcal mol−1) and the reduced binding affinity at pH 7.5 (ΔGbind_PB = −13.35 ± 0.62 kcal mol−1; ΔGbind_GB = −7.79 ± 0.46 kcal mol−1), which is close to MutYTE (ΔGbind_PB = −14.98 ± 0.72 kcal mol−1; ΔGbind_GB = −6.16 ± 0.66 kcal mol−1) at pH 7.5. The improved binding affinity of MutM4 compared with MutYTE at pH 6.0 (ΔGbind_PB = −4.85; ΔGbind_GB = −0.56 kcal mol−1) can be attributed to the reduction in the negative repulsion (Asp249Ala and Asp312Gly) and improvement in the non-polar interaction (Ser254Phe and Pro257Trp) with FcRn. Meanwhile, the efficient dissociation of MutM4 from FcRn at pH 7.5 is attributed to the same repulsive mechanism between Fc His433 and His435 with FcRn Asp130 and Glu133, as mentioned earlier.
Conclusions
The pH-dependent binding mechanism of IgG–FcRn allows prolonged IgG serum half-lives of up to ∼21 days by efficient binding with the neonatal Fc receptor at acidic pH (pH 6.0) and dissociation at physiological pH (pH 7.5). Without the successful dissociation of IgG from the receptor at physiological pH, the rate of biomolecule catabolism will be increased. The application of the constant pH MD simulation method allowed the changes in the protonation states of the Fc–FcRn titratable residues at the interacting interface to be identified. We then applied the available structural knowledge to design an in silico Fc variant, namely MutM4, which can associate and dissociate at the respective pH. This application can be a useful step to optimize the pharmacokinetics of therapeutic molecules, and thus provide more designs for therapeutic molecules for future validation.
Funding
This work is supported by FRGS (203/CIPPM/6711680) from the Malaysia Ministry of Education.
Conflicts of interest
There are no conflicts to be declared.
Acknowledgements
The first author would like to thank Universiti Sains Malaysia for its support through USM fellowship.
References
- G. L. Kumar, FDA-Approved Targeted Therapies in Oncology, Predictive Biomarkers in Oncology, 2019, pp. 605–622 Search PubMed.
- E. Lobner, M. W. Traxlmayr, C. Obinger and C. Hasenhindl, Engineered IgG1-Fc – one fragment to bind them all, Immunol. Rev., 2016, 270(1), 113–131 CrossRef PubMed.
- M. D. Hulett and P. M. Hogarth, Molecular basis of Fc receptor function, Advances in Immunology, Elsevier, 1994, vol. 57, pp. 1–127 Search PubMed.
- F. Nimmerjahn and J. V. Ravetch, Fcγ receptors as regulators of immune responses, Nat. Rev. Immunol., 2008, 8(1), 34–47 CrossRef PubMed.
- D. C. Roopenian and S. Akilesh, FcRn: the neonatal Fc receptor comes of age, Nat. Rev. Immunol., 2007, 7(9), 715 CrossRef PubMed.
- C. Chaudhury, S. Mehnaz, J. M. Robinson, W. L. Hayton, D. K. Pearl and D. C. Roopenian, et al., The major histocompatibility complex–related Fc receptor for IgG (FcRn) binds albumin and prolongs its lifespan, J. Exp. Med., 2003, 197(3), 315–322 CrossRef PubMed.
- V. Ghetie and E. S. Ward, Multiple roles for the major histocompatibility complex class I–related receptor FcRn, Annu. Rev. Immunol., 2000, 18(1), 739–766 CrossRef PubMed.
- V. Oganesyan, M. M. Damschroder, K. E. Cook, Q. Li, C. Gao and H. Wu, et al., Structural insights into neonatal Fc receptor-based recycling mechanisms, J. Biol. Chem., 2014, 289(11), 7812–7824 CrossRef CAS PubMed.
- M. Raghavan, V. R. Bonagura, S. L. Morrison and P. J. Bjorkman, Analysis of the pH dependence of the neonatal Fc receptor/immunoglobulin G interaction using antibody and receptor variants, Biochemistry, 1995, 34(45), 14649–14657 CrossRef CAS PubMed.
- W. P. Burmeister, A. H. Huber and P. J. Bjorkman, Crystal structure of the complex of rat neonatal Fc receptor with Fc, Nature, 1994, 372(6504), 379 CrossRef CAS PubMed.
- W. L. Martin, A. P. West Jr, L. Gan and P. J. Bjorkman, Crystal structure at 2.8 Å of an FcRn/heterodimeric Fc complex: mechanism of pH-dependent binding, Mol. Cell, 2001, 7(4), 867–877 CrossRef CAS.
- L. G. Presta, R. L. Shields, A. K. Namenuk, K. Hong and Y. G. Meng, Engineering therapeutic antibodies for improved function, Biochem. Soc. Trans., 2002, 30(4), 487–490 CrossRef CAS.
- X. Wang, M. Mathieu and R. J. Brezski, IgG Fc engineering to modulate antibody effector functions, Protein Cell, 2018, 9(1), 63–73 CrossRef CAS.
- W. F. Dall'Acqua, P. A. Kiener and H. Wu, Properties of human IgG1s engineered for enhanced binding to the neonatal Fc receptor (FcRn), J. Biol. Chem., 2006, 281(33), 23514–23524 CrossRef.
- A. Saxena, B. Bai, S. C. Hou, L. Jiang, T. Ying and S. Miersch, et al., Fc engineering: Tailored synthetic human IgG1-Fc repertoire for high-affinity interaction with FcRn at pH 6.0, Methods Mol. Biol., 2018, 1827, 399–417 CrossRef.
- A. Saxena and D. Wu, Advances in therapeutic Fc engineering - modulation of IgG-associated effector functions and serum half-life, Front. Immunol., 2016, 7, 580 CrossRef.
- M. J. Borrok, Y. Wu, N. Beyaz, X. Q. Yu, V. Oganesyan and W. F. Dall'Acqua, et al., pH-dependent binding engineering reveals an FcRn affinity threshold that governs IgG recycling, J. Biol. Chem., 2015, 290(7), 4282–4290 CrossRef.
- A. Grevys, M. Bern, S. Foss, D. B. Bratlie, A. Moen and K. S. Gunnarsen, et al., Fc engineering of human IgG1 for altered binding to the neonatal Fc receptor affects Fc effector functions, J. Immunol., 2015, 194(11), 5497–5508 CrossRef.
- M. H. G. Fonseca, G. P. Furtado, M. R. L. Bezerra, L. Q. Pontes and C. F. C. Fernandes, Boosting
half-life and effector functions of therapeutic antibodies by Fc-engineering: An interaction-function review, Int. J. Biol. Macromol., 2018, 119, 306–311 CrossRef.
- J. K. Kim, M. Firan, C. G. Radu, C. H. Kim, V. Ghetie and E. S. Ward, Mapping the site on human IgG for binding of the MHC class I-related receptor, FcRn, Eur. J. Immunol., 1999, 29(9), 2819–2825 CrossRef.
- C. Medesan, D. Matesoi, C. Radu, V. Ghetie and E. S. Ward, Delineation of the amino acid residues involved in transcytosis and catabolism of mouse IgG1, J. Immunol., 1997, 158(5), 2211–2217 CAS.
- S. Popov, J. G. Hubbard, J. Kim, B. Ober, V. Ghetie and E. S. Ward, The stoichiometry and affinity of the interaction of murine Fc fragments with the MHC class I-related receptor, FcRn, Mol. Immunol., 1996, 33(6), 521–530 CrossRef CAS.
- A. Šali and T. L. Blundell, Comparative protein modelling by satisfaction of spatial restraints, J. Mol. Biol., 1993, 234(3), 779–815 CrossRef PubMed.
- D. A. Case, I. Y. Ben-Shalom, S. R. Brozell, D. S. Cerutti, T. E. Cheatham III, V. W. D. Cruzeiro, et al., AMBER 2018, University of California, San Francisco, 2018 Search PubMed.
- V. Hornak, R. Abel, A. Okur, B. Strockbine, A. Roitberg and C. Simmerling, Comparison of multiple Amber force fields and development of improved protein backbone parameters, Proteins: Struct., Funct., Bioinf., 2006, 65(3), 712–725 CrossRef CAS.
- J. A. Izaguirre, D. P. Catarello, J. M. Wozniak and R. D. Skeel, Langevin stabilization of molecular dynamics, J. Chem. Phys., 2001, 114(5), 2090–2098 CrossRef CAS.
- Y. Meng and A. E. Roitberg, Constant pH replica exchange molecular dynamics in biomolecules using a discrete protonation model, J. Chem. Theory Comput., 2010, 6(4), 1401–1412 CrossRef CAS.
- S. L. Williams, C. A. F. De Oliveira and J. A. McCammon, Coupling constant pH molecular dynamics with accelerated molecular dynamics, J. Chem. Theory Comput., 2010, 6(2), 560–568 CrossRef CAS.
- J. P. Ryckaert, G. Ciccotti and H. J. Berendsen, Numerical integration of the cartesian equations of motion of a system with constraints: molecular dynamics of n-alkanes, J. Comput. Phys., 1977, 23(3), 327–341 CrossRef CAS.
- M. Feig, J. Karanicolas and C. L. Brooks III, MMTSB tool set. MMTSB NIH Research Resource, The Scripps Research Institute, La Jolla, CA, 2001 Search PubMed.
- D. R. Roe and T. E. Cheatham III, PTRAJ and CPPTRAJ: software for processing and analysis of molecular dynamics trajectory data, J. Chem. Theory Comput., 2013, 9(7), 3084–3095 CrossRef CAS.
- B. R. Brooks, D. Janežič and M. Karplus, Harmonic analysis of large systems. I Methodology, J. Comput. Chem., 1995, 16(12), 1522–1542 CrossRef CAS.
- A. Onufriev, D. Bashford and D. A. Case, Exploring protein native states and large-scale conformational changes with a modified generalized born model, Proteins: Struct., Funct., Bioinf., 2004, 55(2), 383–394 CrossRef CAS.
- J. Weiser, P. S. Shenkin and W. C. Still, Approximate atomic surfaces from linear combinations of pairwise overlaps (LCPO), J. Comput. Chem., 1999, 20(2), 217–230 CrossRef CAS.
- E. Krissinel and K. Henrick, Inference of macromolecular assemblies from crystalline state, J. Mol. Biol., 2007, 372(3), 774–797 CrossRef CAS.
- M. Petukh, L. Dai and E. Alexov, SAAMBE: webserver to predict the charge of binding free energy caused by amino acids mutations, Int. J. Mol. Sci., 2016, 17(4), 547 CrossRef PubMed.
- W. L. DeLano, The PyMOL molecular graphics system, DeLano Scientific LLC, San Carlos, CA, USA, 2003 Search PubMed.
- L. Wang, M. Zhang and E. Alexov, DelPhiPKa web server: predicting pKa of proteins, RNAs and DNAs, Bioinformatics, 2015, 32(4), 614–615 CrossRef.
- C. Monnet, S. Jorieux, N. Souyris, O. Zaki, A. Jacquet and N. Fournier, et al., Combined glyco-and protein-Fc engineering simultaneously enhance cytotoxicity and half-life of a therapeutic antibody, mAbs, 2014, 6(2), 422–436 CrossRef.
- C. Wang, Y. Wu, L. Wang, B. Hong, Y. Jin and D. Hu, et al., Engineered soluble monomeric IgG1 Fc with significantly decreased non-specific binding, Front. Immunol., 2017, 8, 1545 CrossRef.
- Y. A. Yeung, M. K. Leabman, J. S. Marvin, J. Qiu, C. W. Adams and S. Lien, et al., Engineering human IgG1 affinity to human neonatal Fc receptor: impact of affinity improvement on pharmacokinetics in primates, J. Immunol., 2009, 182(12), 7663–7671 CrossRef CAS.
- T. Ying, W. Chen, R. Gong, Y. Feng and D. S. Dimitrov, Soluble monomeric IgG1 Fc, J. Biol. Chem., 2012, 287(23), 19399–19408 CrossRef CAS.
- T. Ying, T. Ju, Y. Wang, P. Prabakaran and D. Dimitrov, Interactions of IgG1 CH2 and CH3 Domains with FcRn, Front. Immunol., 2014, 5, 146 Search PubMed.
- J. K. Kim, M. F. Tsen, V. Ghetie and E. S. Ward, Localization of the site of the murine IgG1 molecule that is involved in binding to the murine intestinal Fc receptor, Eur. J. Immunol., 1994, 24, 2429–2434 CrossRef CAS.
- D. C. Roopenian, G. J. Christianson, T. J. Sproule, A. C. Brown, S. Akilesh and N. Jung, et al., The MHC class I-like IgG receptor controls perinatal IgG transport, IgG homeostasis, and fate of IgG-Fc-coupled drugs, J. Immunol., 2003, 170(7), 3528–3533 CrossRef CAS.
- B. T. Walters, P. F. Jensen, V. Larraillet, K. Lin, T. Patapoff and T. Schlothauer, et al., Conformational destabilization of immunoglobulin G increases the low pH binding affinity with the neonatal Fc receptor, J. Biol. Chem., 2016, 291(4), 1817–1825 CrossRef CAS.
- S. P. Edgcomb and K. P. Murphy, Variability in the pKa of histidine side-chains correlates with burial within proteins, Proteins: Struct., Funct., Bioinf., 2002, 49(1), 1–6 CrossRef CAS.
- W. T. Chu, Y. J. Wu, J. L. Zhang, Q. C. Zheng, L. Chen and Q. Xue, et al., Constant pH Molecular Dynamics (CpHMD) and mutation studies: insights into AaegOBP1 pH-induced ligand releasing mechanism, J. Proteins Proteomics, 2012, 1824(7), 913–918 CrossRef CAS.
- W. T. Chu, J. L. Zhang, Q. C. Zheng, L. Chen, Y. J. Wu and Q. Xue, et al., Constant pH molecular dynamics (CpHMD) and molecular docking studies of CquiOBP1 pH-induced ligand releasing mechanism, J. Mol. Model., 2013, 19(3), 1301–1309 CrossRef CAS.
Footnote |
| † Electronic supplementary information (ESI) available. See DOI: 10.1039/c9ra10712f |
|
| This journal is © The Royal Society of Chemistry 2020 |
Click here to see how this site uses Cookies. View our privacy policy here. 
 Open Access Article
 This Open Access Article is licensed under a Creative Commons Attribution-Non Commercial 3.0 Unported Licence
 and
Yee Siew Choong
and
Yee Siew Choong