 Open Access Article
A flexible polyelectrolyte-based gel polymer electrolyte for high-performance all-solid-state supercapacitor application†
Chaojing Yan,
Mengyuan Jin,
Xinxin Pan,
Longli Ma and
Xiaohua Ma *
*
Department of Materials Science, Fudan University, Shanghai 200433, China. E-mail: xhma@fudan.edu.cn
First published on 4th March 2020
Abstract
A simple polymerization process assisted with UV light for preparing a novel flexible polyelectrolyte-based gel polymer electrolyte (PGPE) is reported. Due to the existence of charged groups in the polyelectrolyte matrix, the PGPE exhibits favorable mechanical strength and excellent ionic conductivity (66.8 mS cm−1 at 25 °C). In addition, the all-solid-state supercapacitor fabricated with a PGPE membrane and activated carbon electrodes shows outstanding electrochemical performance. The specific capacitance of the PGPE supercapacitor is 64.92 F g−1 at 1 A g−1, and the device shows a maximum energy density of 13.26 W h kg−1 and a maximum power density of 2.26 kW kg−1. After 10![[thin space (1/6-em)]](https://www.rsc.org/images/entities/char_2009.gif) 000 cycles at a current density of 2 A g−1, the all-solid-state supercapacitor with PGPE reveals a capacitance retention of 94.63%. Furthermore, the specific capacitance and charge–discharge behaviors of the flexible PGPE device hardly change with the bending states.
000 cycles at a current density of 2 A g−1, the all-solid-state supercapacitor with PGPE reveals a capacitance retention of 94.63%. Furthermore, the specific capacitance and charge–discharge behaviors of the flexible PGPE device hardly change with the bending states.
1. Introduction
With the popularity of hybrid electric vehicles and portable electronics, there is a drastically increasing demand for flexible, lightweight and highly efficient energy storage devices.1,2 Due to the characteristics of high power densities, rapid charging/discharging rate and outstanding cycle performance, supercapacitors have attracted extensive attention as one of potential electrochemical energy storage device, which can meet the demand of the rapidly expanding portable device market.3–6 In supercapacitors, gel polymer electrolytes (GPEs) are widely studied owing to their flexibility, high ionic conductivity, stable electrochemical performances, being leakage-free and providing more opportunities for structure design.7,8 Generally, GPEs are composed of an electrolyte salt to provide mobile ions and a polymeric material as the matrix,7,9,10 and the designability of polymer matrix provides the possibility to improve the ionic conductivity of GPEs, which has been proved to have a significant impact on electrochemical and capacitance performance of the devices.11–14Actually, GPEs are mainly divided into non-aqueous and aqueous gel electrolytes. Non-aqueous GPEs, such as block-copolymer-based GPEs,15 semi-interpenetrating polymer network structure GPEs7 and silica-based GPEs,16 have been developed dissolved in ionic liquid or high-boiling organic solvents to solve the evaporation problem, thereby increasing the ion migration rate and the electrochemical performance of the device. However, due to the absence of water in the system, this hampers the ionic conductivity because of the decrease in the degree of hydrogen bonding present in the final system.17 Aqueous GPEs dominantly based on polyvinyl alcohol (PVA), poly(ethylene oxide) (PEO) and poly(acrylic acid) (PAA) matrix,8,9,18,19 the ionic conductivity is higher than non-aqueous due to the high water content by means of a large amount of hydrogen bonding in the GPEs. However, they are not suitable for long-term use because the gradual volatilization of water leads to ionic conductivity, cycling stability and electrochemical performance degradation.20
Recently, polyelectrolyte-based GPE (PGPE) is widely studied due to the excellent electrochemical properties in flexible all-solid-state supercapacitors.21,22 As a typical charged polymer, polyelectrolytes possess vigorous water retention ability on account of the presence of anions and cations which provides a mighty electrostatic attraction between the charged groups and water molecules, and the robust water retention ability of PGPE brings ion migration channels to the electrolyte ions, causing excellent electrochemical performance.9,23,24 Moreover, the robust water retention abilities and the easy separation of anions and cations during ion migration ensure high conductivity of PGPE.25,26 In addition, the charged groups and polar groups can enhance the adhesion between the PGPE and the electrode, thereby greatly reducing the interface impedance between the electrode and the electrolyte.9,27,28
Herein, a novel flexible polyelectrolyte material containing anions and cations in repeat units was designed and successfully synthesized through a simple alkylation reaction, which effectively improving the ion conductivity and mechanical strength of the GPE membrane. The PGPE matrix were prepared by the UV-assisted copolymerization of a novel aprotic monomer N-(2-methacryloyloxy) ethyl-N,N-dimethylpropanammonium bromide (C3(Br)DMAEMA) and poly(ethylene glycol) methacrylate (PEGMA). And then, the prepared PGPE matrix was immersed in 1 M Li2SO4/H2O solution, providing the excellent performance PGPE with high ionic conductivity (66.8 mS cm−1) and considerable mechanical ability. Moreover, the supercapacitor was assembled using the optimized PGPE as the electrolyte and activated carbon as the electrode, which exhibited excellent energy and power delivery, outstanding cycle stability, and great mechanical flexibility. Thus, the novel PGPE has a broad prospect in replacing traditional GPE and liquid electrolyte, and makes it more adaptable to meet the needs of flexible wearable devices.
2. Experimental
2.1. Materials
2-(Dimethylamino)ethyl methacrylate (DMAEMA, 99.0%), 1-bromopropane (99%), hydroquinone (≥99.5%), and the photo initiator 2-hydroxy-2-methylpropiophenone (HMPP, 97%) were purchased from Aladdin. Poly (ethylene glycol) methacrylate (PEGMA, average Mn = 360) was purchased from Sigma-Aldrich. Lithium sulfate (Li2SO4, monohydrate, AR), Acetone (99.0%), isopropanol (≥99.7%) and N-methyl-2-pyrrolidone (NMP, ≥99.0%) were bought from Sinopharm. Activated carbon (AC) was also purchased from Aladdin with a surface area of 2000 m2 g−1 and particle size of 10 μm.2.2. Preparation of the novel aprotic monomer C3(Br)DMAEMA
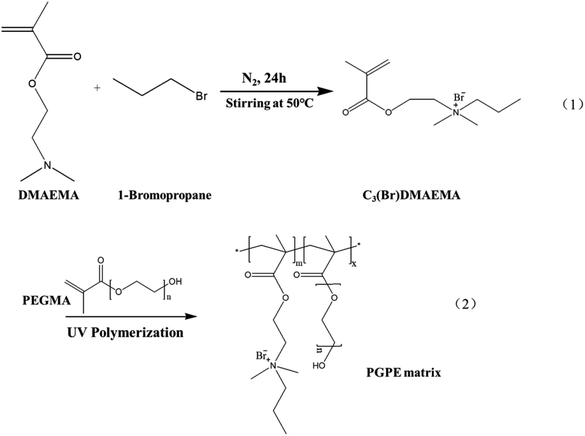
The novel aprotic monomer C3(Br)DMAEMA was prepared by alkylation reaction of DMAEMA with the appropriate 1-bromopropane,29,30 as shown in Scheme 1(1). DMAEMA (0.166 mol) was mixed with 1-bromopropane (0.083 mol) without any additional solvent. After the addition of a small portion of hydroquinone to inhibit any spurious radical polymerization, the mixture was stirred overnight at 50 °C. The solid product was purified by double recrystallization from an acetone/isopropanol mixture. Finally, it was dried under vacuum at 40 °C for 24 h and stored in an argon-filled glovebox.2.3. Preparation of polyelectrolyte-based GPE
The polyelectrolyte-based GPE was prepared by immersing the GPE matrix in aqueous solution of Li2SO4. To prepared the GPE matrix, C3(Br)DMAEMA, PEGMA, and photo initiator HMPP (4 wt% of C3(Br)DMAEMA content) were added to the deionized water with different mass rations and stirred to obtain a homogeneous solution. The precursor solution was then transferred into a 1 mm thick polytetrafluoroethylene groove and subjected to UV light (MXGainLAB40-40A, 1750 mW cm−2) curing for 10 min (curve of UV curing conversion rate at different irradiation time was shown in Fig. S2, ESI†) to form the polymer skeleton. The synthesis diagram of the GPE matrix is showing in Scheme 1(2). Subsequently, the polymer backbone was dried in a vacuum oven at 80 °C for 24 h to remove moisture from the polymer system. The dry film was then immersed in different concentrations Li2SO4/H2O electrolyte solution for about 12 h to obtain the ultimate GPE. As shown in Table S1 (ESI†), in a comprehensive consideration of mechanical properties and ionic conductivity, the optimum performance of GPE was obtained by soaking C3(Br)DMAEMA and PEGMA with a mass ratio of 8![[thin space (1/6-em)]](https://www.rsc.org/images/entities/char_2009.gif) :
:![[thin space (1/6-em)]](https://www.rsc.org/images/entities/char_2009.gif) 2 in 1 M Li2SO4/H2O solution. The obtained GPE with this ratio containing charged groups is named as PGPE. In order to explore the role that charged groups play in the GPE system, DMAEMA monomer was used in place of C3(Br)DMAEMA to prepare the GPE with the same ratio for comparison, named as P(DMAEMA-PEGMA) (PDPA).
2 in 1 M Li2SO4/H2O solution. The obtained GPE with this ratio containing charged groups is named as PGPE. In order to explore the role that charged groups play in the GPE system, DMAEMA monomer was used in place of C3(Br)DMAEMA to prepare the GPE with the same ratio for comparison, named as P(DMAEMA-PEGMA) (PDPA).
2.4. Preparation of the electrode and assemblage of the supercapacitors
To prepared the electrode, 80 wt% AC (active material), 10 wt% acetylene black (conductive agent), and 10 wt% poly(vinylidene fluoride) (PVDF) (binder) were mixed with NMP to form a homogeneous slurry. Subsequently, the obtained slurry was coated on the square nickel foam substrate (1 mm thickness) and dried at 110 °C under vacuum for 12 h. After drying, the AC electrode was pressed with a pressure of 5 MPa and cut into electrode sheets having a size of 2 cm × 2 cm. The mass loading of active material in each electrode was about 2.8 mg cm−2.For all-solid-state symmetric supercapacitor devices, the GPE film was sandwiched between two AC electrodes and transferred into a PET bag. Then, the PET bag was laminated using a roller press under a pressure of 0.5 MPa for 10 min and encapsulated.2
2.5. Characterization measurements
Fourier transform infrared (FT-IR) spectra was recorded on a Nicolet Nexus 470 spectrometer in the frequency range of 4000–400 cm−1, and the sample was pressed into a slice with KBr. The 1H NMR and 13C NMR spectra of C3(Br)DMAEMA were recorded on a Bruker spectrometer (500 MHz) using D2O as solvent. The surface morphology and energy dispersive spectrometer of the PGPE was examined by a field-emission scanning electron microscopy (FEI Nova NanoSEM 450). The X-ray diffraction (XRD) measurement was analyzed on an X-ray diffractometer (Bruker AXS D8 ADVANCE) using Cu Kα radiation. The thermal stability was characterized using thermogravimetric analysis (TGA, TA Instruments Q500) under N2 atmosphere at a heating rate of 20 °C min−1 from 40 to 600 °C. The mechanical properties of PGPE were evaluated using a CMT4140 universal tensile testing machine at a tensile rate of 6 mm min−1. The ionic conductivity of the GPEs from 10 to 80 °C was measured by electrochemical impedance spectroscopy (EIS) using a CHI 660E electrochemical workstation in the frequency range between 1 Hz and 1 MHz with a potential amplitude of 5 mV. Before testing, each sample was kept at the corresponding test temperature for half an hour. The GPEs were sandwiched between two stainless steel electrodes for testing. The ionic conductivity of the GPE was calculated according to the following equation:| σ = L/(R × S) | (1) |
2.6. Electrochemical characterization of supercapacitors
All electrochemical measurements of the supercapacitor were performed on a CHI 660E electrochemical workstation using a symmetric two-electrode capacitor configuration. EIS measurement of supercapacitor was performed in the frequency range from 1 Hz to 1 MHz with a potential amplitude of 5 mV. Cyclic voltammetry (CV) measurements were performed in the potential range of 0–1.2 V at various scan rates (10, 20, 50, 100, and 200 mV s−1). The galvanostatic charge/discharge (GCD) method was tested at various current densities (0.5, 1, 2, 5, and 10 A g−1) in the same potential range from 0 to 1.2 V. The specific capacitance (Cs, F g−1) of the symmetric supercapacitor device was calculated based on the GCD curves according to the following equation:| Cs = (I × Δt)/(m × ΔV) | (2) |
The energy density (E, W h kg−1) and power density (P, kW kg−1) of the supercapacitors were calculated as follows:
 | (3) |
| P = E/Δt | (4) |
3. Results and discussion
3.1. Physicochemical characterization of C3(Br)DMAEMA
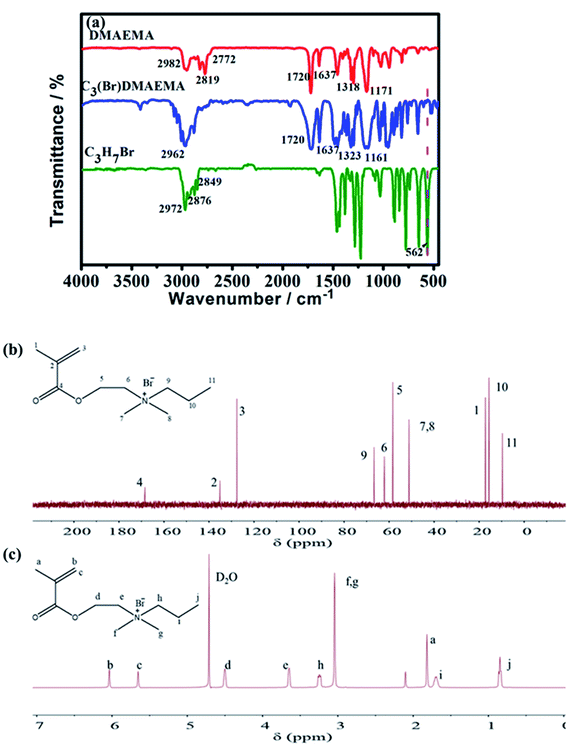
The successful synthesis of C3(Br)DMAEMA was confirmed by FT-IR, 13C NMR and 1H NMR spectroscopies. The FT-IR spectra of the reactants (DMAEMA and C3H7Br) and the product (C3(Br)DMAEMA) are shown in Fig. 1a. Obviously, the peak at 562 cm−1 (C–Br, stretching vibration) is almost invisible in the spectrum of C3(Br)DMAEMA, but it is evident in C3H7Br, indicating the formation of an aprotic structure. In addition, the peak at 1323 cm−1 is assigned to the stretching vibration of C–N bond in the C3(Br)DMAEMA, deviating slightly from the peak at 1318 cm−1 in DMAEMA, which should be due to the change of space steric hindrance around the C–N bond. The multiple absorption peaks appearing in the range of 2770–2990 cm−1 (C–H stretching of –CH3, –CH2– and![[double bond, length as m-dash]](https://www.rsc.org/images/entities/char_e001.gif) C–H), 1720 cm−1 (C
C–H), 1720 cm−1 (C![[double bond, length as m-dash]](https://www.rsc.org/images/entities/char_e001.gif) O, stretching), 1637 cm−1 (C
O, stretching), 1637 cm−1 (C![[double bond, length as m-dash]](https://www.rsc.org/images/entities/char_e001.gif) C, stretching) and 1161 cm−1 (C–O–C, stretching) are well in accordance with the structure of the C3(Br)DMAEMA.
C, stretching) and 1161 cm−1 (C–O–C, stretching) are well in accordance with the structure of the C3(Br)DMAEMA.
Fig. 1b shows the 13C NMR spectra of the C3(Br)DMAEMA, the peaks at 135.12 ppm (signal 2) and 127.61 ppm (signal 3) are correspond to carbon atoms on the C![[double bond, length as m-dash]](https://www.rsc.org/images/entities/char_e001.gif) C bond. The 168.44 ppm (4) is assigned to carbon atoms on the C
C bond. The 168.44 ppm (4) is assigned to carbon atoms on the C![[double bond, length as m-dash]](https://www.rsc.org/images/entities/char_e001.gif) O bond. The 17.21 ppm (1), 51.14 ppm (7, 8) and 9.68 ppm (11) are related to carbon atoms on –CH3. In addition, the appearance of peaks at 66.66 ppm (9), 62.12 ppm (6), 58.36 ppm (5) and 15.62 ppm (10) are assigned to carbon atoms on –CH2–. The 13C NMR analysis was performed to confirm the successful synthesis of C3(Br)DMAEMA. Meanwhile, the successful synthesis of the product C3(Br)DMAEMA was also confirmed by the characterization of 1H NMR spectra in Fig. 1c. The signals observed at 6.04 ppm (b) and 5.65 ppm (c) are related to hydrogen atoms on the unsaturated double bond. The signals at 4.50 ppm (d), 3.65 ppm (e), 3.24 ppm (h) and 1.71 ppm (i) perfectly coincide with the methylene hydrogen atoms in different chemical environments. And signals at 1.82 ppm (a), 3.04 ppm (f, g), and 0.86 ppm (j) attribute to the methyl hydrogen atoms in the structure of C3(Br)DMAEMA.
O bond. The 17.21 ppm (1), 51.14 ppm (7, 8) and 9.68 ppm (11) are related to carbon atoms on –CH3. In addition, the appearance of peaks at 66.66 ppm (9), 62.12 ppm (6), 58.36 ppm (5) and 15.62 ppm (10) are assigned to carbon atoms on –CH2–. The 13C NMR analysis was performed to confirm the successful synthesis of C3(Br)DMAEMA. Meanwhile, the successful synthesis of the product C3(Br)DMAEMA was also confirmed by the characterization of 1H NMR spectra in Fig. 1c. The signals observed at 6.04 ppm (b) and 5.65 ppm (c) are related to hydrogen atoms on the unsaturated double bond. The signals at 4.50 ppm (d), 3.65 ppm (e), 3.24 ppm (h) and 1.71 ppm (i) perfectly coincide with the methylene hydrogen atoms in different chemical environments. And signals at 1.82 ppm (a), 3.04 ppm (f, g), and 0.86 ppm (j) attribute to the methyl hydrogen atoms in the structure of C3(Br)DMAEMA.
3.2. Characterization of polyelectrolyte-based GPEs
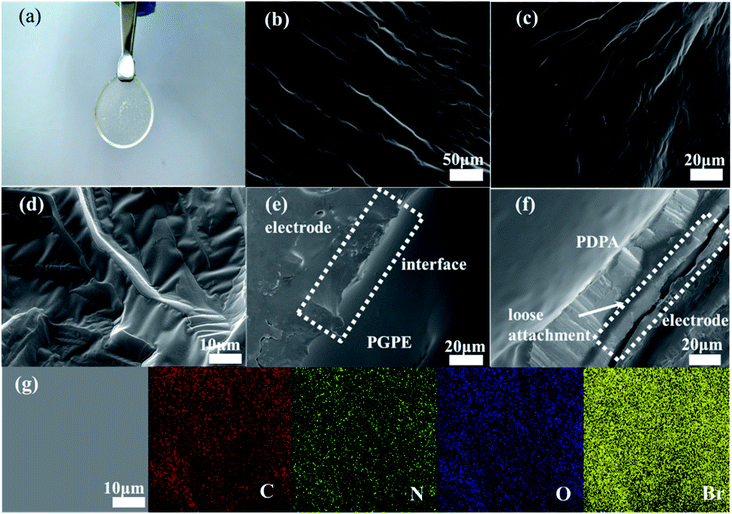
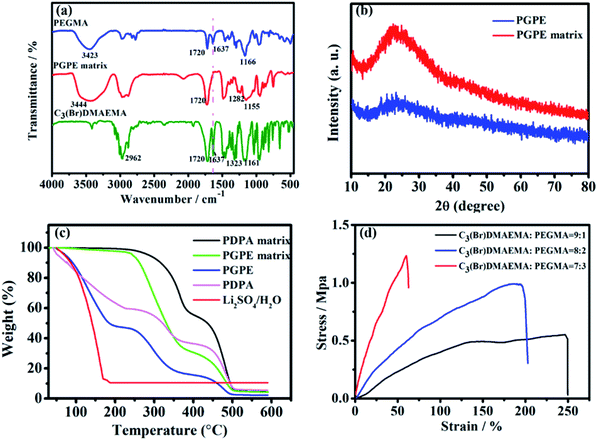
The photograph image of the PGPE with a thickness of about 500 μm is shown in Fig. 2a, indicating that the PGPE film is transparent, free-standing and uniform after immersing electrolyte salts. Fig. 2b–d show the scanning electron microscopy (SEM) image of the surface of PGPE matrix with various magnification. The magnified SEM images show that there are lots of grooves of various shapes on the surface of the polymer matrix, which improves the roughness of the material surface so that the PGPE matrix can maintain quantities of liquid electrolyte and effectively enhance the ionic conductivity of the PGPE. From the SEM image of interface between the AC electrode and PGPE (Fig. 2e), the PGPE membrane compactly adhere to the AC electrode, comparing with the loose attachment between PDPA and AC electrode (Fig. 2f), revealing that the presence of charged groups in PGPE can enhance the adhesion, which can significantly decrease the interfacial resistance caused by interval and thus improve the electrochemical stability of supercapacitors devices. As shown in Fig. 2g, the element (C, N, O, Br) mapping of the PGPE indicates the obtained PGPE film is homogeneous.The UV irradiation polymerization reaction of PEGMA and C3(Br)DMAEMA was interpreted by FT-IR spectra in Fig. 3a. The peaks of PEGMA placed in 3423, 1720, 1637 and 1166 cm−1 ascribed to –OH stretching, C![[double bond, length as m-dash]](https://www.rsc.org/images/entities/char_e001.gif) O stretching, C
O stretching, C![[double bond, length as m-dash]](https://www.rsc.org/images/entities/char_e001.gif) C stretching and C–O–C stretching, respectively. In comparison with the FT-IR spectrum of PEGMA and C3(Br)DMAEMA, the remarkable peaks at 3444 cm−1 (–OH, stretching), 1720 cm−1 (C
C stretching and C–O–C stretching, respectively. In comparison with the FT-IR spectrum of PEGMA and C3(Br)DMAEMA, the remarkable peaks at 3444 cm−1 (–OH, stretching), 1720 cm−1 (C![[double bond, length as m-dash]](https://www.rsc.org/images/entities/char_e001.gif) O, stretching), 1282 cm−1 (C–N, stretching) and 1155 cm−1 (C–O–C, stretching) in the spectrum of PGPE matrix confirm that the synthetized PGPE matrix includes both the components. Especially, the peak at 1637 cm−1 completely disappeared in the PGPE matrix compared with the spectrum of PEGMA and C3(Br)DMAEMA, affirming the complete polymerization reaction of the monomers. The XRD pattern of PGPE and PGPE matrix are shown in Fig. 3b. As can be seen, one hump in the region of 15–35° is attributed to the amorphous nature of PGPE matrix. Besides, the addition of liquid electrolyte 1 M Li2SO4/H2O solution in PGPE further reduced the degree of crystallinity compared to PGPE matrix. However, the decrease of crystallinity and amorphous nature of PGPE can accelerate the electrolyte ion transport, thus greatly improving ionic conductivity and electrochemical performance.7,31,32
O, stretching), 1282 cm−1 (C–N, stretching) and 1155 cm−1 (C–O–C, stretching) in the spectrum of PGPE matrix confirm that the synthetized PGPE matrix includes both the components. Especially, the peak at 1637 cm−1 completely disappeared in the PGPE matrix compared with the spectrum of PEGMA and C3(Br)DMAEMA, affirming the complete polymerization reaction of the monomers. The XRD pattern of PGPE and PGPE matrix are shown in Fig. 3b. As can be seen, one hump in the region of 15–35° is attributed to the amorphous nature of PGPE matrix. Besides, the addition of liquid electrolyte 1 M Li2SO4/H2O solution in PGPE further reduced the degree of crystallinity compared to PGPE matrix. However, the decrease of crystallinity and amorphous nature of PGPE can accelerate the electrolyte ion transport, thus greatly improving ionic conductivity and electrochemical performance.7,31,32
The thermal stability of PGPE was evaluated by TGA, and the TGA thermograms of PGPE and PGPE matrix, PDPA, PDPA matrix and 1 M Li2SO4/H2O solution are shown in Fig. 3c. The prepared PGPE has 52% weight loss at 40–180 °C, which is due to the massive water in the system. In comparison with the PDPA possesses only 40% weight loss indicating that the PGPE can maintain more water at room temperature, which is ascribed to the presence of hydrogen bond between the charge group and water. In addition, the weight loss rate of PDPA is significantly faster than PGPE before 100 °C, which also proves that PGPE has better water retention capacity. The weight loss near 250–350 °C may be due to the thermal decomposition of some small molecules in the polymer system. The weight loss at around 450 °C should be attributed to the decomposition of the main chains of the PGPE. Overall, the PGPE demonstrates better thermal stability and water retention capacity for application in supercapacitor devices.
In addition to the performance mentioned above, the mechanical strength of the GPE membrane is essential property for the application of flexible devices. The typical stress–stain curves of GPE with different monomer ratios (immersing in 1 M Li2SO4/H2O solution) are shown in Fig. 3d. The tensile strength of the PGPE membrane (C3(Br)DMAEMA![[thin space (1/6-em)]](https://www.rsc.org/images/entities/char_2009.gif) :
:![[thin space (1/6-em)]](https://www.rsc.org/images/entities/char_2009.gif) PEGMA = 8
PEGMA = 8![[thin space (1/6-em)]](https://www.rsc.org/images/entities/char_2009.gif) :
:![[thin space (1/6-em)]](https://www.rsc.org/images/entities/char_2009.gif) 2) is 0.99 MPa with a maximum strain of 195.6%, which providing sufficient mechanical strength for flexible supercapacitor devices.
2) is 0.99 MPa with a maximum strain of 195.6%, which providing sufficient mechanical strength for flexible supercapacitor devices.
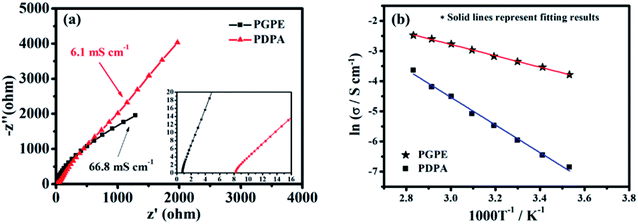
The room temperature ionic conductivity of the prepared PGPE and the PDPA film is computed from the Nyquist plots shown in Fig. 4a. As we can see, PGPE exhibits significantly lower resistance (0.72 Ω) and higher conductivity (66.8 mS cm−1) than PDPA (8.27 Ω and 6.1 mS cm−1) at 25 °C, in coordination with the characterization results of SEM, TGA and XRD. Compared to the other previous reported GPEs (Table S2, ESI†), the conductivity performance is still outstanding due to the presence of charge groups in PGPE. The temperature impendence of the ionic conductivity (ln![[thin space (1/6-em)]](https://www.rsc.org/images/entities/char_2009.gif) σ vs. 1000/T) of PGPE and PDPA from 10 to 80 °C is shown in Fig. 4b. The thermal dependence of conductivity (ln
σ vs. 1000/T) of PGPE and PDPA from 10 to 80 °C is shown in Fig. 4b. The thermal dependence of conductivity (ln![[thin space (1/6-em)]](https://www.rsc.org/images/entities/char_2009.gif) σ vs. 1000/T) abides by the Arrhenius relationship equation:17,33
σ vs. 1000/T) abides by the Arrhenius relationship equation:17,33
σ = σ0![[thin space (1/6-em)]](https://www.rsc.org/images/entities/char_2009.gif) exp(−Ea/RT) exp(−Ea/RT)
| (5) |
3.3. Electrochemical performance of all-solid-state supercapacitors
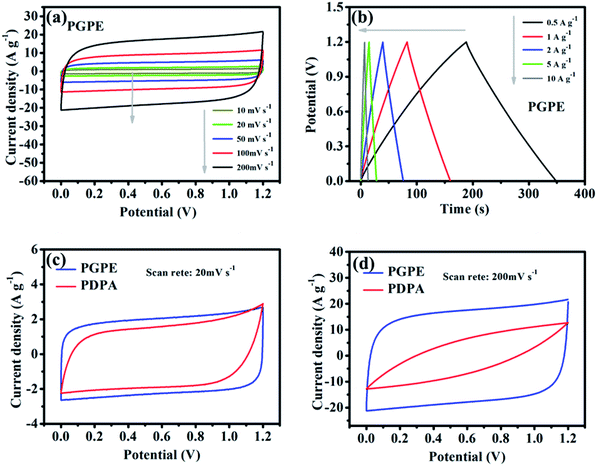
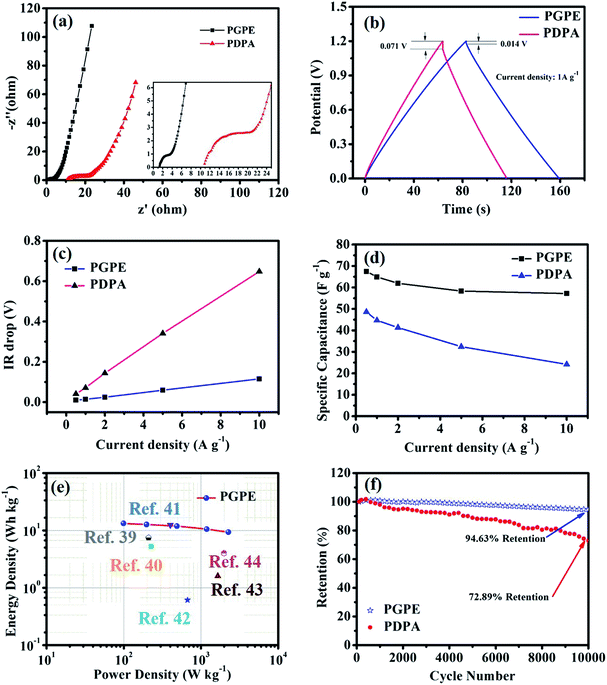
The electrochemical performance of the PGPE all-solid-state supercapacitor with two symmetrical AC electrodes was evaluated by CV, GCD and EIS tests at room temperature. Fig. 5a presents the CV curves of PGPE supercapacitor at different scan rates from 10 to 200 mV s−1. The PGPE supercapacitor exhibits a wide potential window of 1.2 V and remains a similar rectangular shape with the increase of scanning rates of the CV loops, confirming an outstanding stability. The galvanostatic charge/discharge curves of PGPE supercapacitor at different current densities from 0.5 to 10 A g−1 in the voltage range of 0–1.2 V are shown in Fig. 5b, which is a reliable method to indicate the reversible ion adsorption/desorption process at the surface of the AC electrode.34 The CV and GCD curves of all-solid-state supercapacitor with PDPA as the electrolyte are shown in Fig. S1 (ESI†). In order to further study the electrochemical performance of PGPE all-solid-state supercapacitors, the measured values of CV and GCD of the supercapacitor with PGPE were compared with PDPA all-solid-state supercapacitors. Fig. 5c and d show that comparison of CV measurement for PGPE and PDPA supercapacitors at the scan rates of 20 and 200 mV s−1, respectively. As we can see, both the CV curves at low scan rate of 20 mV s−1 show close to the standard rectangular, demonstrating the typical double-layer capacitance performance.8,35 When the potential scan rate reaches 200 mV s−1, the CV profile of PDPA deviates from the perfect square behavior and shows inferior capacitive characteristic, which is ascribed to the charge transport resistance.36 However, the CV curve of PGPE supercapacitor remains a perfect square behavior and higher capacitive performance than PDPA, suggesting the fast-ionic motions in the PGPE supercapacitors.Nyquist plots are shown in Fig. 6a to investigate the resistance behavior of the all-solid-state supercapacitors with PGPE and PDPA. As shown in Fig. 6a, both the Nyquist plots present a depressed semicircle at high frequency region and a line at low frequency. The intercept point on the real axis at high frequency reflects the bulk resistance of supercapacitors consisting of the resistance of electrolyte and the internal resistance of the electrodes. In addition, the diameter of the depressed semicircle represents charge transport resistance, ascribing to the interface resistance of the electrode and electrolyte. And the vertical straight line represents the ion diffusion behavior and the diffusion impedance decreases with the increase of the line slope.7,34,37 It is obviously seen in Fig. 6a that, the PGPE device exhibits lower bulk and interface impedance than PDPA, which is owing to the higher ionic conductivity and more compact adhesion between electrolyte and electrode (shown in Fig. 2e and f). In addition, the line of PGPE device presents a greater slope than PDPA at low frequency region, indicating the faster ion diffusion behavior.
The charge–discharge curves of supercapacitor fabricated by PGPE and PDPA at a current density of 1 A g−1 are shown in Fig. 6b. The two curves demonstrate a nearly triangular linear behavior, which is consistent with the capacitive charge–discharge mechanism of the ideal double-layer capacitor.35 It can be calculated from the GCD curves that, the mass-specific capacitance of PGPE supercapacitor (64.92 F g−1) is much higher than that of the PDPA supercapacitor (44.67 F g−1). Moreover, it is clearly observed that the IR drop of the PGPE device (0.014 V) is lower than that of the PDPA device (0.071 V), which is associated with the overall resistance of the supercapacitor and consistent with Fig. 6a.
Fig. 6c shows the linear behavior of IR drop with the increase of current density, where the overall resistance of the supercapacitor is related to the initial voltage drop and the slope of the line.38 It can be seen that, both the initial voltage drop and the slope of PGPE supercapacitor are much lower than that of PDPA device, indicating the lower overall resistance in the PGPE device. The mass-specific capacitances of supercapacitors with PGPE and PDPA at different current densities are plotted in Fig. 6d. The PGPE supercapacitor exhibits an excellent retention (84.74%) of specific capacitance from 0.5 A g−1 (67.47 F g−1) to 10 A g−1 (57.17 F g−1), whereas the PDPA device shows a fast drop in capacitance at a higher current density resulting in an inferior retention of 49.85% (from 48.61 F g−1 at 0.5 A g−1 to 24.23 F g−1 at 10 A g−1). The higher capacitance retention of PGPE supercapacitor may be attributed to the lower overall resistance in the device.
To further evaluate the performance of all-solid-state supercapacitor with PGPE, we have plotted the Ragone plots to compare our device with those previously reported examples in the literature,39–44 and it clearly exhibits superior energy and power density (show in Fig. 6e). The PGPE device shows a maximum power density of 2.26 kW kg−1 at an energy density of 9.34 W h kg−1 and a maximum energy density of 13.26 W h kg−1 at a power density of 0.11 kW kg−1. In addition, the cycle stability of the PGPE and PDPA devices are evaluated using GCD test from 0 to 1.2 V at a current density of 2 A g−1 for 10![[thin space (1/6-em)]](https://www.rsc.org/images/entities/char_2009.gif) 000 cycles (Fig. 6f). It is observed that the capacitance of the PGPE supercapacitor remained 94.63% after 10
000 cycles (Fig. 6f). It is observed that the capacitance of the PGPE supercapacitor remained 94.63% after 10![[thin space (1/6-em)]](https://www.rsc.org/images/entities/char_2009.gif) 000 cycles, significantly higher than the capacitance retention (72.89%) of PDPA device.
000 cycles, significantly higher than the capacitance retention (72.89%) of PDPA device.
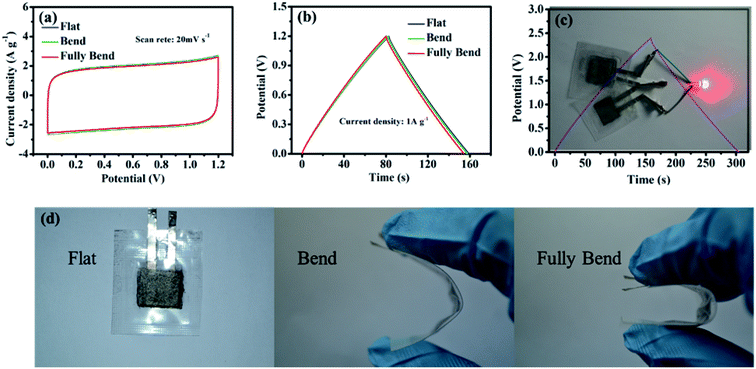
In order to investigate the electrochemical performance of PGPE in flexible supercapacitor devices, the PGPE devices were tested at various deformation states (show in Fig. 7d). Fig. 7a represents the CV curves of the PGPE supercapacitors at flat, bend and fully bend states. As we can clearly see that, the approximate CV curves for the PGPE supercapacitors at different states are obtained, demonstrating the nearly rectangular CV responses and the similar rectangular area. This indicates that the bending states of the PGPE devices has little effect on the response of CV. In addition, the GCD curves are shown in Fig. 7b, which also shows almost the same mass specific capacity (64.92 F g−1 at flat, 64.56 F g−1 at bend and 64.27 F g−1 at fully bend). It proves that the PGPE supercapacitor has ideal flexibility and the bending states of devices have no effect on the electrochemical performance. Significantly, the device can be used to light a red LED by two 1.2 V supercapacitor devices connected in series (Fig. 7c), indicating its promising realistic applications in energy storage.
4. Conclusions
In summary, a novel GPE containing charged groups was successfully synthesized and applied to all-solid-state supercapacitor. The presence of charged groups is beneficial to improve the ionic conductivity and mechanical properties of PGPE membrane, and enhances the adhesion between the electrode and the PGPE film. The prepared PGPE exhibits favorable ionic conductivity (66.8 mS cm−1) and excellent mechanical strength (high tensile stress of 0.99 MPa with a maximum strain of 195.6%). The all-solid-state supercapacitor based on PGPE presents a broad electrochemical window (1.2 V) and small bulk and interface resistance with a higher specific capacitance of 64.92 F g−1 than 44.67 F g−1 of the PDPA supercapacitor at 1 A g−1. In addition, the PGPE device exhibits a maximum energy density of 13.26 W h kg−1 and a maximum power density of 2.26 kW kg−1. After 10![[thin space (1/6-em)]](https://www.rsc.org/images/entities/char_2009.gif) 000 cycles, the device of PGPE reveals a much better capacitance retention of 94.63% than that of PDPA device (72.89%). Furthermore, when the PGPE supercapacitor is fully bent, the specific capacitance and the charge–discharge behaviors of the supercapacitor hardly changes. Consequently, the novel all-solid-state PGPE supercapacitor has vast potential for practical application, such as portable and flexible electronic devices. More importantly, the results of this work have practical significance in the application of polyelectrolyte as a polymer matrix to flexible devices.
000 cycles, the device of PGPE reveals a much better capacitance retention of 94.63% than that of PDPA device (72.89%). Furthermore, when the PGPE supercapacitor is fully bent, the specific capacitance and the charge–discharge behaviors of the supercapacitor hardly changes. Consequently, the novel all-solid-state PGPE supercapacitor has vast potential for practical application, such as portable and flexible electronic devices. More importantly, the results of this work have practical significance in the application of polyelectrolyte as a polymer matrix to flexible devices.
Conflicts of interest
There are no conflicts to declare.Acknowledgements
This work was financially supported by the Research Foundation of Shanghai Academy of Spaceflight Technology (SAST2016110), and the China Postdoctoral Science Foundation (2015M571837).References
- T. Lv, M. X. Liu, D. Z. Zhu, L. H. Gan and T. Chen, Adv. Mater., 2018, 30, 17 Search PubMed.
- J. Tang, M. Jin, P. Yuan, Y. Fu and X. Ma, Adv. Energy Mater., 2016, 6, 1600146 CrossRef.
- P. Simon and Y. Gogotsi, Nat. Mater., 2008, 7, 845–854 CrossRef CAS PubMed.
- P. Simon, Y. Gogotsi and B. Dunn, Science, 2014, 343, 1210–1211 CrossRef CAS PubMed.
- Y. G. Wang, Y. F. Song and Y. Y. Xia, Chem. Soc. Rev., 2016, 45, 5925–5950 RSC.
- A. Burke, J. Power Sources, 2000, 91, 37–50 CrossRef CAS.
- M. Jin, Y. Zhang, C. Yan, Y. Fu, Y. Guo and X. Ma, ACS Appl. Mater. Interfaces, 2018, 10, 39570–39580 CrossRef CAS PubMed.
- X. Hu, L. Fan, G. Qin, Z. Shen, J. Chen, M. Wang, J. Yang and Q. Chen, J. Power Sources, 2019, 414, 201–209 CrossRef CAS.
- X. Peng, H. L. Liu, Q. Yin, J. C. Wu, P. Z. Chen, G. Z. Zhang, G. M. Liu, C. Z. Wu and Y. Xie, Nat. Commun., 2016, 7, 8 Search PubMed.
- X. H. Lu, M. H. Yu, G. M. Wang, Y. X. Tong and Y. Li, Energy Environ. Sci., 2014, 7, 2160–2181 RSC.
- X. Yang, F. Zhang, L. Zhang, T. F. Zhang, Y. Huang and Y. S. Chen, Adv. Funct. Mater., 2013, 23, 3353–3360 CrossRef CAS.
- Z. K. Wang, F. Tao and Q. M. Pan, J. Mater. Chem. A, 2016, 4, 17732–17739 RSC.
- G. F. Ma, J. J. Li, K. J. Sun, H. Peng, J. J. Mu and Z. Q. Lei, J. Power Sources, 2014, 256, 281–287 CrossRef CAS.
- G. Wee, O. Larsson, M. Srinivasan, M. Berggren, X. Crispin and S. Mhaisalkar, Adv. Funct. Mater., 2010, 20, 4344–4350 CrossRef CAS.
- Y. J. Kang, S. J. Chun, S. S. Lee, B. Y. Kim, J. H. Kim, H. Chung, S. Y. Lee and W. Kim, ACS Nano, 2012, 6, 6400–6406 CrossRef CAS PubMed.
- Y. J. Kang, H. Chung, C. H. Han and W. Kim, Nanotechnology, 2012, 23, 6 Search PubMed.
- V. Vijayakumar, M. Ghosh, A. A. T. Torris, N. M. K. Chandran, S. B. Nair, M. V. Badiger and S. Kurungot, ACS Sustainable Chem. Eng., 2018, 6, 12630–12640 CrossRef CAS.
- Q. H. Li, J. H. Wu, Z. Y. Tang, Y. M. Xiao, M. L. Huang and J. M. Lin, Electrochim. Acta, 2010, 55, 2777–2781 CrossRef CAS.
- S. H. Wang, S. S. Hou, P. L. Kuo and H. Teng, ACS Appl. Mater. Interfaces, 2013, 5, 8477–8485 CrossRef CAS PubMed.
- B. Anothumakkool, A. A. T. Torris, S. Veeliyath, V. Vijayakumar, M. V. Badiger and S. Kurungot, ACS Appl. Mater. Interfaces, 2016, 8, 1233–1241 CrossRef CAS.
- F. X. Wang, X. W. Wu, X. H. Yuan, Z. C. Liu, Y. Zhang, L. J. Fu, Y. S. Zhu, Q. M. Zhou, Y. P. Wu and W. Huang, Chem. Soc. Rev., 2017, 46, 6816–6854 RSC.
- Y. Huang, M. Zhong, Y. Huang, M. S. Zhu, Z. X. Pei, Z. F. Wang, Q. Xue, X. M. Xie and C. Y. Zhi, Nat. Commun., 2015, 6, 8 Search PubMed.
- R. Lalani and L. Y. Liu, Biomacromolecules, 2012, 13, 1853–1863 CrossRef CAS PubMed.
- J. Wang, M. D. Deng, Y. H. Xiao, W. T. Hao and C. F. Zhu, New J. Chem., 2019, 43, 4815–4822 RSC.
- J. Cardoso, A. Huanosta and O. Manero, Macromolecules, 1991, 24, 2890–2895 CrossRef CAS.
- C. Tiyapiboonchaiya, J. M. Pringle, J. Z. Sun, N. Byrne, P. C. Howlett, D. R. Macfarlane and M. Forsyth, Nat. Mater., 2004, 3, 29–32 CrossRef CAS PubMed.
- R. H. Brown, A. J. Duncan, J.-H. Choi, J. K. Park, T. Wu, D. J. Leo, K. I. Winey, R. B. Moore and T. E. Long, Macromolecules, 2010, 43, 790–796 CrossRef CAS.
- N. Matsumi, K. Sugai, M. Miyake and H. Ohno, Macromolecules, 2006, 39, 6924–6927 CrossRef CAS.
- J. J. R. Stalgren, V. Pamedytyte, R. Makuska, P. M. Claesson, W. Brown and U. Jacobsson, Polym. Int., 2003, 52, 399–405 CrossRef CAS.
- S. M. Hamid and D. C. Sherrington, Polymer, 1987, 28, 325–331 CrossRef CAS.
- M. Imperiyka, A. Ahmad, S. A. Hanifah, N. S. Mohamed and M. Y. A. Rahman, Int. J. Hydrogen Energy, 2014, 39, 3018–3024 CrossRef CAS.
- A. R. Polu, D. K. Kim and H.-W. Rhee, Ionics, 2015, 21, 2771–2780 CrossRef CAS.
- Y. Y. Wang, N. A. Lane, C. N. Sun, F. Fan, T. A. Zawodzinski and A. P. Sokolov, J. Phys. Chem. B, 2013, 117, 8003–8009 CrossRef CAS PubMed.
- X. Zhang, L. L. Wang, J. Peng, P. F. Cao, X. S. Cai, J. Q. Li and M. L. Zhai, Adv. Mater. Interfaces, 2015, 2, 9 Search PubMed.
- E. Frackowiak and F. Beguin, Carbon, 2001, 39, 937–950 CrossRef CAS.
- C.-W. Huang, C.-A. Wu, S.-S. Hou, P.-L. Kuo, C.-T. Hsieh and H. Teng, Adv. Funct. Mater., 2012, 22, 4677–4685 CrossRef CAS.
- B. G. Choi, M. Yang, W. H. Hong, J. W. Choi and Y. S. Huh, ACS Nano, 2012, 6, 4020–4028 CrossRef CAS PubMed.
- A. Izadi-Najafabadi, S. Yasuda, K. Kobashi, T. Yamada, D. N. Futaba, H. Hatori, M. Yumura, S. Iijima and K. Hata, Adv. Mater., 2010, 22, E235–E241 CrossRef CAS PubMed.
- H. Z. Yang, Y. Liu, L. B. Kong, L. Kang and F. Ran, J. Power Sources, 2019, 426, 47–54 CrossRef CAS.
- Y. Yoon, K. Lee, S. Kwon, S. Seo, H. Yoo, S. Kim, Y. Shin, Y. Park, D. Kim, J.-Y. Choi and H. Lee, ACS Nano, 2014, 8, 4580–4590 CrossRef CAS PubMed.
- H.-W. Chang, Y.-R. Lu, J.-L. Chen, C.-L. Chen, J.-M. Chen, Y.-C. Tsai, W. C. Chou and C.-L. Dong, J. Phys. Chem. C, 2016, 120, 22134–22141 CrossRef CAS.
- S. Huo, M. Liu, L. Wu, M. Liu, M. Xu, W. Ni and Y.-M. Yan, J. Power Sources, 2018, 387, 81–90 CrossRef CAS.
- Y. Xu, Z. Lin, X. Huang, Y. Liu, Y. Huang and X. Duan, ACS Nano, 2013, 7, 4042–4049 CrossRef CAS PubMed.
- Z.-S. Wu, A. Winter, L. Chen, Y. Sun, A. Turchanin, X. Feng and K. Muellen, Adv. Mater., 2012, 24, 5130–5135 CrossRef CAS PubMed.
Footnote |
| † Electronic supplementary information (ESI) available. See DOI: 10.1039/c9ra10701k |
| This journal is © The Royal Society of Chemistry 2020 |

