
 Open Access Article
 This Open Access Article is licensed under a Creative Commons Attribution-Non Commercial 3.0 Unported Licence
Nano ferrites (AFe2O4, A = Zn, Co, Mn, Cu) as efficient catalysts for catalytic ozonation of toluene†
Hongbin Jiang,
Xiaochen Xu *,
Rao Zhang,
Yun Zhang*,
Jie Chen and
Fenglin Yang
*,
Rao Zhang,
Yun Zhang*,
Jie Chen and
Fenglin Yang
Key Laboratory of Industrial Ecology and Environmental Engineering, Ministry of Education, School of Environmental Science and Technology, Dalian University of Technology, Linggong Road 2#, Dalian 116024, China. E-mail: xxcep@dlut.edu.cn; zhangyun@dlut.edu.cn; Fax: +86 411 84706328; Tel: +86 411 84706328
First published on 31st January 2020
Abstract
Nano ferrites (AFe2O4, A = Zn, Co, Mn, Cu) were supported on the surface of γ-Al2O3 support by hydrothermal synthesis to prepare a series of novel composite catalysts (AFe2O4/γ-Al2O3) for catalytic ozonation for elimination of high concentration toluene at ambient temperature. The characterization results showed that the high-purity nano-AFe2O4 particles were uniformly loaded on mesoporous γ-Al2O3. Further, it was confirmed that among the several catalysts prepared, the amount of oxygen vacancies (Ovs), Lewis acid sites (LAS), and Brønsted acid sites (BAS) of the ZnFe2O4/γ-Al2O3 catalyst were the highest. This meant that the ZnFe2O4/γ-Al2O3 catalyst had a strong adsorption capacity for toluene and ozone (O3), and had a strong catalytic activity. When the temperature was 293 K and the space velocity was 1500 h−1, the mol ratio of O3 to toluene was 6, the degradation rate of toluene (600 mg m−3) can reach an optimum of 99.8%. The results of electron paramagnetic resonance (EPR) and Fourier infrared (FT-IR) proved superoxide radicals and hydroxyl radicals by catalytic ozonation. Moreover, the GC-MS analysis results indicated that the toluene degradation began with the oxidation of methyl groups on the benzene ring, eventually producing CO2 and H2O. After repeated experiments, the toluene degradation rate remained stable, and the residual content of O3 in each litre of produced gas was less than 1 mg L−1, thereby indicating that the ZnFe2O4/γ-Al2O3 catalyst had excellent reusability and showed great potential for the treatment of toluene waste gas.
Introduction
As a volatile organic compound (VOC), toluene, which has large emissions from industrial production,1 has a certain carcinogenic effect and is capable of anaesthetizing the central nervous system.2 Therefore, the management of toluene pollution is related to the health of all human beings. There are two broad categories of techniques to remove toluene: recycling processes and degradation processes. The recovery process includes adsorption3 and condensation. Since the recovery method only enriches the pollutants and does not degrade them, it is usually not used for the treatment of high concentrations of toluene. The degradation processes include biological degradation,4 photocatalysis,5 catalytic combustion,6 plasma catalytic degradation7 and some emerging combined processes.8 The degradation process can degrade toluene into environmentally friendly products, thereby avoiding the toluene re-contamination in the environment. At present, there are still some problems with most toluene degradation methods. The removal of toluene by biodegradation requires a very long reaction time (nearly 24 hours), and the degradation rate can only reach 80%.9 Plasma catalytic degradation is a method of reaction under ambient temperature and pressure, but the discharge phenomenon during the reaction process may produce risks to its practical application.8 Moreover, it is not suitable for a rapid removal of high concentration pollutants. Catalytic combustion is an efficient toluene treatment process, but it requires a large amount of energy consumption,6 which causes higher costs.O3 is a highly effective oxidant without harmful by-products. However, the sole ozone oxidation has limited catalytic degradation capabilities.10–12 Catalytic ozonation process can rapidly decompose O3 into reactive oxygen species (ROS) with a higher oxidizing ability (e.g., hydroxyl radicals, superoxide radicals, and so on) by the action of a catalyst at ambient temperature and pressure.13 In addition, catalytic ozonation process also has the advantages of low operating cost, no secondary pollution, and low safety hazards. Therefore, catalytic ozonation process has received increasing attention and has been applied to control gaseous pollution in recent years. Kwong and Chao compared the effects of different zeolites and MCM-41 materials to remove toluene in catalytic ozonation process.14 They found that the decomposition process of ozone was divided into two processes: adsorbed on the catalyst surface, and then decomposed into oxygen or active substances. Park et al. applied mesoporous Mn/Al2O3 catalyst to the process of catalyzing ozonation to degrade toluene at ambient temperature. The results indicated that some properties in metal oxides were essential to improve catalytic activity.15 However, in the field of degrading VOC, catalyst research for catalytic ozonation is not optimistic. Most catalysts do not achieve the desired removal efficiency (less than 80%) at ambient temperatures.
For the catalytic ozonation process, it is especial to develop catalysts with higher activity and fewer by-products. For instance, mono or mixed metal oxides, supported metals and metal-free materials have been reported to be effective catalysts in accelerating ozone decomposition to generate reactive radicals. Recently, nanoscale ferrites (AFe2O4 (A = Zn, Co, Mn, Cu)) have received particular attention due to their low synthesis cost and better recyclability. Not only that, due to the diversity of elements and valence states in AFe2O4, surface defects are easily formed, making AFe2O4 have good catalytic activity. This will also greatly reduce the operating costs of catalytic degradation of pollutants. Such properties have demonstrated that they had good application prospects in environmental pollution control field.16 Studies have confirmed that spinel ferrite had good catalytic activity in the ozonation of various pollutants. Therefore, AFe2O4 can be used as excellent ozonation catalysts for catalytic ozonation. Supported catalysts can improve the adsorption capacity and service life of the catalyst. In recent years, a variety of supports have been applied in the catalytic ozonation process. Catalytic ozonation is assumed to take place not only in the gaseous phase, but also on all the interfaces involved between the different phases. The adsorption of at least one reagent turns out to be an essential requirement for the surface reaction and the formation of ROS. Although there is no unified statement about the reaction mechanism's participation in the catalytic ozonation reaction, γ-Al2O3 is still one of the most commonly used catalyst supports in the research of catalytic ozonation due to its large surface area, low cost and modest chemical activity.17
Herein, the mesoporous alumina-supported AFe2O4 (AFe2O4/γ-Al2O3) were facilely synthesized by the hydrothermal reaction. The microstructure, morphology and composition of synthesized AFe2O4/γ-Al2O3 catalysts were investigated by a scanning electron microscope (SEM), Brunauer–Emmett–Teller (BET), X-ray diffraction (XRD), X-ray photoelectron spectroscopy (XPS). The active sites of the catalyst surface were studied by electron paramagnetic resonance (EPR) and pyridine-FTIR (Py-IR). Toluene, commonly found in both residential and industrial processes, was selected as model pollutant to evaluate the catalytic activity of AFe2O4/γ-Al2O3 catalysts at ambient temperature, and the optimal catalyst was selected for the reaction mechanism. A Fourier infrared spectrometer (FT-IR) and EPR were used to investigate the generation of the catalyst's surface-active factors and changes in adsorbed species during the reaction. Finally, the degradation intermediates were detected by GC-MS in the reaction process and the degradation pathway of toluene was summarized. To the best of the authors' knowledge, AFe2O4/γ-Al2O3 has not been reported as catalysts for removal of toluene in catalytic ozonation process.
Experimental section
Preparation of AFe2O4/γ-Al2O3 catalysts
A schematic illustration of the synthesis of AFe2O4/γ-Al2O3 is shown in Fig. S1.† The purchased mesoporous γ-Al2O3, at a size of 2–3 mm, washed with deionized water and dried in a constant temperature drying oven. A mixed solution of 0.1 mol L−1 Fe(NO3)3 and 0.05 mol L−1 A(NO3)x was disposed. The pH of the solution was adjusted to 12–13 with an NaOH solution. Stirring continued for 30 min to completely precipitate the metal ions and obtain a reddish-brown precipitate. 200 g of the pre-treated γ-Al2O3 support was weighed into the mixed solution ultrasonically for 15 min at 300 W power. The mixture was placed in a 200 mL stainless steel autoclave lined with polytetrafluoroethylene, heated at 180 °C for 6 h, cooled and rinsed with deionized water. The product was air-dried at 80 °C for 6 h to obtain the AFe2O4/γ-Al2O3 catalysts. The mixed solution of 0.1 mol L−1 Fe(NO3)3 and 0.05 mol L−1 A(NO3)x was replaced with 0.1 mol L−1 Fe(NO3)3 solution and the above operation was repeated, the Fe2O3/γ-Al2O3 catalyst was obtained used as a control group for the AFe2O4/γ-Al2O3 catalysts in subsequent studies.Characterization
The surface morphology was examined using a scanning electron microscope (NOVA Nano SEM 450) equipped with an energy dispersive X-ray spectroscopy (EDS) detector. The specific surface area (BET) was estimated from the N2 adsorption/desorption isotherm at −196 °C by using a Quantachrome SI gas sorption analyser. XRD is mainly used for the analysis of the crystal structure of materials. The test instrument model was Rigaku D/MAX-2400 powder diffractometer, using nickel-filtered copper radiation (CuKα, λ = 1.5406 Å) as a monochromatic, monochromatic detector was 40 kV, and at 2θ range of 10–80°, respectively. XPS is used to characterize the surface element content of the material and its presence. The test instrument was Thermo Scientific's ESCALAB 250 device, and the device used an Al-Kα target (photon energy of 1486.6 eV). The obtained spectrum was corrected by using the signal for the carbon peak (C 1s) at 284.5 eV. Acidity properties was investigated by Py-FTIR using a Thermo Nicolet 380 FT-IR analyzer under vacuum. EPR spectroscopy was measured at ambient temperature by Bruker ELEXSYS E500 X-band (∼9.8 GHz) spectrometer. FTIR spectra were obtained by using a spectrometer (EQUINOX55) at a 4 cm−1 resolution with scanning from 4000 to 400 cm−1.Evaluation of catalytic activity
The schematic diagram of the experimental apparatus for catalytic ozonation toluene is shown in Fig. 1. The entire device included an intake system, a reaction system, and an analysis and detection system. First, the toluene and oxygen required for the reaction were supplied from the cylinder; subsequently, oxygen was partially converted into O3 by the O3 generator and entered the reaction column together with the preheated toluene. During the reaction process, the toluene concentration, mass flow controller, and toluene preheating system were adjusted to control the toluene concentration, space velocity, and reaction temperature. The O3 concentration was detected by O3 concentration detectors at the inlet and outlet ends. Finally, the toluene concentration was monitored continually by gas chromatography (SHIMADZU GC-2010), and the toluene degradation rate was calculated by eqn (1):| Toluene degradation rate = 100% × (Cin − Cout)/Cin | (1) |
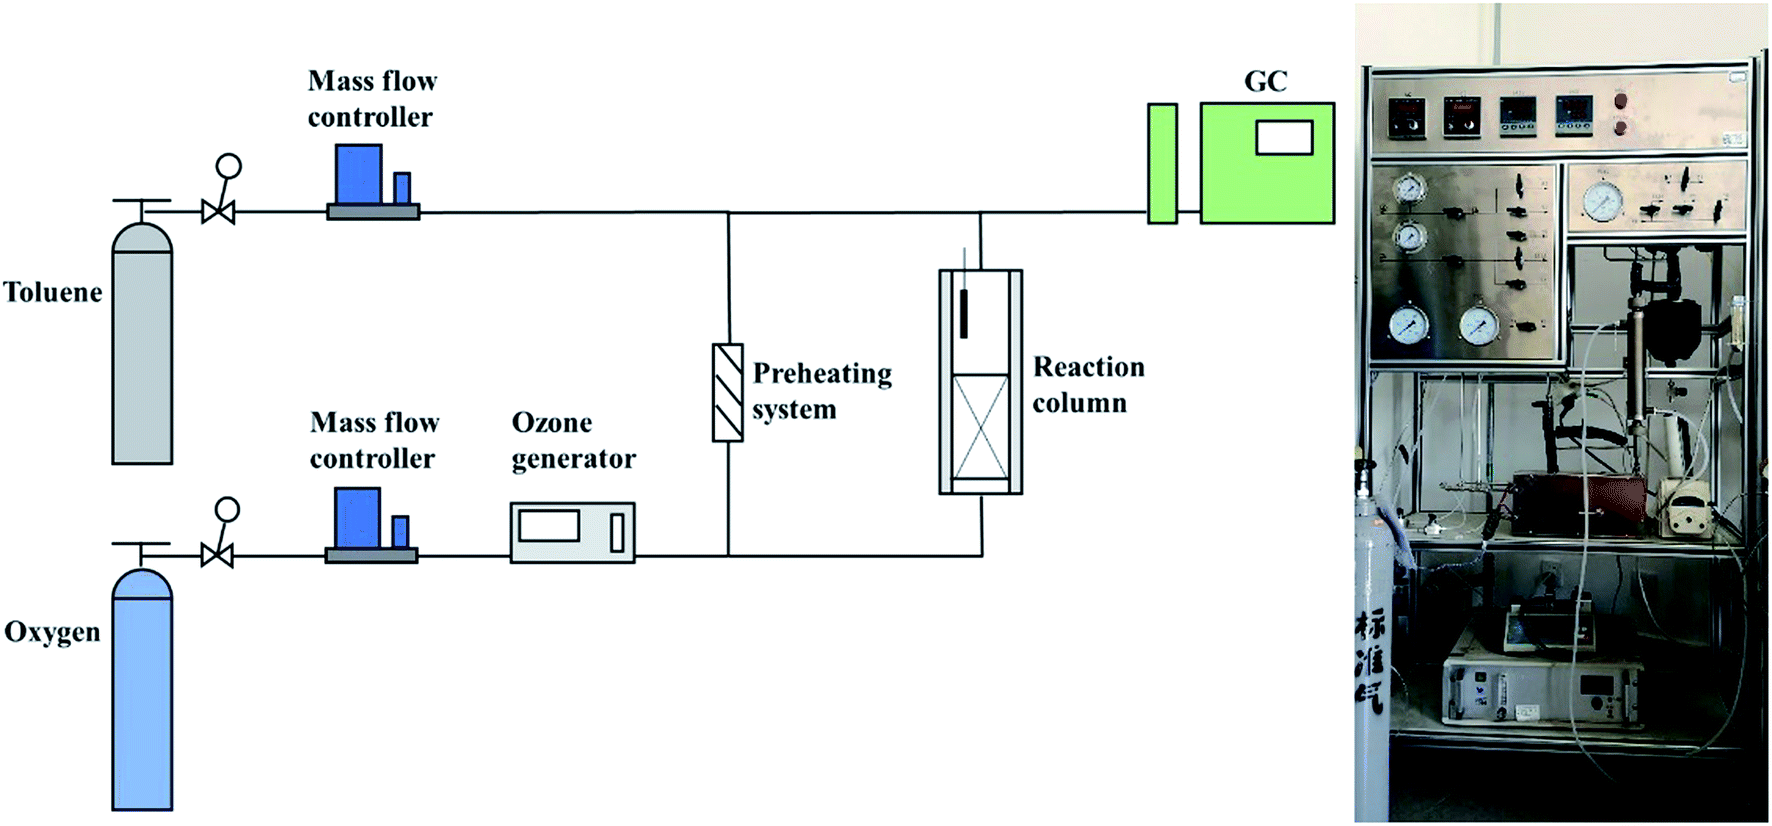 | ||
| Fig. 1 Experimental setup for toluene catalytic ozonation. | ||
All data provided herein were averages obtained from three replicate experiment.
Results and discussion
Catalysts characterization
The surface morphologies of the support and the catalyst were observed using the scanning electron microscope (SEM). As shown in Fig. 2a, γ-Al2O3, which was used as the support, was porous with an irregular surface. In Fig. 2b–e, after the hydrothermal reaction, many rod-shaped nanoparticles appeared uniformly in the pores of γ-Al2O3. This structure was very similar to the rod-shaped ferrites particles.18 The EDS element analysis in Fig. S2† showed that AFe2O4/γ-Al2O3 catalysts had relatively homogeneous distributions of Fe and other elements, and no contaminated elements were detected. The elemental compositions of Fe and other elements via EDS analysis confirmed that the atomic percentage of Fe and other elements was close to 2![[thin space (1/6-em)]](https://www.rsc.org/images/entities/char_2009.gif) :1, which was consistent with the atomic composition of ferrite.
:1, which was consistent with the atomic composition of ferrite.
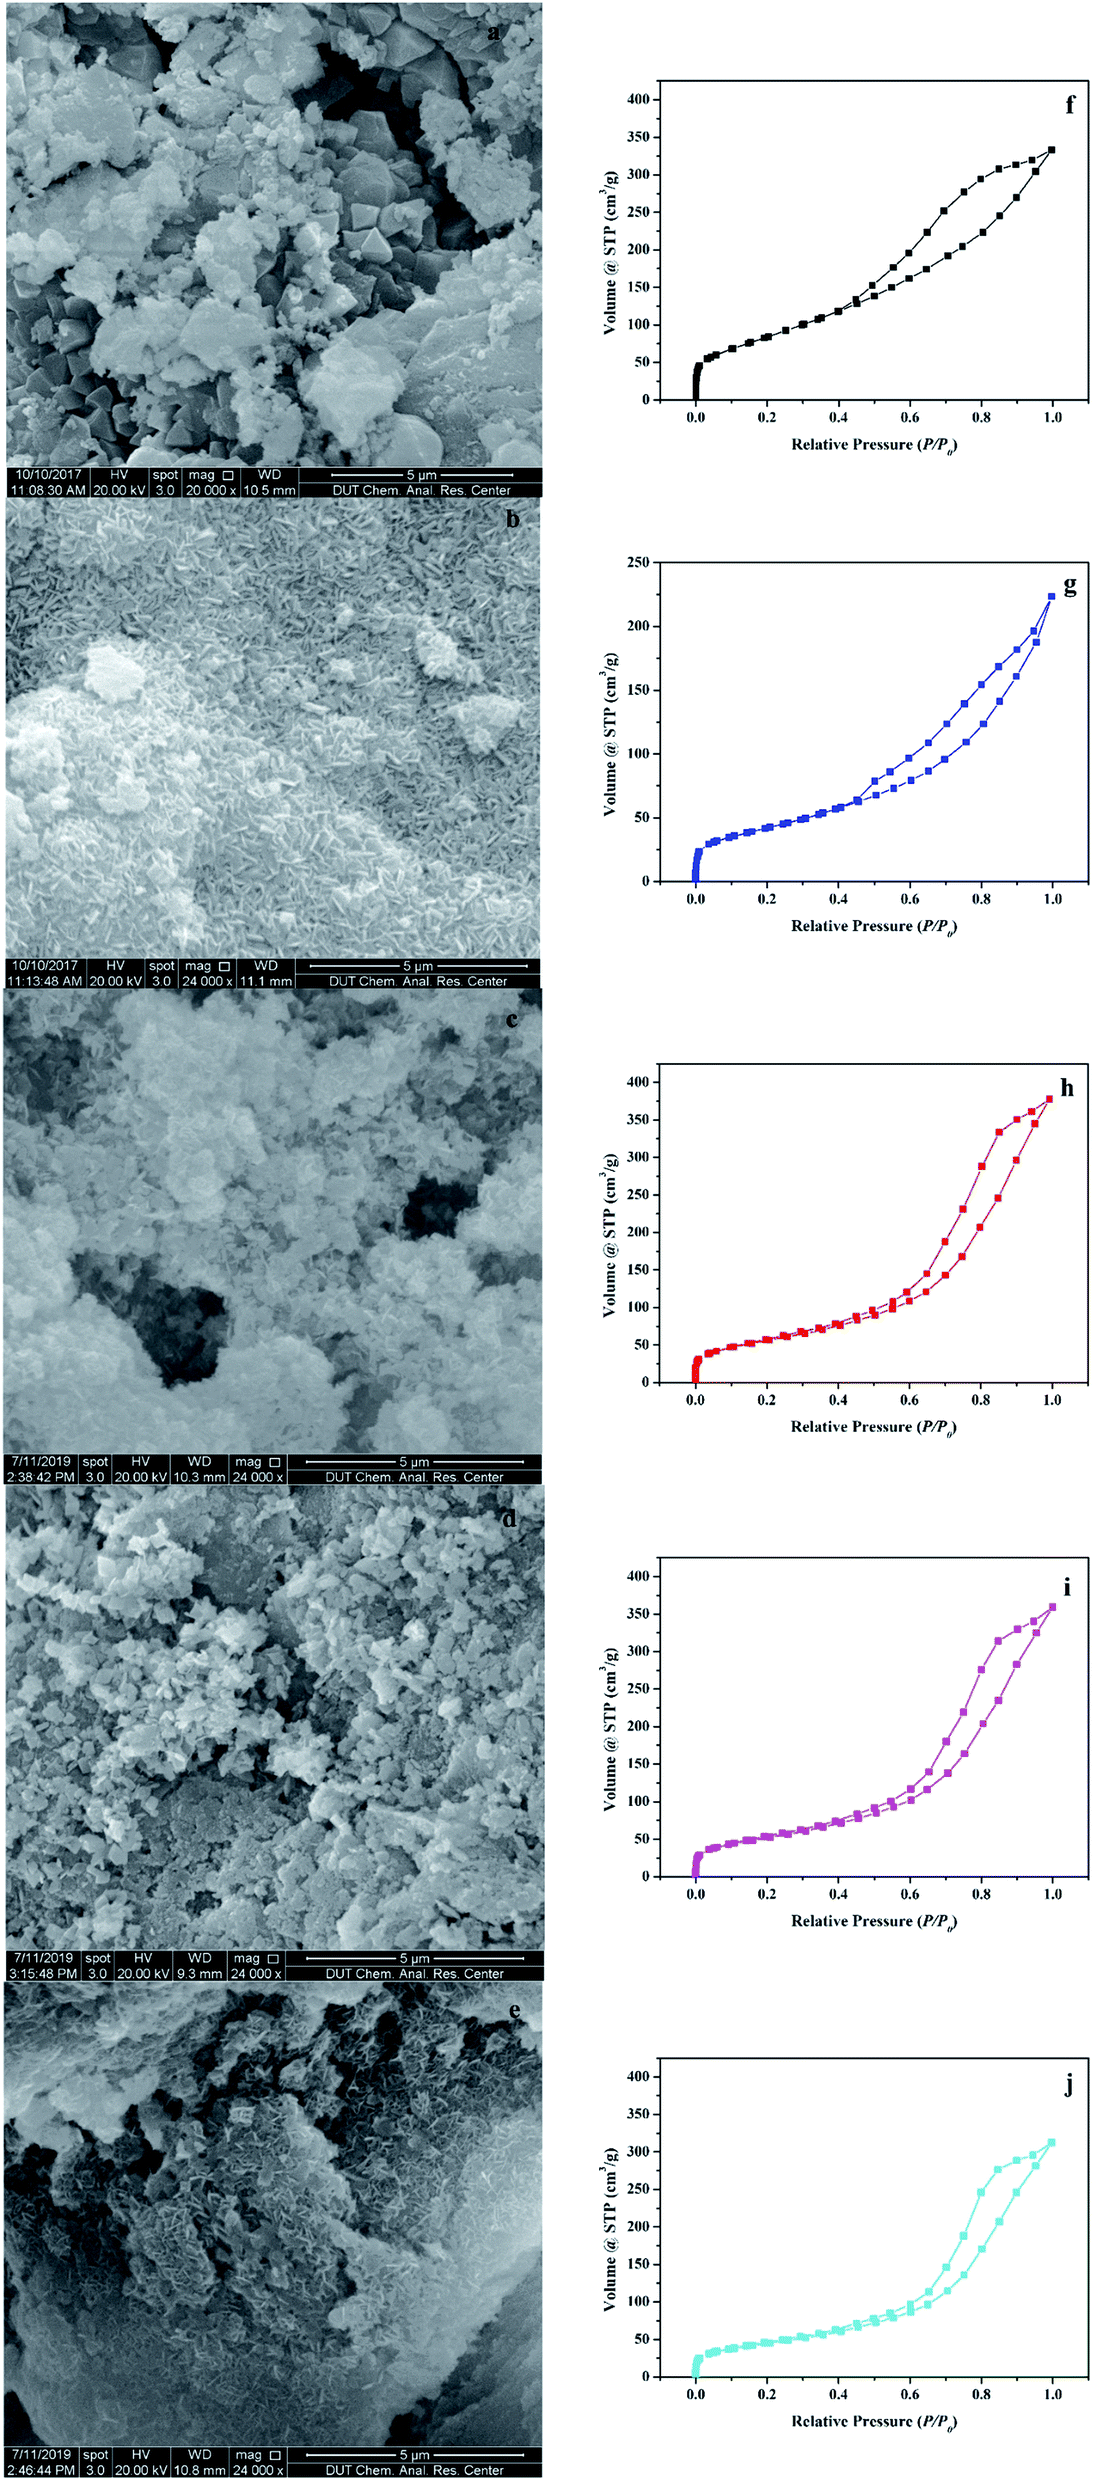 | ||
| Fig. 2 SEM images of (a) γ-Al2O3, (b) ZnFe2O4/γ-Al2O3, (c) CoFe2O4/γ-Al2O3, (d) MnFe2O4/γ-Al2O3, and (e) CuFe2O4/γ-Al2O3, BET of (f) γ-Al2O3, (g) ZnFe2O4/γ-Al2O3, (h) CoFe2O4/γ-Al2O3, (i) MnFe2O4/γ-Al2O3, and (j) CuFe2O4/γ-Al2O3, respectively. | ||
Fig. 2f–j illustrated the characterization of BET and Fig. S3–S7† showed the pore size distribution. In the characterization of BET, all samples showed an isotherm belonging to the mesoporous structure (type IV of the hysteresis loop of H3).19 The hysteresis loop of γ-Al2O3 described a wide morphology in the range of 0.40–1.00 relative pressure (P/P0), while shrinks of AFe2O4/γ-Al2O3 catalysts were slightly smaller, denoting less structure. This conclusion was consistent with the phenomenon that the pore volume of γ-Al2O3 in Table S1† was reduced after loading. We can also observe that in Table S1,† compared with the γ-Al2O3, the specific surface area of AFe2O4/γ-Al2O3 catalysts was slightly lower and the average pore diameter was slightly higher. This was mainly due to the nano-ferrite particles entering the mesoporous γ-Al2O3 pores in the hydrothermal reaction, which caused partial pore plugging, and thereby the specific surface area and pore volume of the γ-Al2O3 after the load were reduced. This indicated that nano-ferrite particles were successfully loaded onto the mesoporous γ-Al2O3. At the same time, because the nano-ferrite particles blocked a part of the micropores, the average pore diameter of the mesoporous γ-Al2O3 after loading slightly increased. Among these AFe2O4/γ-Al2O3 catalysts, the ZnFe2O4/γ-Al2O3 catalyst had a large specific surface area, and it was estimated that it had a good ability in the field of adsorption and catalysis.
XRD was used to investigate the crystalline structure of the γ-Al2O3 support, Fe2O3/γ-Al2O3 catalyst and AFe2O4/γ-Al2O3 catalysts. As seen from Fig. 3, the three main characteristic peaks located ca. 35.60, 45.80 and 67.00 were observed for the γ-Al2O3, which may be primarily due to the crystalline phase of γ-Al2O3.20 In spectra (e), the signal peaks at 30.28, 43.16, and 57.16 were characteristic peaks belonging to Fe2O3/γ-Al2O3. The XRD pattern of AFe2O4/γ-Al2O3 catalysts showed several characteristic diffraction peaks attributed to the (111), (200), (220), (311), (222), (400), (331), (420), (422) crystalline phase of the cubic fluorite structure. And the XRD pattern of AFe2O4/γ-Al2O3 catalysts indicated characteristic peaks, including γ-Al2O3 and ferrite. These results indicated that the high-purity ferrite was loaded on the γ-Al2O3 support successfully via hydrothermal synthesis.
 | ||
| Fig. 3 XRD pattern of (a) ZnFe2O4/γ-Al2O3, (b) CoFe2O4/γ-Al2O3, (c) MnFe2O4/γ-Al2O3, (d) CuFe2O4/γ-Al2O3, (e) Fe2O3/γ-Al2O3 and (f) γ-Al2O3. | ||
Further, we studied the composition of the catalyst surface chemical, XPS measurement was performed. As shown in Fig. S8a,† the presence of Zn at 1044.9 and 1022.5 eV can be attributed to Zn 2p1/2 and Zn 2p3/2 of Zn2+ in ZnFe2O4, respectively. Fig. S8b† exhibits two peaks of 779.2 eV and 794.9 eV to binding energy of Mn 2p3/2 and Mn 2p1/2 respectively. Two characteristic peaks in Fig. S8c† centred ca. 641.8 and 651.4 eV, respectively, are attributed to Mn 2p3/2 and Mn 2p1/2. In the Fig. S8d,† the BE of Cu 2p photoelectron peak was observed at 953.3 eV and 933.4 eV represented Cu 2p1/2 and Cu 2p3/2, respectively.21,22 This again proved that the high-purity ferrite can be supported on γ-Al2O3 by the hydrothermal method of this study, consistent with the results of XRD.
Fig. 4a shows the Fe 2p spectra of Fe2O3/γ-Al2O3 catalyst and AFe2O4/γ-Al2O3 catalysts. In the spectra of Fe2O3/γ-Al2O3 catalyst, the characteristic peaks of Fe 2p3/2 and Fe 2p1/2 were located at 711.5 eV and 724.9 eV, respectively, which was consistent with the XPS spectra of Fe2O3 reported in the literature.23 There was a tiny satellite peak around 720 eV, which was also a typical feature of Fe2O3. As the spectra of AFe2O4/γ-Al2O3 catalysts, there were some changes in the positions of Fe 2p3/2 and Fe 2p1/2 in different catalysts. It shows that there was electron exchange between Fe and other elements in the catalyst.24 Combined with Table 1, the XPS results of AFe2O4/γ-Al2O3 catalysts were displayed that Fe/A ≈ 2 was similar to the EDS result. The Fe 2p3/2 peak was deconvoluted into two peaks with binding energies at 709 and 713 eV, corresponding to Fe2+ and Fe3+, respectively,25,26 whose ratios are summarized in Table 1. The ZnFe2O4/γ-Al2O3 catalyst had a relatively high proportion of Fe2+ on its surface. The proportion of the low-valent state of the modifying element in the transition metal oxide is closely related to the generation of Ovs.27 In this study, the change of the iron element from Fe3+ to Fe2+ indirectly represented the Ovs introduced into the crystal lattice. The Ovs on the surface of the catalyst can promote the decomposition of O3 to produce more oxidizing active substances.28
 | ||
| Fig. 4 XPS spectra of AFe2O4/γ-Al2O3 catalysts, (a) Fe 2p of Fe2O3/γ-Al2O3 catalyst and AFe2O4/γ-Al2O3 catalysts; (b) O 1s of γ-Al2O3, Fe2O4/γ-Al2O3 catalyst and AFe2O4/γ-Al2O3 catalysts. | ||
| O (%) | Fe (%) | A (%) | Fe2+/(Fe2+ + Fe3+) (%) | Oα/(Oα + Oβ) (%) | |
|---|---|---|---|---|---|
| ZnFe2O4/γ-Al2O3 catalyst | 46.57 | 0.88 | 0.43 | 70.2 | 52.5 |
| CoFe2O4/γ-Al2O3 catalyst | 46.83 | 0.83 | 0.43 | 52.1 | 37.6 |
| MnFe2O4/γ-Al2O3 catalyst | 47.64 | 0.39 | 0.22 | 44.8 | 34.1 |
| CuFe2O4/γ-Al2O3 catalyst | 47.37 | 0.42 | 0.18 | 47.6 | 36.9 |
| Fe2O3/γ-Al2O3 catalyst | 47.14 | 1.32 | 35.8 | ||
| γ-Al2O3 | 55.94 | 36.2 |
The corresponding O 1s spectrum of γ-Al2O3 and AFe2O4/γ-Al2O3 catalysts in Fig. 4b can be deconvoluted into two distinct peaks: surface oxygen (expressed as Oα) at 528.4–530.5 eV, and lattice oxygen (expressed as Oβ) at 526.7–527.9 eV, respectively.29,30 Combined with Table 1, we observed that the proportion of Oα in the ZnFe2O4/γ-Al2O3 catalyst, the CoFe2O4/γ-Al2O3 catalyst and the CuFe2O4/γ-Al2O3 catalyst were increased compared to γ-Al2O3, while the ZnFe2O4/γ-Al2O3 catalyst was the most. Since Oα was provided by an electrostatically charged substance such as H2O, ·OH on surface of the catalyst, the higher the proportion of Oα in the oxygen element distribution, the stronger the adsorption performance of the catalyst on the O3.31 In the gas phase catalytic ozonation reaction, a high adsorption capacity for O3 was a guarantee of high catalytic efficiency. This indicated that the adsorption capacity of γ-Al2O3 for O3 was improved by addition of ZnFe2O4, which provided a foundation for improving the catalytic efficiency.
In order to further determine the type and amount of AFe2O4/γ-Al2O3 catalysts surface active sites, we carried out EPR and pyridine infrared tests on γ-Al2O3 and AFe2O4/γ-Al2O3 catalysts without illumination. From Fig. 5a, we observed that all samples had obvious signal peaks belonging to Ovs at g = 2.004.32 Notably, the signal intensity of the γ-Al2O3 was significantly lower than that of ZnFe2O4/γ-Al2O3 catalyst, the CoFe2O4/γ-Al2O3 catalyst and the CuFe2O4/γ-Al2O3 catalyst. It showed that the amount of Ovs on the surface of these catalysts was higher than that of alumina carriers, which was consistent with our speculation through XPS results. This indicated that the introduction of suitable ferrite could increase the amount of Ovs on the γ-Al2O3 surface.
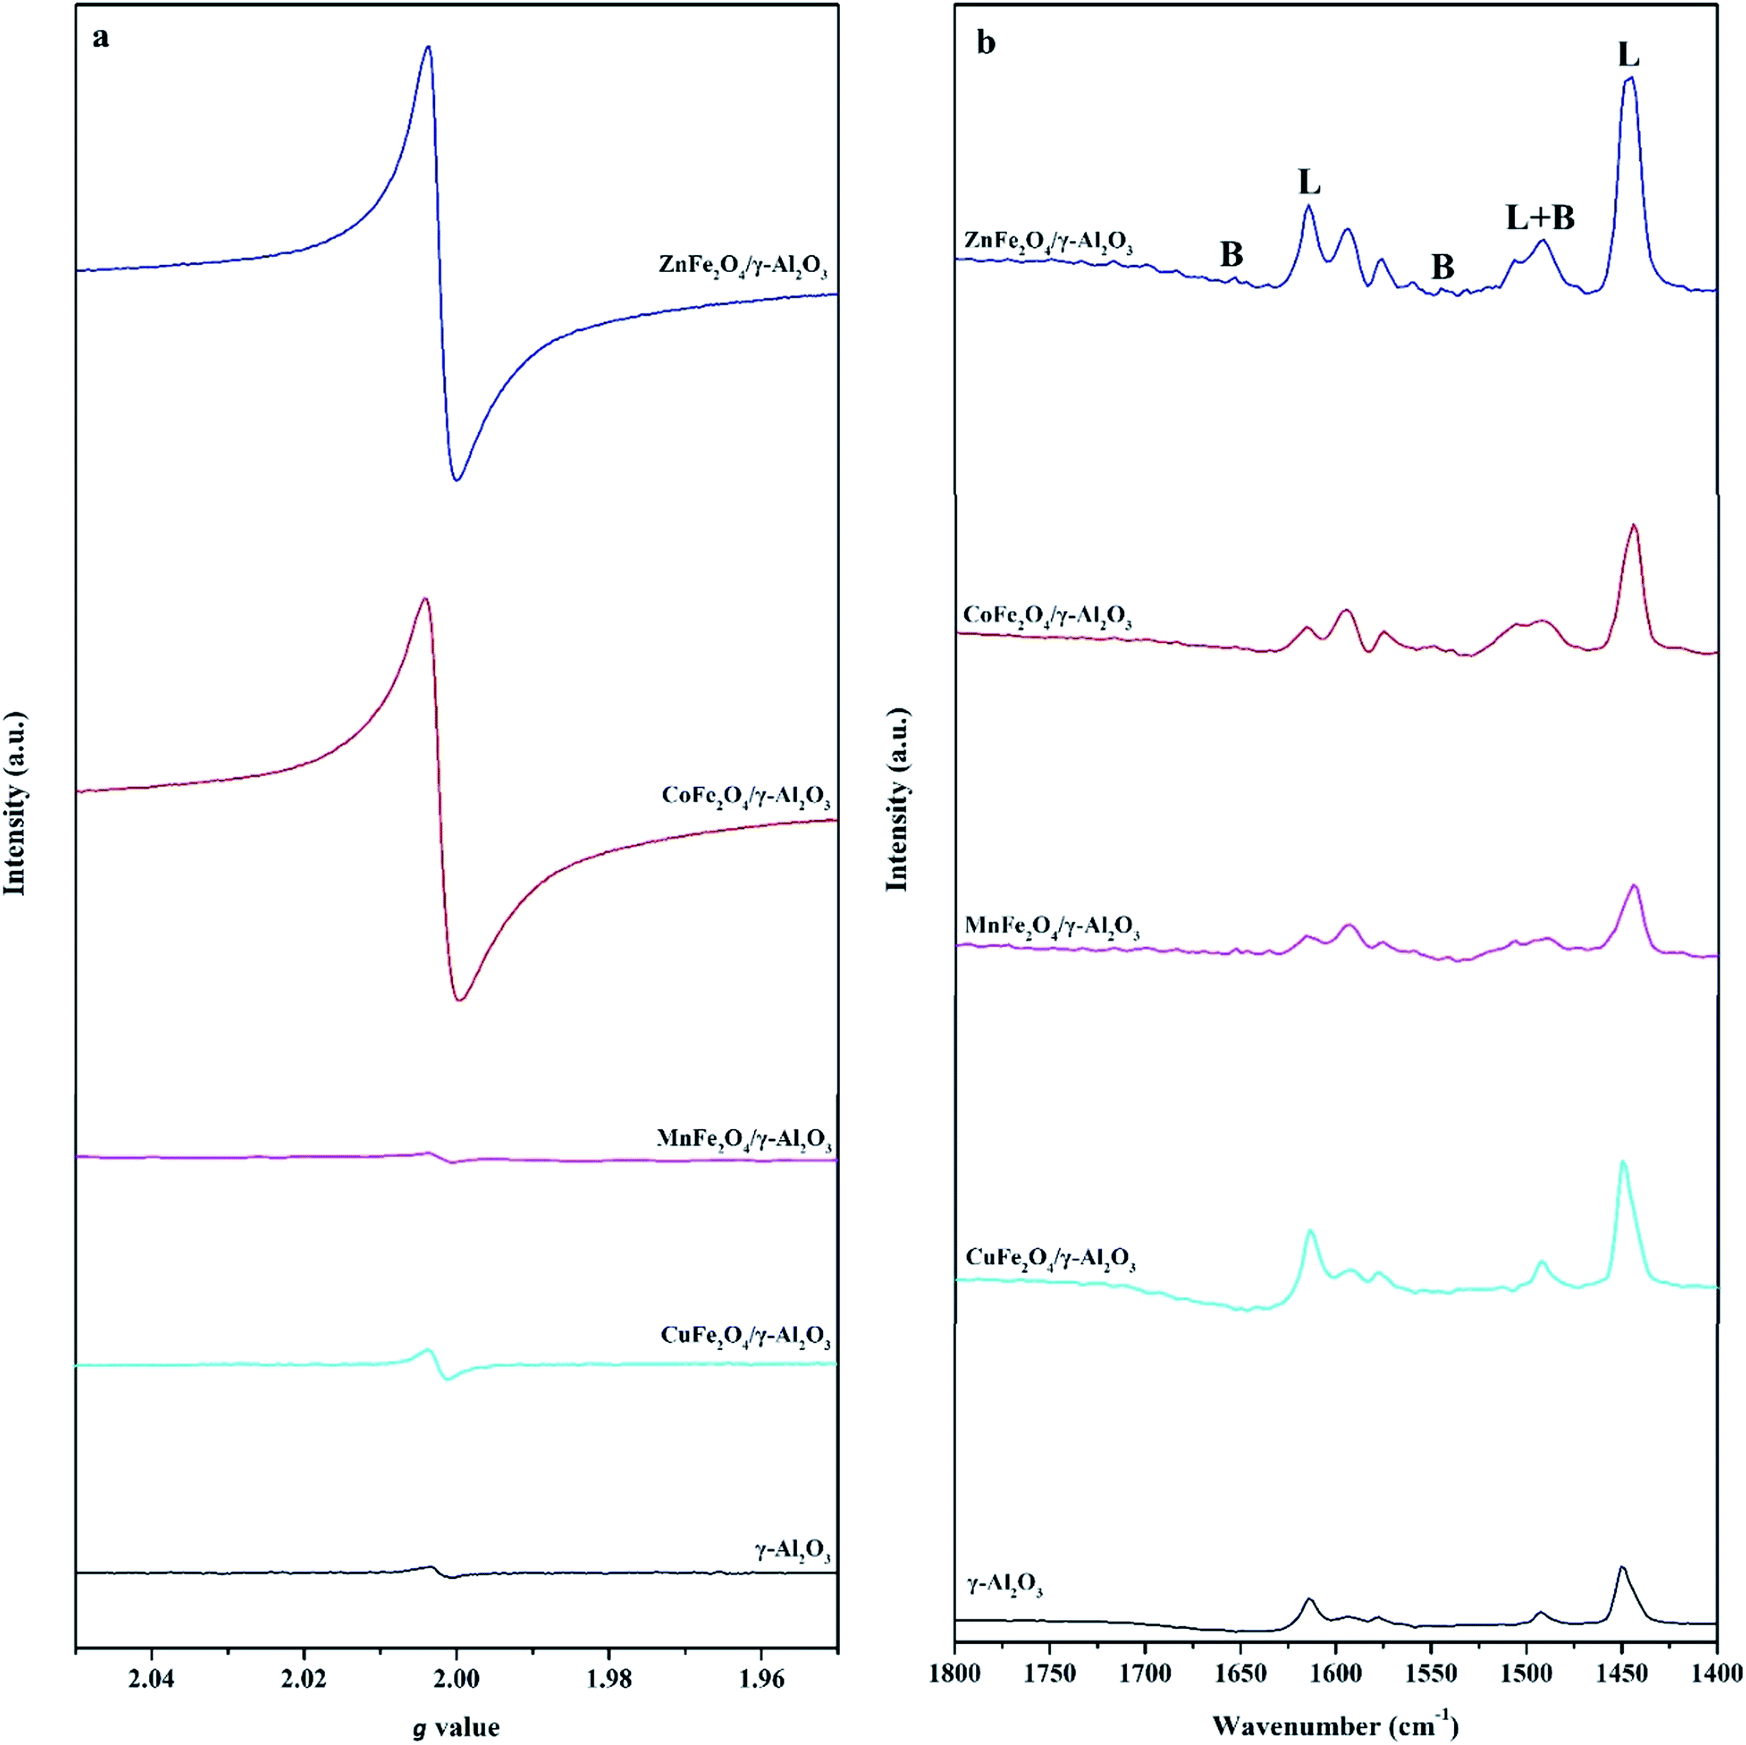 | ||
| Fig. 5 (a) The EPR spectra of γ-Al2O3 and AFe2O4/γ-Al2O3 catalysts; (b) Py-FTIR spectra of γ-Al2O3 and AFe2O4/γ-Al2O3 catalysts after pyridine desorbed at 150 °C. | ||
In the Py-FTIR test, we used the signal intensity of pyridine at 150 °C to measure the amount of LAS and BAS on the surfaces of γ-Al2O3 and AFe2O4/γ-Al2O3 catalysts. Fig. 5b clearly showed that both the amount of LAS and BAS had a certain degree of change after loading. 1630 and 1546 cm−1 were the desorption peaks after pyridine was adsorbed to BAS; 1612 and 1458 cm−1 were the desorption peaks after pyridine was adsorbed to LAS; 1490 cm−1 was pyridine adsorbed simultaneously at BAS and LAS desorption peak.33 The amount and proportional relationship of each acidic site were summarized in Table S2.† Among all the samples, the ZnFe2O4/γ-Al2O3 catalyst showed the strongest L acidity and B acidity. Compared with γ-Al2O3, the acidity of other catalysts decreased, which may be due to the fact that the elements (such as Co, Mn and Cu) were more easily ion exchanged with protons in γ-Al2O3, so that the original acidic sites of γ-Al2O3 were consumed.34 Previous studies have confirmed that both LAS and BAS had an adsorption effect on weakly basic aromatic hydrocarbon VOCs molecules such as toluene.35 Therefore, the adsorption capacity of the catalyst increased with the increase of the total amount of acidic sites. From this we could speculate that the ZnFe2O4/γ-Al2O3 catalyst had the best toluene adsorption capacity of all AFe2O4/γ-Al2O3 catalysts involved in this study.
Catalytic ozonation for toluene degradation and life cycle of catalyst
In order to further study the catalytic performance of the catalyst in the catalytic ozonation degradation of toluene, adsorption and degradation experiments on toluene were carried out at a concentration of 600 mg m−3. The experimental conditions were as follows: temperature 303 K and space velocity 2000 h−1. As illustrated in Fig. 6a, the adsorption capacities of the γ-Al2O3 and AFe2O4/γ-Al2O3 catalysts for toluene were investigated when the O3 concentration was 0 mg L−1. All samples had relatively stable adsorptions to toluene, and the optimal adsorption efficiency was maintained above 6 h. The adsorption capacity of the ZnFe2O4/γ-Al2O3 catalyst was slightly better than γ-Al2O3 and other samples, which was consistent with the conclusion that the acidic site of the ZnFe2O4/γ-Al2O3 catalyst was higher and its adsorption capacity was better. The results confirmed that the ZnFe2O4/γ-Al2O3 catalyst had a high toluene adsorption capacity, and the toluene removal rate was only approximately 40%. Fig. 6b showed that the toluene removal efficiency of γ-Al2O3 and AFe2O4/γ-Al2O3 catalysts system increased significantly after the addition of O3 and became larger with the increase in O3 dosage. Among them, the toluene removal efficiency of the ZnFe2O4/γ-Al2O3 catalyst system exceeded 95% at most. However, despite the introduction of O3, in the absence of any catalyst addition, the removal efficiency was still relatively low, and even lower than the removal efficiency of the catalyst adsorption. This result demonstrated that with the reaction conditions, O3 did not have the ability to remove toluene efficiently. In summarizing these conclusions, we may deduce that the removal of the high concentration toluene by catalytic ozonation was a combination of adsorption and catalytic oxidation, rather than a separate adsorption or sole ozonation. The introduction of a suitable catalyst may effectively increase the efficiency of catalytic ozonation to remove toluene. The ZnFe2O4/γ-Al2O3 catalyst had a better adsorption capacity and better application prospects for catalytic ozonation.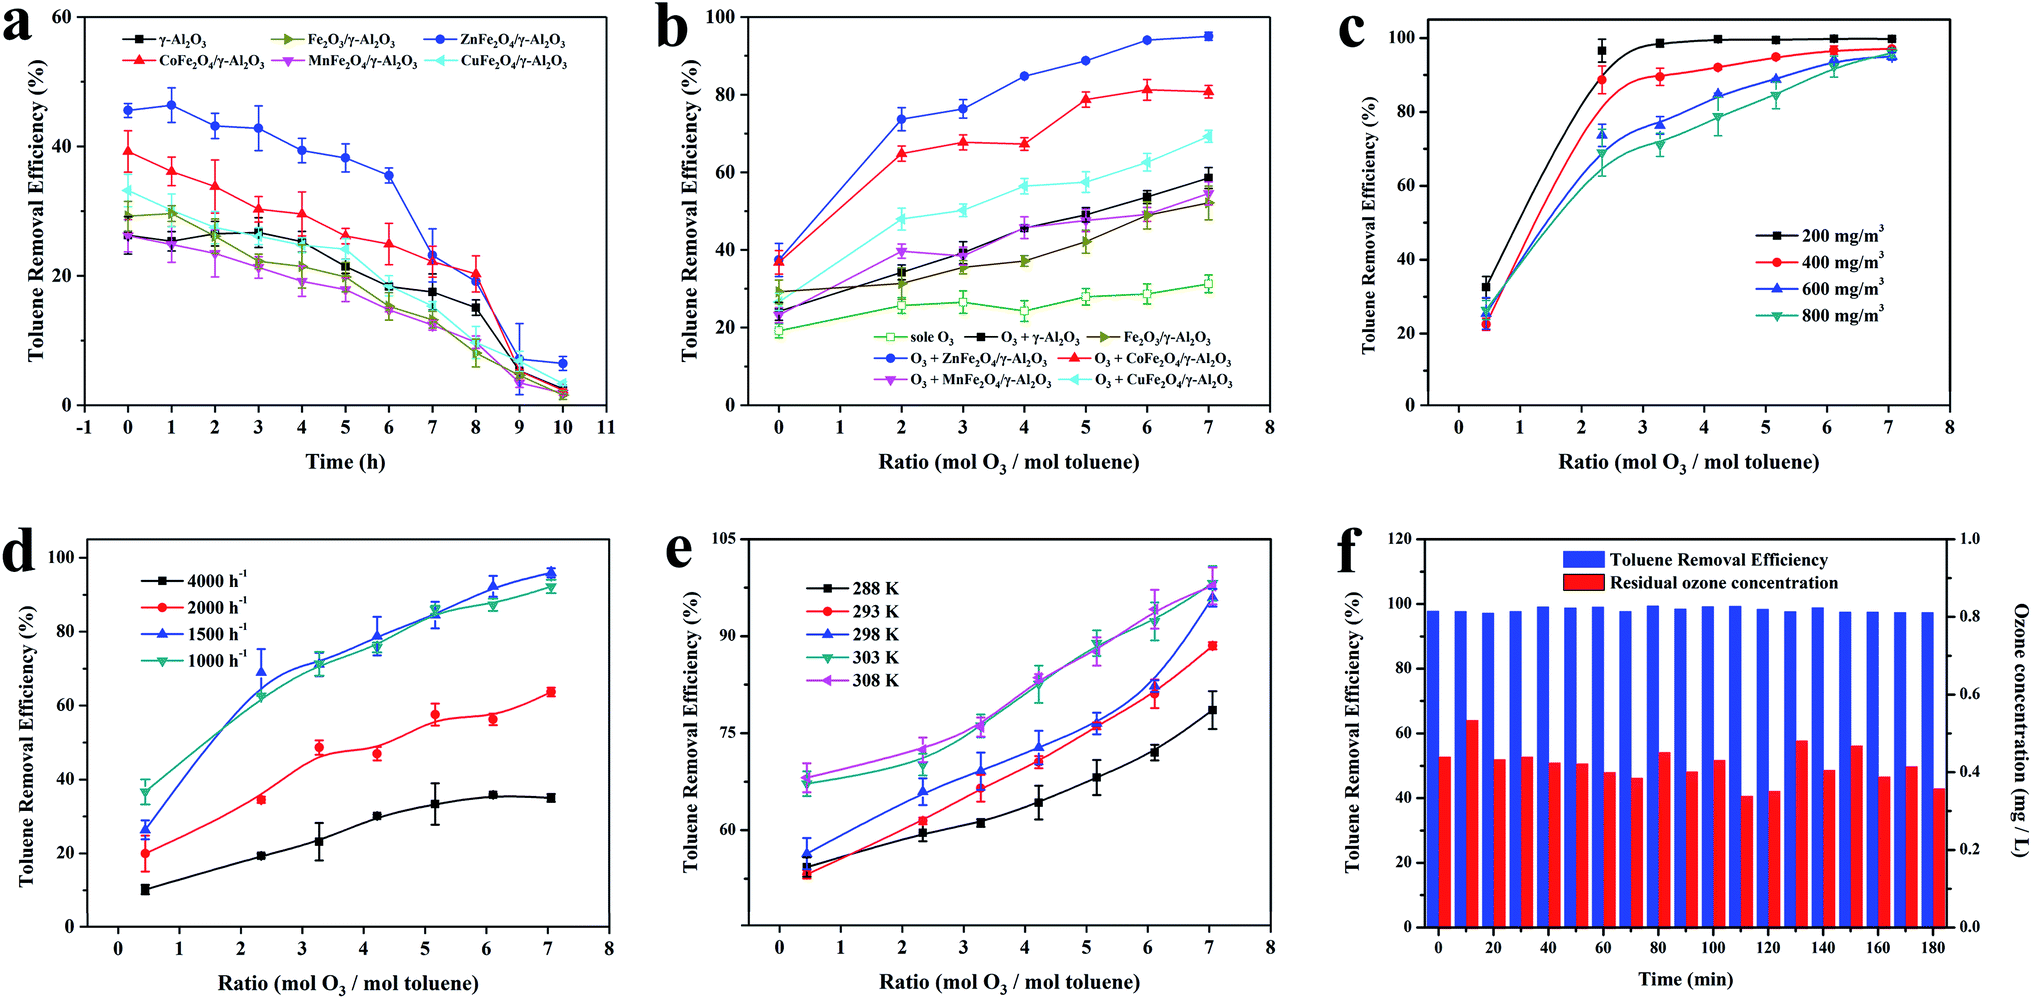 | ||
| Fig. 6 (a) Adsorption efficiency of γ-Al2O3, Fe2O3/γ-Al2O3 catalyst and AFe2O4/γ-Al2O3 catalysts; (b) catalytic efficiency of γ-Al2O3, Fe2O3/γ-Al2O3 catalyst and AFe2O4/γ-Al2O3 catalysts; (c) removal of toluene at different initial toluene concentrations with ZnFe2O4/γ-Al2O3 catalyst; (d) removal of toluene at different space velocities with ZnFe2O4/γ-Al2O3 catalyst; (e) removal of toluene at different reaction temperatures with ZnFe2O4/γ-Al2O3 catalyst and (f) the variation law of toluene degradation rate in long-term test with ZnFe2O4/γ-Al2O3 catalyst. | ||
To determine the oxidation kinetics of toluene in each process, the kinetic parameters of the oxidation process were investigated (the experimental conditions were as follows: temperature 293 K, space velocity 2000 h−1, initial toluene concentration: 600 mg m−3). Zero-order and pseudo first-order equations were used for fitting dynamic data.36 Table S3† shows the fitting results of the toluene oxidation kinetic data for sole O3, γ-Al2O3 and AFe2O4/γ-Al2O3 catalysts. Obviously, the correlation coefficients (R2) of pseudo first-order kinetic were higher than the zero-order kinetics. Thence, pseudo first-order kinetics accurately described toluene-catalyzed ozonation. The reaction rate k of the other samples was lower than that of the ZnFe2O4/γ-Al2O3 catalyst, which proved that the ZnFe2O4/γ-Al2O3 catalyst had a higher catalytic efficiency.
Studies have investigated that the electronegativity of lower metal oxides led to higher reducing power. The electron density of the O2− bond combined with the metal will also become higher, which is beneficial to the decomposition of ozone into free radicals, due to the electrophilic properties of ozone.37 The metallicity of Zn is higher than that of the fourth period transitional metals according to the standard redox potential order.37 This indicates that ZnFe2O4 is a material with higher catalytic ozonation activity in ferrites, and our study also have confirmed this view through experiments.
After determining that the ZnFe2O4/γ-Al2O3 catalyst was the best catalyst, we investigated the optimum reaction conditions for toluene removal by catalytic ozonation with the ZnFe2O4/γ-Al2O3 catalyst.
Because the concentration of toluene in industrial waste gas was between 200–400 mg m−3, we selected the toluene simulated waste gas with initial concentrations of 200, 400, 600 and 800 mg m−3 for experimentation. The experimental conditions were as follows: temperature 303 K and space velocity 2000 h−1. As shown in Fig. 6c, for an O3 mol dosing ratio of 2, the catalytic ozonation process had a significant removal effect on toluene concentrations from 200 mg m−3 to 800 mg m−3. For toluene with a concentration greater than 400 mg m−3, it could not be degraded efficiently when the O3 mol dosing ratio was 1; the degradation rate was less than 80%. Subsequently, we increased the amount of O3 added. Toluene at a concentration of 200 mg m−3 quickly reached a degradation rate close to 100% and remained stable. For toluene with a concentration of 400–800 mg m−3, the degradation rate showed a gradual positive correlation with the O3 mol dosing ratio. When the O3 mol dosing ratio reached 7, all concentrations achieved a high degradation rate of nearly 100%. Combined with previously published studies,11 the catalyst surface was speculated to be the site of O3 decomposition and catalytic ozonation. Therefore, when the amount of toluene was too large, more O3 was required to maintain the adsorption equilibrium on the catalysts. The experimental results also proved that the degradation rate gradually increased after the O3 dosage improved.
At temperature 303 K and a toluene concentration of 600 mg m−3, we summarized the effect of the space velocity on the catalytic reaction. The results are shown in Fig. 6d, with the same O3 mol dosing ratio, the same trend occurred in the change of the toluene degradation rate. As the space velocity decreased, the toluene degradation rate increased. At a space velocity of 4000 h−1, the degradation rate was lower at each O3 mol ratio. When the space velocity was reduced to below 1500 h−1, the toluene degradation rates no longer rose and remained stable. The reason for this experimental situation was that when the space velocity was large, the adsorption of toluene by the catalyst was limited, which limited the degradation ability of the catalytic ozonation process for toluene. When the space velocity was continuously reduced, the adsorption of toluene by the catalyst was gradually obvious, the degradation efficiency was significantly improved. The effect of the space velocity on the ability of the catalyst to adsorb toluene was also manifested when the O3 dosage was 0 in Fig. 6d. In this condition, we also found that when the space velocity dropped below 1500 h−1, the adsorption capacity of the catalyst for toluene still improved. This indicated that after the adsorption reached a certain intensity, the catalytic oxidation began to take the initiative and became the main way to remove toluene. With the same space velocity condition, the toluene degradation rate was positively correlated with the O3 mol addition ratio, showing the same regularity as the previous experiment.
The optimum temperature for the reaction was the key to the engineering application of a process. The effect of temperature on the catalytic performance of the ZnFe2O4/γ-Al2O3 catalyst to 600 mg m−3 toluene at a space velocity of 2000 h−1 is shown in Fig. 6e. When the O3 mol ratio was determined, the toluene degradation rate positively correlated with the reaction temperature. The toluene degradation rates at 303 K and 308 K were similar and higher than the other temperatures. On the other hand, with the introduction of O3, the toluene degradation rate of each O3 mol dosing ratio showed another kind of change law. From the two laws of change, the temperature affected not only the adsorption of toluene on the catalyst but also the efficiency of the catalytic ozonation. After the temperature reached 303 K, the removal efficiency of toluene greatly improved during the catalytic ozonation process.
As shown in previous studies, the catalytic ozonation reaction accords with the pseudo first-order kinetics. We kinetically fitted the removal efficiency of toluene at each temperature, and the results are shown in Fig. S9.† Combined with Table S4,† we concluded that the reaction rate k of the catalytic ozonation positively correlated with temperature and tended to be stable after the temperature reached 303 K. This was consistent with our previous conclusions. By incorporating the data in Table S4† into the Arrhenius formula, the activation energy of the catalytic ozonation toluene of the ZnFe2O4/γ-Al2O3 catalyst was calculated to be 69.94 kJ mol−1. High-quality catalysts must not only have a high catalytic efficiency but also have a long service life. In this study, a long-term comparative experiment was conducted on the catalytic efficiency and residual O3 concentration of the ZnFe2O4/γ-Al2O3 catalyst. The experimental conditions were as follows: temperature 293 K, space velocity 2000 h−1, and an initial toluene concentration 600 mg m−3.
As shown in Fig. 6f, with the reaction time prolonged, there was no significant decrease in the removal efficiency of toluene and the residual O3 concentration. In this study, the introduction of the ZnFe2O4/γ-Al2O3 catalyst greatly improved the degradation ability of catalytic ozonation system to toluene, and the system obtained a stable high toluene removal efficiency and a suitable residual O3 concentration. The ZnFe2O4/γ-Al2O3 catalyst was a catalytic ozonation process catalyst with a high efficiency and long active life.
O3 utilization efficiency
This study explored the O3 decay during the O3 and catalytic ozonation processes at different initial O3 concentrations. To guarantee that the research has certain theoretical value, this section's methods were carried out under reasonable O3 concentration conditions. According to a comprehensive published study, O3 has a mass balance in a gas phase reaction and can be expressed as shown below:| [O3]t = [O3]w + [O3]s + [O3]u | (2) |
| [O3]u = [O3]t − [O3]w − [O3]s | (3) |
According to the mass balance formula of O3 eqn (3), the O3 utilization efficiency (Ru%), which is considered as a primary indicator of catalyst performance, can be expressed as follows:
 | (4) |
 | (5) |
Since [O3]w and [O3]s exist in a gas phase state in the reaction system, [O3]s is approximately equal to [O3]w. In Table S5,† [O3]w and [O3]s in catalytic ozonation was lower than in the sole ozonation. This confirmed that more O3 was rapidly decomposed for catalytic reaction in the presence of γ-Al2O3 and the ZnFe2O4/γ-Al2O3 catalyst ozonation than sole ozonation.
The evolution of the Ru value in Fig. 7a indicated that compared with the sole ozonation and γ-Al2O3 ozonation processes, the catalytic ozonation process with the ZnFe2O4/γ-Al2O3 catalyst had a higher Ru value, during O3 concentrations of 5–20 mg L−1. On the contrary, the change trend of the η value was different. Fig. 7b clearly showed that the η value of the ZnFe2O4/γ-Al2O3 ozonation processes was lower than the sole ozonation at each O3 concentration interval, and was also slightly lower than γ-Al2O3 ozonation. This meaned that O3 can effectively decompose and produce active substances with the help of the catalyst, and the ZnFe2O4/γ-Al2O3 catalyst had a higher Ru value and a lower η value. Compared to direct O3 reaction and conventional catalytic ozonation, the degradation efficiency of toluene was greatly improved.
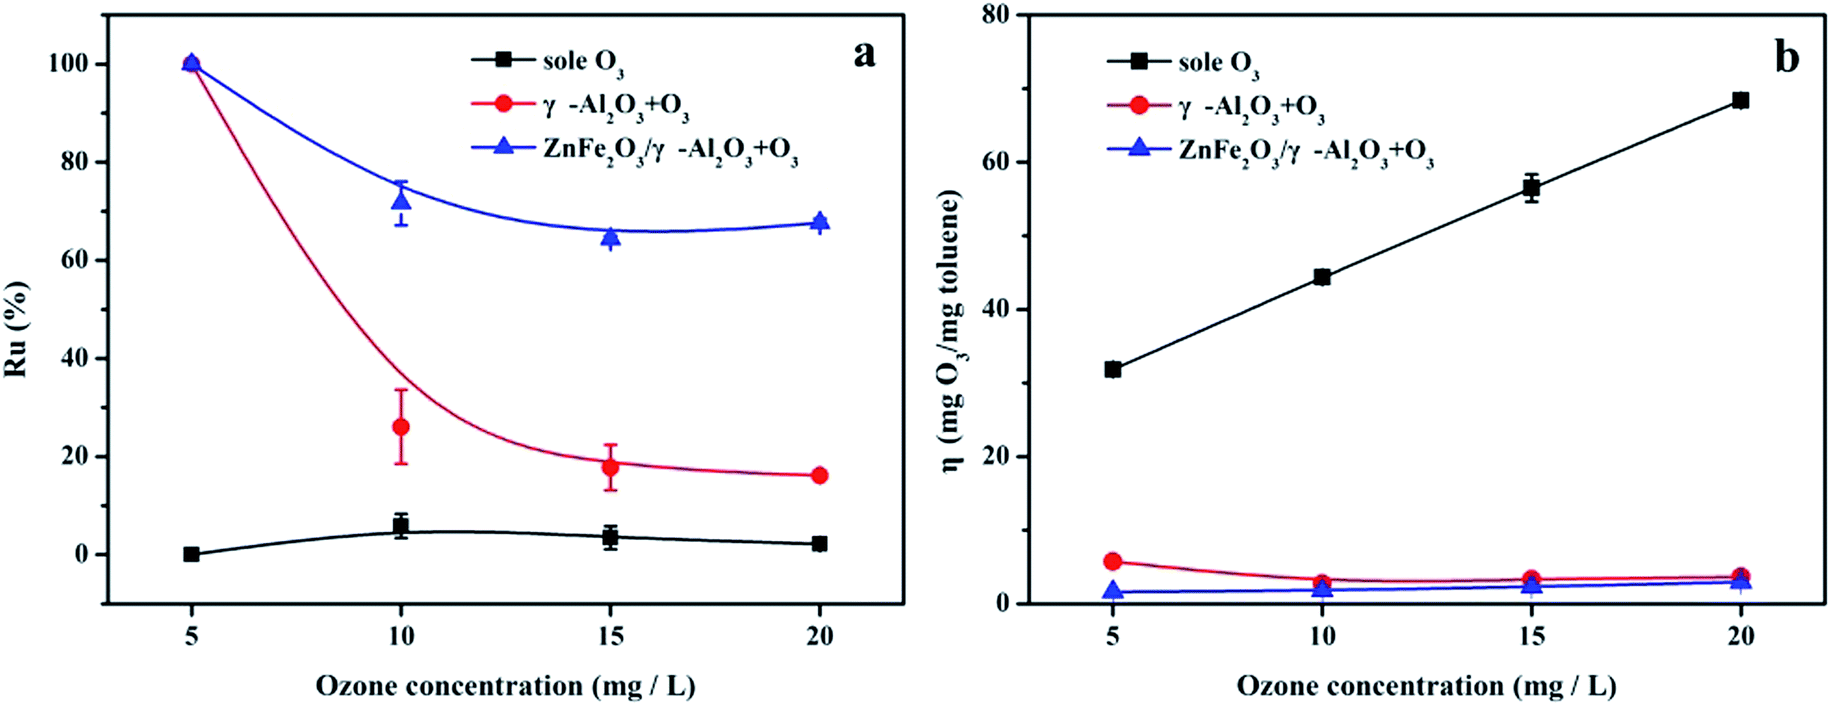 | ||
| Fig. 7 (a) Ru% in sole ozonation and catalytic ozonation processes, respectively; (b) η in sole ozonation and catalytic ozonation processes, respectively. | ||
The catalytic ozonation mechanism of toluene oxidation
Recent studies have demonstrated that Ovs was a key role in catalytic ozonation systems. First, the Ovs adsorbed O3 on the catalyst surface by combining with an oxygen atom in the ozone molecule. Then, two electrons were transferred to the O atom, forming ·O− and O2 (eqn (6)). The formed ·O− can react with another O3 molecule to form O2 and superoxide (·O2−) (eqn (7)). Superoxide (·O2−) can decompose and release oxygen vacancies and O2 (eqn (8)), they may participate in the next O3 decomposition cycle.11,39,40 Therefore, as a reaction site, the Ovs not only enhances the absorption of O3 by the catalyst but also forms superoxide radicals with the O3, thereby enhancing catalytic oxidation.| Ovs + O3 → O2 + ·O− | (6) |
| ·O− + O3 → O2 + ·O2− | (7) |
| ·O2− → O2 + Ovs | (8) |
We investigated the catalytic ozonation process to degrade toluene according to the following reaction steps (eqn (9) and (10)). The reaction pathway for catalytic ozonation can be summarized as follows:41
| O* + toluene → intermediates; CO2 and CO | (9) |
| Intermediates and CO + O3 and O* → H2O + CO2 | (10) |
From eqn (9) and (10), we noticed that there was H2O generation in the degradation process of toluene. On the other hand, the ·O2− also had the following reactions from eqn (11) in the presence of H2O.11 Based on these findings, we conclude that during the degradation of toluene, due to the formation of the H2O or humidity of the gas during the reaction, hydroxyl radicals (·OH) are generated and participate in the degradation process. They can directly extract H atoms from toluene methyl groups to form benzyl groups, making subsequent degradation of toluene easier.11
| ·O2− + H2O → 2·OH | (11) |
In this paper, the EPR DMPO spin trap technique was applied to verify the presence of radicals. According to the experimental conditions, the O3 was continuously introduced into the mixed solution of the ZnFe2O4/γ-Al2O3 catalyst, 10 mL of liquid toluene and a 1 mM DMPO solution at ambient temperature with an space velocity of 2000 h−1. The signals of ·O2− and ·OH were observed as depicted in Fig. 8a.41 From the analysis of EPR, the addition of ZnFe2O4 was beneficial to the production of radicals. The superoxide radicals and hydroxyl radicals had significantly higher oxidation rates than O3 alone. Therefore, we concluded that the oxygen activity factor and ·OH generated during the reaction accelerated the degradation of toluene, which was in line with the abovementioned speculation about the degradation mechanism of toluene.
 | ||
| Fig. 8 (a) EPR spectra of superoxide radicals and hydroxyl radicals; (b) FT-IR spectra of γ-Al2O3 and ZnFe2O4/γ-Al2O3 catalyst in unozonation, after use in gaseous mixture of O3 and toluene. | ||
FT-IR was used to study the changes of adsorbed components during the degradation of the ZnFe2O4/γ-Al2O3 catalyst, and the reaction pathways were discussed. We performed FT-IR characterization of the catalyst before and after the degradation experiment, the results are shown in Fig. 8b. For two spectra, there were two distinctly characteristic peaks at 559 cm−1 and 425 cm−1, which were generally considered to be characteristic peaks of the infrared spectrum of the ferrite composite.42 In the crystal structure, each oxygen atom was shared by one tetrahedral cation and three octahedral cations, so the vibration of O2− was related to both the tetrahedron and octahedron, and the characteristic peak at 559 cm−1 was tetrahedral Zn–O. And the characteristic peak of 425 cm−1 was the vibration of a typical Fe–O bond.43 The characteristic peaks found at 1638 cm−1 and 3490 cm−1 were derived from the surface hydroxyl groups of samples.42 This finding was consistent with XPS analysis, where the catalyst surface contained a higher proportion of Oα. After the oxidation reaction, the strength of the surface hydroxyl group was slightly reduced, thereby explaining that some Oα would participate or be temporarily covered during the reaction. After being used in the catalytic ozonation, the FT-IR spectrum showed a strong characteristic peak at 1381 cm−1 after the reaction. This characteristic peak was usually attributed to the surface oxide produced by the combination of O3 and LAS.44,45 This phenomenon confirmed the fact that both the γ-Al2O3 and the ZnFe2O4/γ-Al2O3 catalyst contained a certain amount of LAS in the Py-IR, and also indicated that the active site was not completely covered during the reaction. The active substance produced by the decomposition of O3 was the key to catalyze the ozonation reaction. In referring to the relevant literature,25,26 the reaction process of the catalyst surface during the reaction may be summarized as shown in Fig. S10.† We also observed that a characteristic peak appeared at 1078 cm−1, which was the characteristic peak position belonging to C–O. We presumed that this was due to the production of intermediates during the degradation of toluene, which were adsorbed on the surface of the catalyst. During the degradation of toluene, small molecules such as alcohols, carboxylic acids, and so on were produced and stay on the surface of the material and continue to decompose.
To investigate the degradation process of toluene during the reaction, in this study, after the catalytic ozonation experiment, we collected the produced gas and the organic matter adsorbed on the surface of ZnFe2O4/γ-Al2O3 catalyst. The experimental conditions were as follows: an initial toluene concentration of 600 mg m−3, a temperature of 293 K, and a space velocity of 1000 h−1. With these conditions, toluene had a sufficiently high conversion rate to produce enough intermediates for measurement. As shown in Fig. S11a, b and Table S6,† the ZnFe2O4/γ-Al2O3 catalyst revealed the main substances, including: toluene (C7H8), benzyl alcohol (C7H8O), benzaldehyde (C7H6O), benzyl methyl ether (C8H10O), benzaldehyde dimethyl acetal (C9H12O2), acetic acid, phenylmethyl ester (C9H10O2), benzyl ether (C14H14O), benzene (C6H6), cyclobutanone (C4H6O), propanedioic acid (C3H4O4), ethyl hydrogen malonate (C5H8O4), acetic acid (C2H4O2), ethanol (C2H6O), methyl formate (C2H4O2), and methanol (CH4O). In the produced gas, there was only one carbonaceous material – carbon dioxide (CO2). The difference between the main components of the produced gas and the organic matter adsorbed on the ZnFe2O4/γ-Al2O3 catalysts surface confirmed that most of the catalytic ozonation process took place on the ZnFe2O4/γ-Al2O3 catalyst's surface (including toluene and intermediates) in the case of the efficient removal of toluene.
Based on our analysis, GC-MS results and published studies,11,12 the high concentration toluene catalytic ozonation routes using the ZnFe2O4/γ-Al2O3 catalyst with ambient temperature and pressure were proposed in Scheme 1. In general, the methyl group on the benzene ring in toluene was most easily oxidized, and the free radical can directly extract the H atom from the methyl group to be further converted into a benzyl group. The benzyl peroxy radicals can interact to form a tetraoxide, and the tetraoxide can be further decomposed by the Russell reaction. At the same time, benzyl radicals were directly oxidized to benzaldehyde and benzyl alcohol. At this stage, we suspected that benzoic acid would also be formed by the process of oxidizing benzaldehyde and benzyl alcohol. Subsequently, along with the ring-opening process of the benzene ring, a series of long-chain oxygen-containing small molecules and cyclobutanone were generated. These intermediates continued to be degraded by the catalytic ozonation on the catalyst surface. Among them, benzyl acetate was derived from the synthesis of acetic acid and benzyl alcohol. Finally, CO2 and H2O were generated and discharged with the produced gas. From this analysis, we confirmed that the degradation of toluene was achieved by the adsorption and oxidation processes on the ZnFe2O4/γ-Al2O3 catalyst's surface. In order to further explore the carbon conversion pathways in this process, we also studied the effect of space velocity on the product. The experimental data were collated in Fig. S12.† With the increase of space velocity, not only the removal rate of toluene decreased, but the conversion rate of CO2 also decreased significantly. When the space velocity was above 1500 h−1, the CO2 conversion rate is low. At this time, a large amount of by-products adhere to the catalyst surface, which affects the degradation rate of toluene. During the catalytic ozonation process, except for undegraded toluene and CO2, almost no other products were discharged with the produced gas.
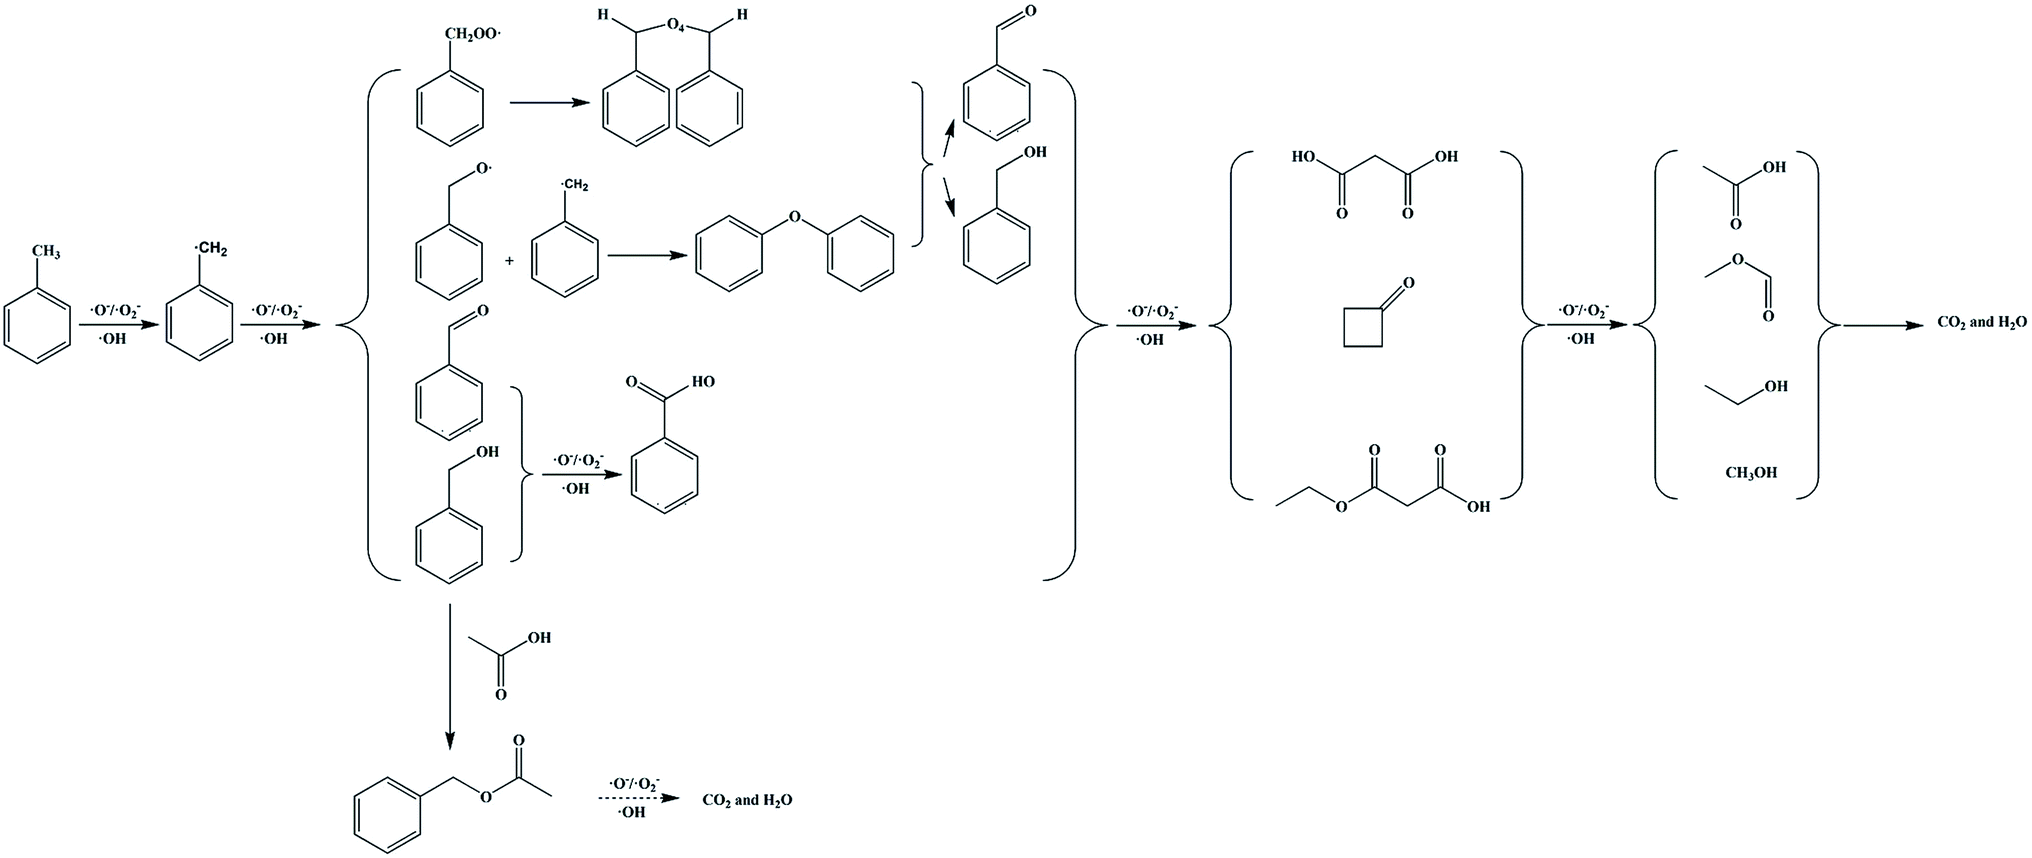 | ||
| Scheme 1 Proposed toluene catalytic ozonation routes over catalysts. Note: this proposed mechanism was lack of the specific production process of water. | ||
Conclusion
Several high-purity AFe2O4/γ-Al2O3 (A = Zn, Co, Mn, Cu) catalysts with strong catalytic performance was prepared by hydrothermal synthesis. The performance of the catalyst was mainly attributed to the large number of surface oxygen vacancies, Lewis acid sites, Brønsted acid sites. The ZnFe2O4/γ-Al2O3 catalyst exhibited excellent and stable catalytic ozonation activity towards the degradation of toluene waste gas simulated at ambient temperature. The catalyst exhibited a strong catalytic efficiency, and the removal efficiency exceeds 99.8% under the optimal reaction conditions. The catalytic ozonation degradation pathway of toluene was identified using GC-MS. The methyl group on the benzene ring was preferentially attacked by the oxidizing substance, and then, the benzene ring was opened to form a series of small molecular groups, eventually generating CO2 and H2O. In addition, ·O2− and ·OH were identified as the main active substances in the catalytic ozonation degradation. More importantly, the developed catalyst demonstrated excellent reusability. This indicated that the catalyst might be a valuable candidate for the high concentrations of industrial toluene waste gas degradation.Conflicts of interest
There are no conflicts to declare.Acknowledgements
Sincere thanks are extended to the Natural Science Foundation of China (No. 21277020) for its financial contributions.Notes and references
- J. Wang, Z. Ge and L. Pei, Catal. Sci. Technol., 2019, 9, 6681–6690 RSC.
- W. Zhou, Z. Guan, M. Zhao and M. Li, Chemosphere, 2019, 226, 766–773 CrossRef CAS PubMed.
- G. Y. Oh, Y. W. Ju and M. Y. Kim, Sci. Total Environ., 2008, 393(2–3), 341–347 CrossRef CAS PubMed.
- A. S. R. Castillo, S. Guiheneuf and R. L. Guevel, J. Hazard. Mater., 2016, 307, 221–230 CrossRef PubMed.
- H. W. Ryu, M. Y. Song, J. S. Park, J. M. Kim and S. C. Jung, Environ. Res., 2019, 172, 649–657 CrossRef CAS PubMed.
- Y. Wang, L. Guo and M. Chen, Catal. Sci. Technol., 2018, 8, 459–471 RSC.
- Y. Li, Z. Fan, J. Shi, Z. Liu and W. Shangguan, Chem. Eng. J., 2014, 241, 251–258 CrossRef CAS.
- L. Sivachandiran, F. Thevenet and P. Gravejat, Chem. Eng. J., 2013, 214, 17–26 CrossRef CAS.
- E. M. Drakou, M. Koutinas and I. Pantelides, Int. Biodeterior. Biodegrad., 2015, 99, 85–94 CrossRef CAS.
- P. Aken, P. Broeck and J. Degreve, J. Cleaner Prod., 2017, 161(10), 1432–1441 CrossRef.
- Y. Shua, M. He, J. Ji, H. Huang and S. Liu, J. Hazard. Mater., 2019, 364, 770–779 CrossRef PubMed.
- H. Valdés, V. A. Solar, E. H. Cabrera, A. F. Veloso and C. A. Zaror, Chem. Eng. J., 2014, 244, 117–127 CrossRef.
- Z. Zhang, Z. Jiang and W. Shangguan, Catal. Today, 2016, 264, 270–278 CrossRef CAS.
- C. W. Kwong and C. Y. H. Chao, Environ. Sci. Technol., 2008, 42(22), 8504–8509 CrossRef CAS PubMed.
- G. Oh, S. Y. Park, M. W. Seo, Y. K. Kim, H. W. Ra, J. Lee and S. J. Yoon, Renew. Energy, 2016, 86, 841–847 CrossRef CAS.
- C. Lai, G. Huang, G. Zeng, D. Huang, L. Qin and M. Cheng, Chemosphere, 2015, 224, 910–921 CrossRef PubMed.
- M. S. Kamal, S. A. Razzak and M. M. Hossain, Atmos. Environ., 2016, 140, 117–134 CrossRef CAS.
- Y. Wang, Y. Xie, H. Sun, J. Xiao and H. Cao, J. Hazard. Mater., 2016, 301, 56–64 CrossRef CAS PubMed.
- Y. Sharma, N. Sharma and G. V. S. Rao, Mater. Sci., 2008, 32, 295–304 Search PubMed.
- D. Gao, Z. Shi, Y. Xu and J. Zhang, Nanoscale Res. Lett., 2010, 5, 1289 CrossRef CAS PubMed.
- J. Bennet, R. Tholkappiyan, K. Vishista and N. V. Jaya, Appl. Surf. Sci., 2016, 383, 113–125 CrossRef CAS.
- P. Zhang, I. Lo, D. O'Connor and S. Pehkonen, J. Colloid Interface Sci., 2017, 508, 39–48 CrossRef CAS PubMed.
- T. Fujii, F. M. F. de Groot, G. A. Sawatzky, F. C. Voogt, T. Hibma and K. Okada, Phys. Rev. B: Condens. Matter Mater. Phys., 1999, 59, 3195–3202 CrossRef CAS.
- Y. Lou, J. Ma, X. Cao, L. Wang, Q. Dai, Z. Zhao, Y. Cai, W. Zhan, Y. Guo, P. Hu, G. Lu and Y. Guo, ACS Catal., 2014, 4(11), 4143–4152 CrossRef CAS.
- J. Haetge, C. Suchomski and T. Brezesinski, Inorg. Chem., 2010, 49, 11619–11626 CrossRef CAS PubMed.
- Z. Xing, Z. Ju, J. Yang and H. Xu, Nano Res., 2012, 5, 477–485 CrossRef CAS.
- H. Einaga and S. Futamura, Appl. Catal., B, 2005, 60(1–2), 49–55 CrossRef CAS.
- T. Gopi, G. Swetha, S. C. Shekar and C. Ramakrishna, Catal. Commun., 2017, 92, 51–55 CrossRef CAS.
- S. C. Kim and W. G. Shim, Appl. Catal., B, 2010, 98(3–4), 180–185 CrossRef CAS.
- Y. Liao, M. Fu, L. Chen, J. Wu, B. Huang and D. Ye, Catal. Today, 2013, 216, 220–228 CrossRef CAS.
- S. Liang, F. Teng, G. Bulgan and R. Zong, J. Phys. Chem. C, 2008, 112, 5307–5315 CrossRef CAS.
- X. Wang, X. Wang, L. Lu, B. Wang, Z. Xu and Z. Xin, Adv. Funct. Mater., 2018, 28, 1–9 Search PubMed.
- X. Weng, P. Sun, Y. Long and Q. Meng, Environ. Sci. Technol., 2017, 51(14), 8057–8066 CrossRef CAS PubMed.
- D. R. Brown and C. N. Rhodes, Catal. Lett., 1997, 45(1–2), 35–40 CrossRef CAS.
- M. Piumetti, D. Fino and N. Russo, Appl. Catal., B, 2015, 163, 277–287 CrossRef CAS.
- X. Ding, W. Ho, J. Shang and L. Zhang, Appl. Catal., B, 2016, 182, 316–325 CrossRef CAS.
- J. Lu, X. Wei, Y. Chang and S. Tian, J. Chem. Technol. Biotechnol., 2016, 91(4), 985–993 CrossRef CAS.
- F. Zhang, C. Wei, Y. Hu and H. Wu, Sep. Purif. Technol., 2015, 156(2), 625–635 CrossRef CAS.
- Q. Dai, J. Wang and J. Chen, Appl. Catal., B, 2014, 144, 686–693 CrossRef CAS.
- J. Ma, W. Ma, W. Song, C. Chen and Y. Tang, Environ. Sci. Technol., 2006, 40(2), 618–624 CrossRef CAS PubMed.
- H. Huang, X. Ye, W. Huang, J. Chen, Y. Xu and M. Wu, Chem. Eng. J., 2015, 264, 24–31 CrossRef CAS.
- F. Zhang, C. Wei, K. Wu, H. Zhou, Y. Hu and S. Preis, Appl. Catal., A, 2017, 547, 60–68 CrossRef CAS.
- G. Zhu, J. Zhu, W. Jiang, Z. Zhang, J. Wang and Y. Zhu, Appl. Catal., B, 2017, 209, 729–737 CrossRef CAS.
- J. Bing, C. Hu, Y. Nie and J. Qu, Environ. Sci. Technol., 2015, 49, 1690–1697 CrossRef CAS PubMed.
- L. Yang, C. Hu, Y. Nie and J. Qu, Environ. Sci. Technol., 2009, 43(7), 2525–2529 CrossRef CAS PubMed.
Footnote |
| † Electronic supplementary information (ESI) available. See DOI: 10.1039/c9ra10601d |
| This journal is © The Royal Society of Chemistry 2020 |