
 Open Access Article
 This Open Access Article is licensed under a Creative Commons Attribution-Non Commercial 3.0 Unported Licence
Hydrogenolysis of biomass-derived sorbitol over La-promoted Ni/ZrO2 catalysts†
Chiliu Cai‡
 abc,
Haiyong Wang‡abc,
Haosheng Xinabc,
Changhui Zhuabc,
Qi Zhangabc,
Xinghua Zhangabc,
Chenguang Wang*abc,
Qiying Liu*abc and
Longlong Maabc
abc,
Haiyong Wang‡abc,
Haosheng Xinabc,
Changhui Zhuabc,
Qi Zhangabc,
Xinghua Zhangabc,
Chenguang Wang*abc,
Qiying Liu*abc and
Longlong Maabc
aGuangzhou Institute of Energy Conversion, Chinese Academy of Sciences, 510640 Guangzhou, China. E-mail: liuqy@ms.giec.ac.cn; wangcg@ms.giec.ac.cn; Fax: +86-20-87057789; Tel: +86-20-87048614 Tel: +86-20-37029721
bKey Laboratory of Renewable Energy, Chinese Academy of Sciences, 510640 Guangzhou, China
cGuangdong Key Laboratory of New and Renewable Energy Research and Development, 510640 Guangzhou, China
First published on 23rd January 2020
Abstract
Ni/La2O3/ZrO2 catalysts were prepared by a step-by-step impregnation method through regulation of the contents of the active component and alkali. The introduction of an alkaline promoter not only enhanced the alkalinity of the catalyst but also improved the dispersion of Ni on the catalyst owing to the strong interaction between Ni2+ and alkali promoter. The synergistic effect between Ni and La2O3 was beneficial to selective hydrogenolysis of sorbitol. Under the optimal reaction conditions, sorbitol conversion reached nearly 100% and target products (ethylene glycol, 1,2-propanediol, and glycerol) selectivity reached 74.8%. Metal–alkali coordination mechanism and possible pathways for target products formation were proposed.
1. Introduction
On account of excessive exploitation of fossil fuel sources and serious contaminative environmental problems, worldwide efforts have been devoted to exploiting new energy sources, especially clean and renewable energy sources.1–3 As a clean and renewable resource, biomass energy is an ideal alternative resource with its advantages of high reserves, renewability, and non-greenhouse-gas emission.4–6 Sugar alcohols (sorbitol and xylitol) are the important platform compounds produced from biomass and can be converted into high-value-added chemicals through hydrogenolysis, oxidation, or selective reduction.7–10It is widely believed that hydrogenolysis of polyols to glycols involves three key steps:11,12 First, some hydroxyl groups on the molecule of polyols are dehydrogenated at the metal active sites. Subsequently, C–C bond cleavage of intermediates occurs by an alkaline catalyst via retro-aldol condensation. Finally, the carbonyl intermediates are hydrogenated to target glycols on the metal surfaces.13 For sorbitol conversion into small-molecule alcohols, researchers have mainly focused on the synergistic regulation of metal active sites and alkaline sites, which are useful for selective cleavage of C–C and C–O bonds.14,15 According to previous reports,11–17 owing to their high activity for C–C bond cleavage, Ni- and Ru-based catalysts have been often applied in experiments. Unfortunately, they also catalyse excessive C–C bond scission to produce by-products. In contrast, Cu-based catalysts exhibit good activities for C–O, C![[double bond, length as m-dash]](https://www.rsc.org/images/entities/char_e001.gif) O, and CC bond hydrogenation and C–OH dehydrogenation but poor reactivity activity for C–C bond cleavage.18 Huang et al.19 observed that, by using Cu–SiO2 catalysts, one could obtain ∼60% yield of glycols and glycerol (GLY) in the presence of Ca(OH)2. Ni–NaY and Pt–NaY catalysts were used in the presence of Ca(OH)2. It was found that the main products on Ni–NaY and Pt–NaY catalysts were 1,2-propylene glycol (1,2-PG) and GLY, respectively.20
O, and CC bond hydrogenation and C–OH dehydrogenation but poor reactivity activity for C–C bond cleavage.18 Huang et al.19 observed that, by using Cu–SiO2 catalysts, one could obtain ∼60% yield of glycols and glycerol (GLY) in the presence of Ca(OH)2. Ni–NaY and Pt–NaY catalysts were used in the presence of Ca(OH)2. It was found that the main products on Ni–NaY and Pt–NaY catalysts were 1,2-propylene glycol (1,2-PG) and GLY, respectively.20
Composite catalysts combining with metallic sites and basic sites have been used in this reaction.21 A Cu/γ-Al2O3 catalyst can promote C–C and C–O bonds cleavage, leading to the conversion of glucose to glycols (with a selectivity of 67%).22 Ordered mesoporous 10.9% Ni/6.3% CeO2–Al2O3 showed better catalytic performance in the hydrogenolysis of sorbitol, obtaining a 56.9% yield of ethylene glycol (EG) and 1,2-PG.23 A Cu–Ni/ZrO2 catalyst was efficient for xylitol conversion to EG and 1,2-PG with a 65% total selectivity in water without a base additive.24 Recently, researchers25 found that Ru–(Mn–Al)Ox solid base catalysts exhibited high performance (with 58% selectivity of glycols) in the hydrogenolysis of xylitol under base-free conditions. This catalyst, however, was not stable during the reaction because the Mn species were converted to other compounds. 3% Ru/4.5% MnO/C also showed good activity with 70% selectivity of glycols in a water–alcohol mixture solvent, avoiding competitive decarbonylation at the Ru sites. However, the catalyst exhibited poor hydrothermal stability in the hydrogenolysis of xylitol.26 Zhang27 reported the use of 10% Ni–0.5% Ir/La2O3 catalyst for the conversion of cellulose to EG and 1,2-PG in a higher yield of 63.7%.
Although the catalytic system reported in the previous literature can efficiently realize sorbitol hydrogenolysis, the commonly used alkaline additives are slightly soluble CaO or Ca(OH)2, which can easily corrode equipment and cause poor product separation.28,29 Therefore, the development of new solid-alkali-supported metal catalysts can effectively solve this problem. In this paper, using the inexpensive alkaline additive La2O3 and inexpensive active Ni, we prepared Ni/La2O3/ZrO2 catalysts with different Ni/La ratios by using the initial wetness impregnation method. The physicochemical properties of the catalysts were characterized by X-ray diffraction, scanning electron microscopy, H2 and CO2 temperature-programmed reduction techniques, inductively coupled plasma atomic emission spectrometry, X-ray photoelectron spectroscopy and Transmission Electron Microscopy. The catalytic performance was investigated in sorbitol hydrogenolysis via different reaction parameters. The synergistic effect between the metal and the base of the catalysts was discussed and the possible pathways for target products formation were also proposed during sorbitol hydrogenolysis.
2. Experimental section
2.1. Catalyst preparation
The Ni/La2O3/ZrO2 catalysts were prepared by initial wetness impregnation. ZrO2 was added to a La(NO3)3·6H2O solution with different La contents, and the mixture was stirred for 4 h at room temperature. The excess H2O was evaporated at 80 °C for 12 h. Subsequently, the obtained powder was dried overnight at 100 °C. Finally, the powder was calcined at 550 °C for 4 h at a heating rate of 5 °C min−1 to obtain the La2O3/ZrO2.The obtained La2O3/ZrO2 was added to a Ni(NO3)2·6H2O solution with a certain Ni amount, followed by rigorous stirring at room temperature at 4 h. Then the sample was dried and calcined following the same procedure mentioned above. Finally, the Ni/La2O3/ZrO2 catalysts were reduced in the H2 atmosphere at 500 °C for 4 h before reaction.
2.2. Catalyst characterization
The textural properties of the catalysts were determined using an automated surface area and pore size analyzer (Quantachrome Co., USA) at −196 °C.X-ray powder diffraction patterns were obtained on a Rigaku D/max-rC X-ray diffractometer operated at 40 kV and 40 mA using Cu Kα radiation (λ = 0.154 nm) and 2θ was scanned from 10° to 80° with a step size of 0.0167°.
The surface morphology of the catalyst was observed using a Hitachi S-4800 scanning electron microscope (SEM).
The thermogravimetry (TG) experiments were operated from room temperature to 550 °C at a heating rate of 20 °C min−1 under an air atmosphere.
CO temperature-programmed desorption (CO-TPD) were measured using a CHEMBET 3000 chemisorption/desorption apparatus (Quantachrome Co., USA). In a typical test, a 50 mg sample was placed into a U-shaped quartz tube, reduced at 500 °C for 4 h under H2 flow and purged at the same temperature for 40 min under He flow. After cooling to 50 °C, it was adsorbed with CO for 80 min. The sample was then purged by a He flow to remove the physical adsorbed CO for 1 h. The sample was heated from 50 °C to 850 °C at a heating rate of 10 °C min−1 and the CO desorption was monitored with a TCD detector.
CO2 temperature-programmed desorption (CO2-TPD) measurement was conducted on CHEMBET 3000 equipment (Quantachrome, USA). In a typical run, 50 mg sample was put into a U-shaped quartz tube and purged with He at 400 °C for 40 minutes. After cooling to 50 °C, it was adsorbed with CO2 for 1 h. Finally, He was again introduced to remove the physical adsorbed CO2 for 1 h. The sample was heated from 50 °C to 900 °C at 10 °C min−1 heating rate and the CO2 desorption was monitored with a TCD detector.
H2 temperature-programmed reduction (H2-TPR) was performed on an Auto Chem II 2920 chemical adsorption instrument. For a typical test, 20 mg sample was purged with He flow at 250 °C for 1 h, then the temperature was decreased to 50 °C. The sample was heated from 50 °C to 900 °C at a heating rate of 10°C min−1 under a 5% H2/He flow.
The Ni and La leaching after reaction was analyzed by the inductively coupled plasma atomic emission spectrometry (ICP-AES) measurement using a PerkinElmer OPTIMA 8000 instrument.
The microstructure of catalysts was analyzed by Transmission Electron Microscopy (TEM) on a JEOL JEM-2100EX electron microscopy and the electron beam accelerating voltage was 200 kV.
X-ray photoelectron spectroscopy (XPS) was performed by using a Thermo Fisher Scientific Escalab 250 Xi photoelectron spectrometer and values were corrected by C 1s (284.8 eV). The spectra was excited using Mg Kα (1253.6 eV) radiation (operated at 200 W) of a twin anode in the constant analyzer energy mode with a pass energy of 30 eV.
2.3. Sorbitol hydrogenolysis and products analysis
Sorbitol hydrogenolysis was performed in a stainless steel autoclave, into which 20 mL of 100 mg mL−1 sorbitol aqueous solution and 0.4 g of freshly reduced catalyst were introduced. After eliminating the air residue by H2 flushing, the reactor was pressurized by H2 and was heated to a certain temperature for a certain period. During the hydrogenolysis process, the H2 pressure was kept at a constant 4 MPa by supplying H2. After reaction, the reaction system was cooled to collect the products.The stability experiment procedure was described as follows: after each reaction cycle, the reaction liquid was centrifuged, the upper layer liquid was removed for product analysis, and the lower catalysts continued to be used in the next cycle reaction without any treatment. This cycle was repeated five times. For catalyst regeneration, the used catalysts were calcined in an air atmosphere at 500 °C for 1 h and then were reduced in an H2 atmosphere at 500 °C for 4 h.
The aqueous products were analysed with a Waters 2695 HPLC containing a refraction index and UV detector (RID-2414) and SH1011 separation column. Sulfuric acid solution (0.005 mol L−1) was used as the eluent at a 0.5 mL min−1 flow rate. The gas products were analyzed with a Ke Chuang Gas Chromatography 9800FP with a Porapak Q column.
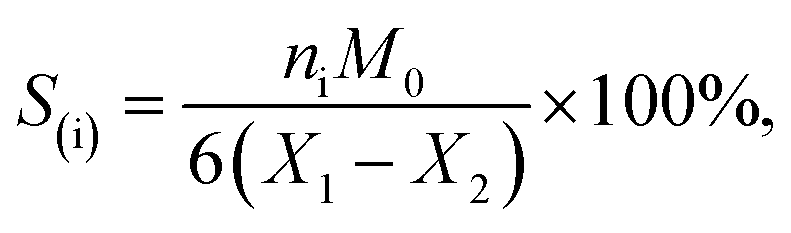
The sorbitol conversion and selectivity S(i) of product i were defined by the following formulas:

where X1 expressed the initial sorbitol weight and X2 expressed the sorbitol weight after reaction, ni represented the carbon moles of product i (GLY, EG, and 1,2-PG) and M0 was molar weight of sorbitol.
3. Results and discussion
3.1. Characterizations of catalysts
Table 1 listed the texture properties of different catalysts. The Brunauer–Emmett–Teller (BET) area and pore volume of ZrO2 were 40.9 m2 g−1 and 0.20 mL g−1, respectively, whereas for Ni/ZrO2, with the introduction of Ni, the specific surface area and pore volume of 10% Ni/ZrO2 catalyst decreased. However, the average pore size of Ni/ZrO2 increased after Ni introduction. This might be because Ni entered into the inner channels of ZrO2 after impregnation, causing a decrease of specific surface area. The addition of La2O3 did not obviously cause the specific surface area and pore volume to decrease, indicating that it could highly disperse on the ZrO2 surface.| Catalyst | SBETa (m2 g−1) | Pore volumeb (mL g−1) | Pore diameterc (nm) | DNid (%) | dNiOe (nm) |
|---|---|---|---|---|---|
| a Calculated by using the BET method.b Determined by the cumulative volume between P/P0 = 0.03–0.99.c Calculated from the desorption branch by using the Barrett–Joyner–Halenda (BJH) method.d Ni dispersion values were obtained by CO-TPD.e Diameters of NiO particles were calculated by using the Scherrer formula ((111) crystal plane). | |||||
| ZrO2 | 40.9 | 0.20 | 16.7 | — | — |
| 10% Ni/ZrO2 | 36.8 | 0.17 | 19.8 | 5.3 | 25 |
| 10% Ni/2% La2O3/ZrO2 | 35.2 | 0.18 | 18.2 | 10.7 | 8 |
| 10% Ni/5% La2O3/ZrO2 | 36.4 | 0.17 | 20.1 | 9.6 | 11 |
| 10% Ni/10% La2O3/ZrO2 | 33.5 | 0.17 | 18.8 | 10.8 | 7 |
| 10% Ni/20% La2O3/ZrO2 | 30.9 | 0.16 | 19.0 | 10.7 | 8 |
| 5% Ni/5% La2O3/ZrO2 | 37.9 | 0.19 | 19.6 | 12.6 | 5 |
| 7.5% Ni/5% La2O3/ZrO2 | 35.7 | 0.17 | 20.3 | 11.0 | 9 |
| 12.5% Ni/5% La2O3/ZrO2 | 31.8 | 0.12 | 22.4 | 7.9 | 15 |
The XRD patterns of different catalysts were presented in Fig. 1. The diffraction patterns of NiO found in 10% Ni/ZrO2 had diffraction peaks at 37.3° and 43.3°, corresponding to the (111) and (200) crystal planes of NiO, respectively. With La2O3 introduction, the intensity of NiO decreased, which indicated that La2O3 improved the dispersion of NiO by the enhanced interaction between Ni2+ and La2O3.30 With increasing La2O3 in the catalysts, no obvious changes in NiO diffraction patterns could be observed. However, with further increasing La2O3 loading to >10%, the intensity of ZrO2 and NiO decreased remarkably. The reduction of the diffraction peaks was possibly attributed to the decrease of the relative content of ZrO2 on the catalysts. No La2O3 diffraction peaks were observed even the loading was as high as 20%, indicating that La2O3 existed as an amorphous form and highly dispersed on ZrO2 surface. The weakness of the NiO diffraction peak should be due to the good dispersion of NiO on the catalyst surface, which was promoted by La2O3. Compared to Ni/ZrO2, the NiO particle sizes in the Ni/La2O3/ZrO2 catalysts were significantly reduced, again evidencing Ni stabilization by La2O3 addition. Fig. 1 and 2 also showed that the catalysts had a good crystalline phase before reaction, indicating that the support and Ni particles were unchanged and demonstrating high hydrothermal stability.
 | ||
| Fig. 1 XRD patterns of La-promoted Ni/ZrO2 catalysts by different Ni and La loadings. | ||
 | ||
| Fig. 2 SEM image of 10% Ni/5% La2O3/ZrO2 catalyst before reaction. | ||
To investigate the effect of La2O3 on the reduction characteristics of catalysts, we investigated the H2 reduction behavior through the H2-TPR technique (Fig. 3). There was a single peak at ∼500 °C for 10% Ni/ZrO2, which corresponded to the reduction of NiO particles. After adding La2O3, the reduction peaks of NiO shifted to lower temperatures, showing that La2O3 weakened the interaction between Ni species and the ZrO2 support. Upon further increase of the La2O3 loadings, the reduction peak of NiO was further reduced to ∼400 °C.
 | ||
| Fig. 3 H2-TPR profiles of catalysts with different La promoters. | ||
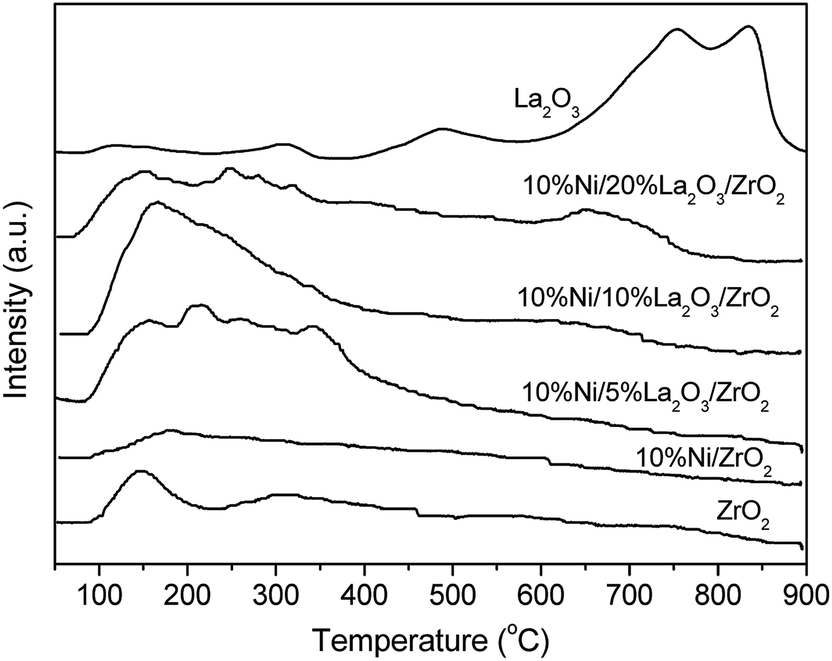
The basicities of the Ni-based catalysts with different La2O3 loadings were displayed in Fig. 4. The desorption peak of CO2 at 150 °C for ZrO2 and those obtained at 750 °C and 850 °C for La2O3 indicated that ZrO2 and La2O3 presented weak basicity and strong basicity, respectively. Because Ni was supported on ZrO2 without La2O3, the weak basicity was kept but the total number of basic sites was reduced. However, for the Ni/La2O3/ZrO2 catalysts, the number of weak basic sites remarkably increased, suggesting that the La2O3 additive strengthened the weak basicity.
 | ||
| Fig. 4 CO2-TPD profiles of catalysts with different La loadings. | ||
3.2. Catalytic performance
Table 2 listed the results of sorbitol hydrogenolysis over Ni-based catalysts with different contents of La2O3 under the conditions of 220 °C and 4 MPa H2 pressure. Throughout the process, sorbitol was mostly converted to the target products. By-products such as erythritol, xylitol, etc. were also observed, and the data for those were not shown here. When a 10% Ni/ZrO2 catalyst was used, a 66.6% sorbitol conversion with a 23.7% total selectivity containing GLY, EG, and 1,2-PG was achieved. With the addition of La2O3, sorbitol conversion and total glycol selectivity were obviously increased. With increasing La2O3 content from 2 wt% to 5 wt%, the sorbitol conversion sharply rose from 63.5% to 96.8%. Meanwhile, the total selectivity for the target products also rose from 37.3% to 74.8%.| Entry | Catalyst | Conversion (%) | Product selectivity (C mol%) | Total selectivity (%) | ||
|---|---|---|---|---|---|---|
| GLY | EG | 1,2-PG | ||||
| a Reaction conditions: 10% sorbitol contained in an aqueous solution of 40 mL; catalyst amount = 1 g; temperature = 220 °C; initial H2 pressure = 4 MPa. Entries 1–5 are for 4 h; entries 6–9 are for 2 h. GLY = glycerol; EG = ethylene glycol; 1,2-PG = 1,2-propylene glycol. | ||||||
| 1 | 10% Ni/ZrO2 | 66.6 | 13.1 | 3.9 | 6.7 | 23.7 |
| 2 | 10% Ni/2% La2O3/ZrO2 | 63.5 | 18.3 | 5.2 | 13.8 | 37.3 |
| 3 | 10% Ni/5% La2O3/ZrO2 | 96.8 | 27.7 | 20.3 | 26.8 | 74.8 |
| 4 | 10% Ni/10% La2O3/ZrO2 | 94.2 | 24.5 | 17.9 | 28.4 | 70.8 |
| 5 | 10% Ni/20% La2O3/ZrO2 | 87.5 | 21.2 | 14.2 | 26.8 | 62.2 |
| 6 | 5% Ni/5% La2O3/ZrO2 | 55.8 | 30.2 | 13.3 | 21.7 | 65.3 |
| 7 | 7.5% Ni/5% La2O3/ZrO2 | 75.4 | 30.3 | 14.3 | 21.8 | 66.4 |
| 8 | 10% Ni/5% La2O3/ZrO2 | 76.6 | 32.1 | 13.6 | 20.4 | 66.1 |
| 9 | 12.5% Ni/5% La2O3/ZrO2 | 71.3 | 31.6 | 13.9 | 20.8 | 66.3 |
However, when we continued to increase the La2O3 content to 20 wt%, the sorbitol conversion and total selectivity dropped to 87.5% and 62.2%, respectively. The above results indicated that the alkaline La2O3 promoted catalytic performance for obtaining the target products, which was conducive to C–C scission in the retro-aldol condensation and also helpful for improving the desired product selectivity. Sorbitol and intermediates might also be adsorbed on the alkaline sites to improve the reaction.31 However, the excessive La2O3 promoted abundant reverse C–C scission and formed other by-products, which led to a decrease in the selectivity of the desired product. Therefore, it could be concluded that 5% La2O3 content was appropriate for optimizing the reaction (entries 2–5). In addition, different contents of Ni were investigated by using 5% La2O3 as a base (entries 6–9). Increasing the Ni content from 5% to 12.5% led to increased sorbitol conversion but the total selectivity of target products remained at ∼66%. It was obvious that the basic La2O3 plays a more profound role in glycol formation from sorbitol hydrogenolysis than Ni. Given the best performance in sorbitol hydrogenolysis to the target products, the optimized 10% Ni/5% La2O3/ZrO2 catalyst was chosen to investigate the influence of temperature, reaction time, and H2 pressure.
As shown in Fig. 5A, the sorbitol conversion increased from 26% to 100% as the reaction temperature increased from 200 °C to 240 °C, which indicated that temperature had an important effect on sorbitol conversion. The selectivity of GLY, EG, and 1,2-PG increased as the reaction temperature increased from 200 °C to 220 °C. However, when the reaction temperature was higher than 220 °C, the selectivity of GLY and target products total selectivity decreased while the selectivity of EG and 1,2-PG still increased, this result demonstrated that GLY acted as the key intermediate for further conversion to EG and 1,2-PG possibly through dehydration and hydrogenation.
 | ||
| Fig. 5 Influence of reaction temperature (A), initial H2 pressure (B), and reaction time (C) on sorbitol hydrogenolysis to glycols over 10% Ni/5% La2O3/ZrO2. Reaction conditions: 10% sorbitol contained in an aqueous solution of 40 mL; catalyst amount = 1 g; temperature = 220 °C; initial H2 pressure = 4 MPa; time = 2 h. “TS” means total selectivity of GLY, EG, and 1,2-PG. | ||
Fig. 5Bshowed the effect of H2 pressure. The conversion of sorbitol slightly reduced with the increase of H2 pressure, while the selectivities of the target products were almost unchanged. This indicated that the target products obtained by sorbitol hydrogenolysis were insensitive to the H2 pressure.
The effect of reaction time on sorbitol conversion and product selectivity was presented in Fig. 5C. The sorbitol conversion increased with the reaction time, reaching almost 100% at 4 h. Meanwhile, the selectivity of GLY decreased from 31% to 10% as reaction time increased from 0.5 h to 8 h. At 4 h, the selectivities of EG and 1,2-PG reached the maximum values. At the same time, xylitol and erythritol were also detected in the liquid phase, obtaining the selectivity of 5.6% and 1.8%, respectively. Trace ethanol was also detected in the liquid phase. There were also a certain amount of gas products such as CH4, CO, and CO2. Unfortunately, the CH4 selectivity increased to 27% at 8 h. With increasing of reaction time, the yields of small molecule monohydric alcohols and gas-phase products increased. In a word, the optimized conditions were determined as: initial H2 pressure of 4 Mpa, reaction temperature of 220 °C and reaction time of 2 h.
The stability of the catalyst was of great importance for industrial applications. A stability test was conducted using a 10% Ni/5% La2O3/ZrO2 catalyst and the optimized reaction conditions (Fig. 6). After reaction, the catalyst was separated via filtration and directly used for the next run without any treatment. As shown in Fig. 6, the sorbitol conversion decreased rapidly from 98% to 52% after five cycles, while the target products total selectivity slightly decreased to 60%. After regeneration of the used catalyst by calcination and reduction, the catalytic performance could be regenerated partially based on the sorbitol conversion and glycols selectivity. The leaching of Ni2+ was 1.5 wt%, 0.8 wt%, 0.3 wt%, 0.1 wt%, 0.03 wt%, respectively, after each run. For La3+, the leaching was 1.9 wt%, 1.2 wt%, 0.8 wt%, 0.6 wt%, 0.3 wt%, respectively. It was inferred that metal elution might be one factor of catalyst deactivation.26 According to Fig. 7, the La XPS spectra of the fresh and used catalysts indicated that their chemical valence was almost the same, showing the stable La species under the current hydrothermal conditions. For the Ni species, partial oxidation took place after the fifth cycle. It also could be seen from XRD pattern (Fig. 8) that the catalyst after the fifth cycle was mainly contained La(OH)3 and La2(CO3)3 phase.32,33
 | ||
| Fig. 6 Stability and regeneration test of 10% Ni/5% La2O3/ZrO2 in sorbitol hydrogenolysis to glycols. Reaction conditions: 10% sorbitol contained in an aqueous solution of 40 mL; catalyst amount = 1 g; temperature = 220 °C; initial H2 pressure = 4 MPa; time = 4 h. | ||
 | ||
| Fig. 7 XPS spectra of La 3d (A) and Ni 2p (B) in the fresh and the fifth used 10% Ni/5% La2O3/ZrO2 catalysts. | ||
 | ||
| Fig. 8 XRD patterns of the fresh and the used 10% Ni/5% La2O3/ZrO2 after the fifth used. | ||
TG analysis27 (Fig. 9) showed that weight loss at 350 °C was attributed to the removal of surface hydroxyl group and CO32−. TEM analysis was also carried out for the same catalyst after reaction (Fig. 10), there were no obvious change of the catalysts, so it could be concluded that catalyst deactivation was not caused by carbon deposition. The main reason for deactivation of the catalyst and decrease of target product selectivity was due to the metal leaching.
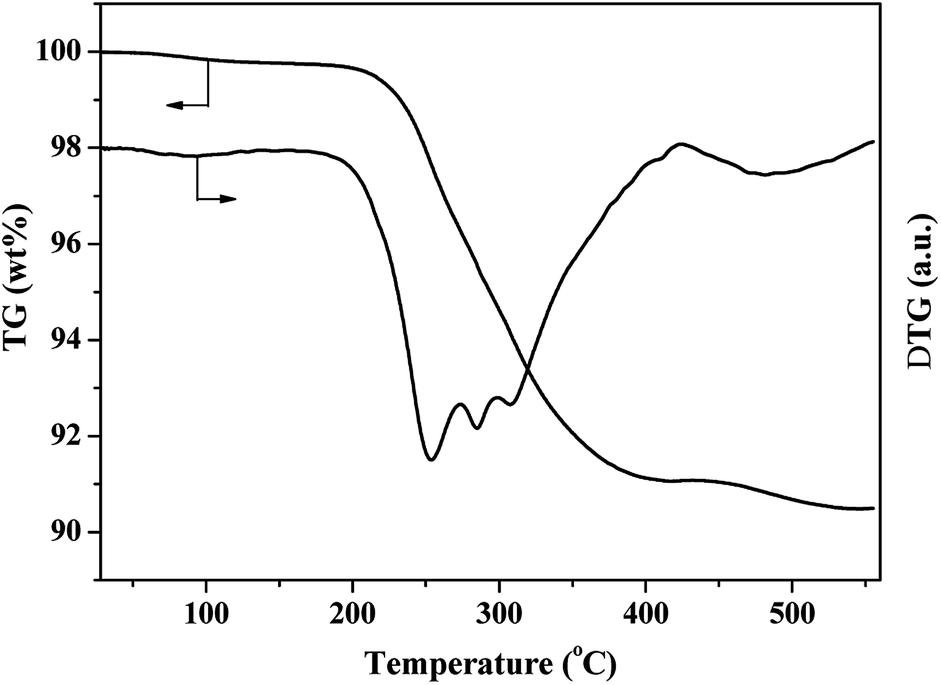 | ||
| Fig. 9 TG-DTG profiles of 10% Ni/5% La2O3/ZrO2 catalyst after sorbitol hydrogenolysis and drying at 100 °C. | ||
 | ||
| Fig. 10 TEM images of fresh and used catalysts: (a and b) fresh and (c and d) after the fifth used 10% Ni/5% La2O3/ZrO2. | ||
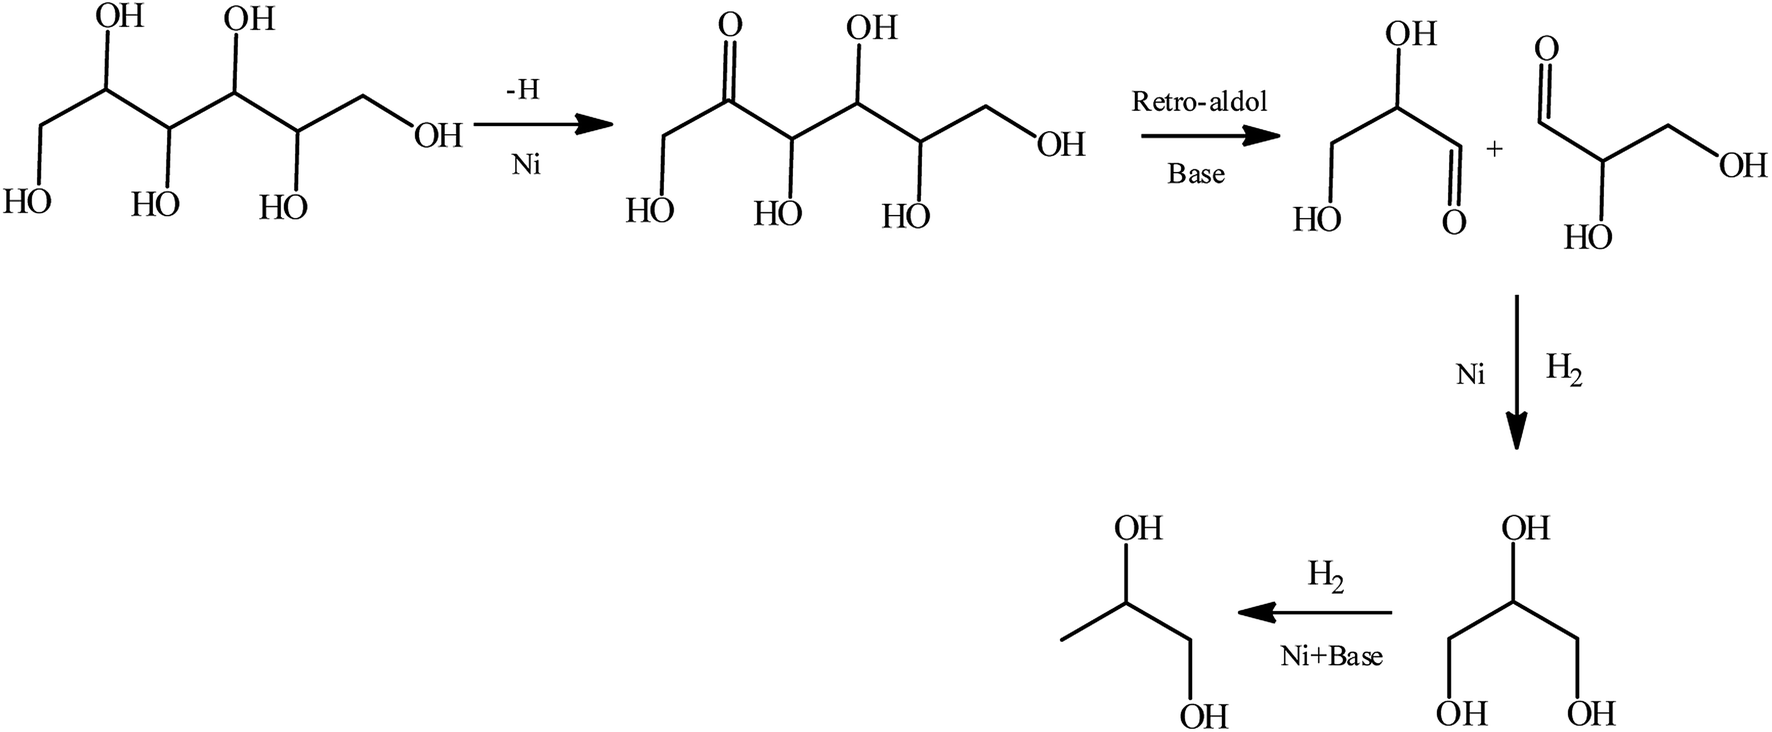
Based on the distributions of products in our case and the previous reports,11–14 we proposed reaction pathway for sorbitol hydrogenolysis to 1,2-PG (Scheme 1) and possible pathways for target products formation from sorbitol hydrogenolysis over 10% Ni/5% La2O3/ZrO2 catalyst in Scheme 2. In Scheme 1, sorbitol was dehydrogenated at C2-position, and then glyceraldehyde was formed under the action of base. CO of glyceraldehyde was easily hydrogenated to GLY, and finally 1,2-PG was formed under the action of H2, Ni and base.
 | ||
| Scheme 1 Reaction pathway for sorbitol hydrogenolysis to 1,2-PG over the Ni based catalyst.34 | ||
 | ||
| Scheme 2 Possible pathways for sorbitol hydrogenolysis to small molecular glycols. | ||
In the current case, metal Ni and basic La2O3 synergistically promoted the rate-determined sorbitol dehydrogenation to form the corresponding C6 aldehyde sugar. The C6 aldehyde sugar could be further isomerized to the relative ketone sugar with the aid of the base La2O3. Afterward, the aldehyde and ketone sugars were hydrogenolyzed to the C3–C4 aldehyde and a ketone containing polyols intermediates via the retro-aldol reaction, where the C3 counterpart was hydrogenated to GLY and the C4 intermediate was further converted into the C2 glycolaldehyde via a similar retro-aldol reaction followed by hydrogenation to EG. However, GLY could be further converted into C1 and C2 intermediates, which were finally transferred to CH4 and EG. In addition, decarbonylation and aqueous phase reformation could not be ruled out because trace amounts of CO and CO2 were detected besides CH4. During this process, the synergy between metallic Ni and basic La2O3 in the catalyst played an essential role in obtaining the target C2–C3 polyols with high selectivity.
4. Conclusions
Ni/La2O3/ZrO2 catalysts were prepared via initial wetness impregnation and used as the metal–base bi-functional catalysts for the hydrogenolysis of sorbitol into target small molecular polyol products. The addition of La2O3 improved the basicities of the Ni-based catalyst and promoted dispersion of Ni particles by strong interactions of Ni and La2O3. By optimizing the sorbitol hydrogenolysis process, we could obtain the highest target products selectivity of 74.8% over 10% Ni/5% La2O3/ZrO2 catalyst, under the conditions of 220 °C, 4 MPa H2 pressure and 4 h of reaction time. The possible metal–alkali coordination mechanism and possible pathways for target products formation were proposed. Ni metal promoted dehydrogenation and hydrogenation reaction, basic promoter was benefit to C–C bond cleavage, and afterwards polyols were produced by a series of small carbonyl molecules hydrogenation reactions.Conflicts of interest
There are no conflicts to declare.Acknowledgements
This work is financially supported by the National Key R&D Program of China (2018YFB1501402), the Natural Science Foundation of Guangdong Province (2017A030308010), the National Natural Science Foundation of China (51576199 and 51536009), the DNL Cooperation Fund, CAS (DNL180302), the “Transformational Technologies for Clean Energy and Demonstration”, Strategic Priority Research Program of the Chinese Academy of Sciences (No. XDA21060102), and the Local Innovative and Research Teams Project of Guangdong Pearl River Talents Program (2017BT01N092).References
- G. W. Huber, S. Iborra and A. Corma, Chem. Rev., 2006, 106, 4044–4098 CrossRef CAS PubMed.
- J. N. Chheda, G. W. Huber and J. A. Dumesic, Angew. Chem., Int. Ed. Engl., 2010, 46, 7164–7183 CrossRef.
- S. Ye and J. Cheng, Cheminform, 2003, 83, 1–11 Search PubMed.
- J. C. Serrano-Ruiz, R. Luque and A. Sepúlveda-Escribano, Chem. Soc. Rev., 2011, 40, 5266–5281 RSC.
- X. Tong, M. A. Yang and L. I. Yongdan, Appl. Catal., A, 2010, 385, 1–13 CrossRef CAS.
- J. J. Bozell and G. R. Petersen, Green Chem., 2010, 12, 539–554 RSC.
- K. Wang, M. C. Hawley and T. D. Furney, Ind. Eng. Chem. Res., 1995, 34, 3766–3770 CrossRef CAS.
- E. L. Kunkes, D. A. Simonetti, R. M. West, J. C. Serrano-Ruiz, C. A. Gärtner and J. A. Dumesic, Science, 2008, 322, 417 CrossRef CAS PubMed.
- A. M. Ruppert, K. Weinberg and R. Palkovits, Angew. Chem., Int. Ed., 2012, 51, 2564–2601 CrossRef CAS PubMed.
- H. Imamura, T. Tanaka, Y. Sakata and S. Tsuchiya, J. Alloys Compd., 1999, 293–295, 919–922 CrossRef CAS.
- H. Liu, Z. Huang, H. Kang, X. Li, C. Xia, J. Chen and H. Liu, Appl. Catal., B, 2018, 220, 251–263 CrossRef CAS.
- Y. Jia and H. Liu, Catal. Sci. Technol., 2016, 6, 7042–7052 RSC.
- Z. Long, J. Zhou, C. Hong, M. Zhang, Z. Sui and X. Zhou, Korean J. Chem. Eng., 2010, 27, 1412–1418 CrossRef.
- J. Sun and H. Liu, Green Chem., 2011, 13, 135–142 RSC.
- J. J. Zhang, F. Lu, W. Q. Yu, J. Z. Chen, S. Chen, J. Gao and J. Xu, Catal. Today, 2014, 234, 107–112 CrossRef CAS.
- R. Mane, S. Patil, M. Shirai, S. Rayalu and C. Rode, Appl. Catal., B, 2017, 204, 134–146 CrossRef CAS.
- X. Chen, X. Wang, S. Yao and X. Mu, Catal. Commun., 2013, 39, 86–89 CrossRef CAS.
- A. F. Trasarti, N. M. Bertero, C. R. Apesteguía and A. J. Marchi, Appl. Catal., A, 2014, 475, 282–291 CrossRef CAS.
- Z. Huang, J. Chen, Y. Jia, H. Liu, C. Xia and H. Liu, Appl. Catal., B, 2014, 147, 377–386 CrossRef CAS.
- M. Banu, S. Sivasanker, T. M. Sankaranarayanan and P. Venuvanalingam, Catal. Commun., 2011, 12, 673–677 CrossRef CAS.
- L. S. Ribeiro, N. Rey-Raap, J. L. Figueiredo, J. J. Melo Órfão and M. F. R. Pereira, Cellulose, 2019, 26, 7337–7353 CrossRef CAS.
- C. Liu, Z. Zhang, X. Zhai, X. Wang, J. Gui, C. Zhang, Y. Zhu and Y. Li, New J. Chem., 2019, 43, 3733–3742 RSC.
- Z. Zhou, J. Zhang, J. Qin, D. Li and W. Wu, Russ. J. Phys. Chem. A, 2018, 92, 456–465 CrossRef CAS.
- S. Li, Y. Zan, Y. Sun, Z. Tan, G. Miao, L. Z. Kong and Y. Sun, J. Energy Chem., 2019, 28, 101–106 CrossRef.
- M. Rivière, N. Perret, D. Delcroix, A. Cabiac, C. Pinel and M. Besson, Catalysts, 2018, 8, 331 CrossRef.
- M. Rivière, N. Perret, D. Delcroix, A. Cabiac, C. Pinel and M. Besson, ACS Sustainable Chem. Eng., 2018, 6, 4076–4085 CrossRef.
- R. Sun, T. Wang, M. Zheng, W. Deng, J. Pang, A. Wang, X. Wang and Z. Tao, ACS Catal., 2015, 5, 874–883 CrossRef CAS.
- X. Wang, A. K. Beine, P. J. C. Hausoul and R. Palkovits, ChemCatChem, 2019, 11, 4123–4129 CrossRef CAS.
- O. V. Manaenkov, O. V. Kislitsa, V. G. Matveeva, E. M. Sulman, M. G. Sulman and L. M. Bronstein, Front. Chem., 2019, 7, 834 CrossRef PubMed.
- X. F. Cao, Q. Zhang, D. Jiang, Q. Y. Liu, L. L. Ma, T. J. Wang and D. B. Li, Chin. J. Chem. Phys., 2015, 28, 338–344 CrossRef CAS.
- X. Chen, X. Wang, S. Yao and X. Mu, Catal. Commun., 2013, 39, 86–89 CrossRef CAS.
- Q. Mu and Y. Wang, J. Alloys Compd., 2011, 509, 396–401 CrossRef CAS.
- C. Sun, G. Xiao, H. Li and L. Chen, J. Am. Ceram. Soc., 2007, 90, 2576–2581 CrossRef CAS.
- C. Montassier, D. Giraud and J. Barbier, in Studies in Surface Science and Catalysis, ed. M. Guisnet, J. Barrault, C. Bouchoule, D. Duprez, C. Montassier and G. Pérot, Elsevier, 1988, vol. 41, pp. 165–170 Search PubMed.
Footnotes |
| † Electronic supplementary information (ESI) available. See DOI: 10.1039/c9ra10394e |
| ‡ Dr Chiliu Cai and Dr Haiyong Wang contributed equally to this work. |
| This journal is © The Royal Society of Chemistry 2020 |