 Open Access Article
The structure and self-regeneration performance of Salix psammophila-activated carbon modified by Ag and N co-doped TiO2†
Wenjing Liu‡
 * and
Zhen Lang‡
College of Materials Science and Art Design, Inner Mongolia Agricultural University, Hohhot 010018, China. E-mail: wenjing-1999@163.com
First published on 22nd January 2020
Abstract
In this study, Salix psammophila activated carbon (AC) was modified by immersing it in an AgNO3 solution and coating it with an N-doped TiO2 film to improve its self-regeneration performance in visible light. Ag+ was adsorbed and reduced to Ag nanoparticles by AC. Ti element only existed as Ti4+, and N element was incorporated into TiO2 mainly in the form of interstitial nitrogen. The photodegradation of Ag-N-TiO2-AC (AC coated with Ag and N co-modified TiO2) was enhanced under visible light irradiation because of its three inherent structures: (1) Ag and N co-modified TiO2 had a smaller average crystal size; (2) with a low bandgap (1.59 eV), the photoresponse region of Ag and N co-modified TiO2 was greatly extended; (3) the lifetime of the photogenerated holes was increased. With the increase in the AgNO3 dosage, the Ag-N-TiO2-AC photodegradation increased, while its adsorption decreased. Because of these synergistic effects, 0.05Ag-0.1N-TiO2-AC (where 0.05 is the dosage of AgNO3, g) presented the best self-regeneration performance under visible light irradiation.
1. Introduction
Activated carbon (AC) is a known adsorbent that has received considerable attention in recent decades due to its well-developed pore structure.1,2 As fossil fuels are being continuously exhausted, increasing numbers of researchers have focused on studies of biomass-derived AC due to its environmentally friendly, renewable and low-cost characteristics.3 Salix psammophila (SP) is a desert perennial shrub, which grows widely in arid and semi-arid areas of Northern China.4 Because of its allometric characteristics, it must be cut down at intervals of 3 to 5 years.5 Therefore, the available SP resources are great. Preparation of AC using SP as a raw material is a promising process for improving SP utilization and decreasing the cost of AC.AC mainly adsorbs species by physical action. Once AC is saturated with the adsorptive species, the carbon is mostly discarded in landfills. Therefore, regeneration of saturated AC is indispensable to minimize operational costs and product waste. Several methods have been developed to regenerate AC. These include thermal, electrochemical, microbiological, chemical, microwave, and photocatalytic methods.6,7 Photocatalytic regeneration presents great superiority because of its features of low cost and less secondary pollution. Moreover, photocatalytic regeneration can achieve self-regeneration of AC by simultaneously conducting photocatalytic degradation and adsorption.8
TiO2 is an excellent photocatalyst which is usually used for photocatalytic regeneration of AC.9 Unfortunately, the TiO2 photocatalytic reaction is confined to the ultraviolet light region; only about 5% of the energy in the solar spectrum can be utilized.10 Meanwhile, the rapid electron–hole recombination rate of TiO2 results in low photocatalytic activity.11 To overcome these drawbacks, TiO2 can be modified by doping with non-metal or metal elements.12 N as a non-metal doped element is quite encouraging due to its comparable atomic size, small ionization energy and stability.13 Compared with Au and Pt, Ag has proven to be a good candidate metal element because of its low cost. Researchers have validated that both the optical and electronic properties of TiO2 can be enhanced by embedded Ag nanoparticles.14,15
In order to further improve the photocatalytic activity of modified TiO2, the content of doped element can be increased. However, a high content of non-metal elements provides additional doping sites to trap carriers and thus inhibits the photocatalytic degradation response. Similarly, excess metal tends to form new recombination centers, thereby restraining the transport of photogenerated carriers. For example, localized mid-gap states in N-doped TiO2 can decrease its oxidation power of photogenerated holes in comparison with that of pristine TiO2.16 More recently, in order to minimize the previously mentioned issue, co-doped TiO2 photocatalysts have been extensively investigated. Wu et al. found that the photocatalytic activities of monodoped TiO2-AC were significantly improved by N/La co-doping and N/Cu co-doping, respectively.17,18 However, few studies have focused on the study of AC modified with Ag and N co-doped TiO2 (Ag-N-TiO2).
In this work, Ag-N-TiO2 was used to modify SP-based AC to achieve its efficient self-regeneration under visible light irradiation. The self-regeneration of Ag-N-TiO2-AC was evaluated by testing its removal behavior of methylene blue (MB) under visible-light irradiation. The self-regeneration mechanism of Ag-N-TiO2-AC was interpreted by analyzing its structure and chemical functional groups.
2. Experimental
2.1 Materials
Salix psammophila was collected from Erdos in Inner Mongolia Autonomous Region, China. Prior to preparing the AC, the SP bark was peeled off. All reagents used in this study were of analytical grade. Silver nitrate (AgNO3) was purchased from Sinopharm Chemical Reagent Co., Ltd. (Beijing, China). Tetrabutyl titanate and acetic acid were acquired from Lynn Technology Development Co., Ltd. (Shanghai, China). Diethanolamine and anhydrous ethanol were purchased from Fuchen Chemical Reagent Factory (Tianjin, China). Methylene blue (MB) used as the simulated pollutant was obtained from Jinke Fine Chemicals Co., Ltd. (Tianjin, China).2.2 Preparation of activated carbon
SP with a cutting length of 9 cm was carbonized at 400 °C for 1 h. Subsequently, the produced char was pulverized and screened to a particle size of 50 to 80 mesh, then mixed with KOH and distilled water at a mass ratio of 1![[thin space (1/6-em)]](https://www.rsc.org/images/entities/char_2009.gif) :
:![[thin space (1/6-em)]](https://www.rsc.org/images/entities/char_2009.gif) 1.5
1.5![[thin space (1/6-em)]](https://www.rsc.org/images/entities/char_2009.gif) :
:![[thin space (1/6-em)]](https://www.rsc.org/images/entities/char_2009.gif) 23. After drying, the mixture was activated at 800 °C with a heating rate of 4 °C min−1 for 1 h. The obtained AC was washed with distilled water to neutral pH and dried at 100 °C for 12 h.
23. After drying, the mixture was activated at 800 °C with a heating rate of 4 °C min−1 for 1 h. The obtained AC was washed with distilled water to neutral pH and dried at 100 °C for 12 h.
2.3 Preparation of AC modified with Ag and N-doped TiO2
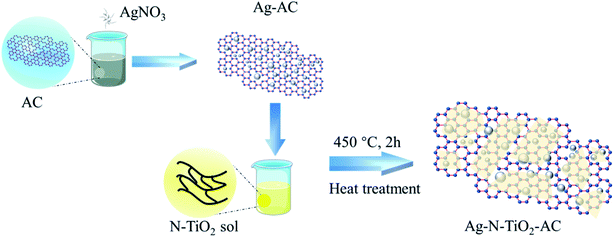
In the general procedure, as illustrated in Fig. 1, 1 g AC and 0.05 to 0.2 g AgNO3 powder were added to 50 ml distilled water at 25 °C. After stirring for 2 h, Ag+ was fully adsorbed by AC, and the obtained Ag-modified AC (Ag-AC) was dried at 100 °C for 12 h to remove water.20 g tetrabutyl titanate and 5 g diethanolamine were dissolved in 20 g ethanol with stirring for 5 min to obtain solution A. Subsequently, solution B containing 9.5 g ethanol, 0.4 g acetic acid, 1.5 g urea, and 6 g deionized water was slowly added to solution A with magnetic stirring at 25 °C. After the mixture was hydrolyzed for 1 h with magnetic stirring, the transparent N-doped TiO2 sol was obtained.
4 g prepared N-doped TiO2 sol was added dropwise to 1 g Ag-AC with vibration for 15 min. Finally, the mixture was dried at 100 °C for 12 h and calcined at 450 °C for 2 h to prepare Ag-AC coated with N-doped TiO2 film (Ag-N-TiO2-AC).
For the control experiments, AC was modified with TiO2, Ag-TiO2, and N-TiO2, respectively. For convenience, the resulting samples were denoted as nAg-mN-TiO2-AC (n-dosage of AgNO3, m-dosage of urea used in the TiO2 sol).
2.4 Characterization
The surface micromorphologies of the samples were observed by field emission scanning electron microscopy (FESEM, S-4800, Hitachi, Japan). Their elemental distributions in the selected area were detected by scanning electron microscopy coupled with an energy dispersive X-ray analyzer (EDXA, 550i, IXRF, USA).The crystal structures of the samples were measured by an X-ray diffractometer (XRD, XRD-6000, Shimadzu, Japan). Each sample was scanned using Cu Kα radiation with an operating voltage of 40 kV and an operating current of 30 mA. The scanning rate was 2° min−1 with a scanning step of 0.08° from 10° to 80° (2θ). The average crystal size (D) of TiO2 was calculated by Scherrer's formula (see eqn (1)) from its (101) reflection:
D = (0.89λ)/β![[thin space (1/6-em)]](https://www.rsc.org/images/entities/char_2009.gif) cos cos![[thin space (1/6-em)]](https://www.rsc.org/images/entities/char_2009.gif) θ θ
| (1) |
A UV-vis spectrometer (UV-3600, Shimadzu, Japan) was used to obtain UV-vis diffuse reflectance spectra (UV-vis-DRS) in the range of 200 to 800 nm, from which the energy bandgap (Eg) values were calculated according to eqn (2):
| αhν = A(hν − Eg)2 | (2) |
The surface chemical functional groups of the samples were examined with an X-ray photoelectron spectrometer (XPS, ESCALAB 250Xi, Thermo Fisher Scientific, USA). A monochromatic Al Kα X-ray was used as the excitation source. The survey scans were collected in the binding energy (BE) range of 0 to 1350 eV. XPSPEAK software was used to conduct the spectral deconvolution. A Shirley-type background was chosen and subtracted prior to quantification. After the baseline was subtracted, the curve fitting was performed with a fitting program based on an asymmetric Gaussian–Lorentzian sum function. The peak shape was optimized until an acceptable fit was obtained.
The nitrogen adsorption–desorption isotherms were measured using a surface area analyzer and a pore size analyzer (ASAP-2460, Micromeritics, USA). The total specific surface area (SBET) was calculated by the BET equation. The micropore area (Smicro) and micropore volume (Vmicro) were estimated using the t-plot method. The total pore volume (Vtotal) was based on the assumption that nitrogen filled the sample pores at a relative pressure (p/p0) of 0.995. The mesopore area/volume (Smeso/Vmeso) was calculated as the difference between the total pore area/volume and the micropore area/volume. The pore width distribution was determined by the DFT method.
2.5 Self-regeneration measurements
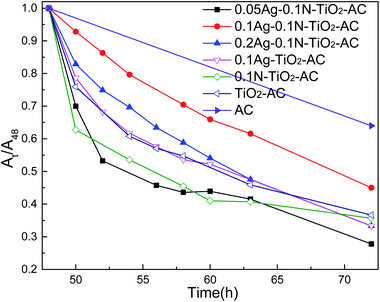
The self-regeneration properties of the samples were evaluated by adsorbing and degrading methylene blue (MB). For this, 0.04 g sample were dispersed in 100 ml MB solution with a concentration of 50 mg L−1. Prior to irradiation, the suspension was shaken at 25 °C for 48 h in the dark to ensure the adsorption–desorption equilibrium was reached. Subsequently, a 500 W Xe lamp was used as a light source to trigger the photocatalytic reaction. At a given irradiation time interval (as shown in Fig. 7), 4 ml suspension was collected and then filtered through a Millipore filter to separate the Ag-N-TiO2-AC. The absorbance of the MB concentration was measured by a UV-vis spectrophotometer (TU-1950, Beijing Purkinje General Instruments Co., Ltd., China) at λ = 664 nm. The self-regeneration properties were recorded by determining At/A48 (At refers to the absorbance of the MB solution at time t, and A48 refers to the absorbance of the MB solution after being adsorbed for 48 h in the dark).3. Results and discussion
3.1 Surface morphology and elemental distribution analyses
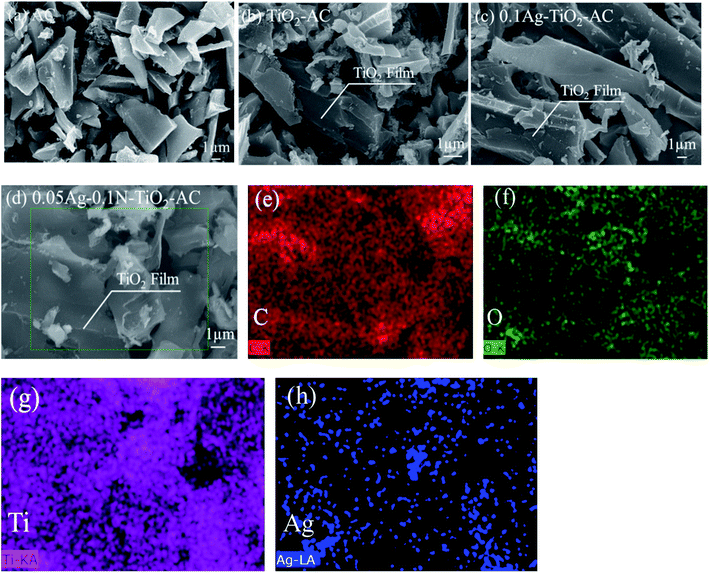
As shown in Fig. 2(a), the prepared AC exhibits a sheet morphology. From Fig. 2(b) and (c), it can be seen that nano-TiO2 films cover the AC surface. This result demonstrates that TiO2 was successfully loaded on the AC surface. In order to examine the elemental distribution, surface areas of AC were selected for analysis, as shown in Fig. 2(d). Fig. 2(e–h) display the C, O, Ti, and Ag element distributions, respectively. The distributions of C, Ti, and O elements are similar, suggesting that the TiO2 films are well-dispersed on the AC surface. However, the distribution of Ag element is relatively centralized. This indicates that Ag element readily agglomerates into Ag nanoparticles (AgNPs). When AC was immersed in the AgNO3 solution, Ag+ was adsorbed and reduced to metallic Ag by AC, which was also demonstrated by the XRD and XPS analyses. As the reduction proceeded, the metal nuclei migrated and aggregated together under interatomic forces, finally forming the AgNPs.193.2 Crystal structure
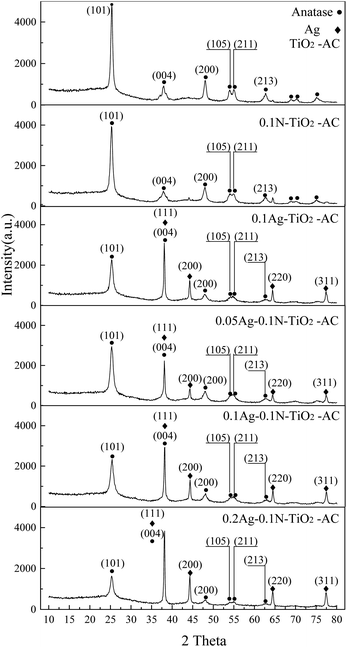
As shown in Fig. 3, the four diffraction peaks at 38.0°, 44.3°, 64.2°, and 77.2° are indexed to metallic Ag, corresponding to the (111), (200), (220), and (311) crystal plane reflections, respectively.20 This result demonstrates that Ag+ was reduced to well-crystallized metal Ag. In addition, the sharp diffraction peaks at 25.3°, 38.0°, 48.1°, 53.8°, 54.8°, and 62.8° are indexed to anatase TiO2, corresponding to the (101), (004), (200), (105), (211), and (213) crystal plane reflections, respectively.21,22 The average crystal size (D) of anatase TiO2 calculated by Scherrer's formula from the (101) reflection is shown in Table 1. Compared with pure TiO2, the modified TiO2 samples exhibit smaller crystal sizes. Meanwhile, the average crystal size of co-doped TiO2 is smaller than that of single-doped TiO2. Previous studies found that TiO2 with smaller crystal size was favorable for photocatalytic reactions.23 Therefore, it is inferred that co-doped TiO2 will have higher photocatalytic activity than pure and mono-doped TiO2.| Sample | Ti (101) | ||
|---|---|---|---|
| 2θ (°) | β (°) | D (nm) | |
| TiO2-AC | 25.3 | 0.509 | 15.839 |
| 0.1N-TiO2-AC | 25.2 | 0.634 | 12.713 |
| 0.1Ag-TiO2-AC | 25.3 | 0.776 | 10.388 |
| 0.05Ag-0.1N-TiO2-AC | 25.3 | 0.785 | 10.270 |
| 0.1Ag-0.1N-TiO2-AC | 25.4 | 0.845 | 9.543 |
| 0.2Ag-0.1N-TiO2-AC | 25.2 | 0.800 | 10.075 |
3.3 UV-vis-DRS analysis
Fig. 4(a) displays the UV-vis-DRS spectra of the samples. It was found that TiO2-AC exhibits a strong UV absorption, and its absorption edge appeared at ∼470 nm. After doping with N element, the absorption edge slightly shifts toward the visible light region. However, a remarkable red-shift is observed for Ag-N-TiO2-AC, and its absorption edge reaches 560 nm. This is because the AgNPs developed plasmon excitation at their outermost surfaces in contact with the host TiO2 network. As a consequence, strong interactions occurred between light and the AgNPs, inducing a collective oscillation of the surface conduction electrons and a characteristic absorption in the visible light region.24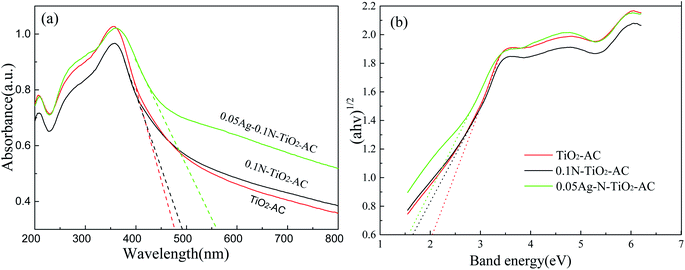 | ||
| Fig. 4 (a) UV-vis-DRS spectra and (b) band energies of TiO2-AC, 0.1N-TiO2-AC, and 0.05Ag-0.1N-TiO2-AC. | ||
The bandgap was determined by the Kubelka–Munk function, and the result is shown in Fig. 4(b). The band gap of TiO2 is 2.03 eV, which is lower than that of the reported anatase TiO2 (3.20 eV)25 due to the C doping. After N and Ag doping, the band gap value was found to be as low as 1.68 eV (0.1N-TiO2-AC) and 1.59 eV (0.05Ag-0.1N-TiO2-AC), respectively. The incorporation of N into the TiO2 lattice led to the formation of a new mid gap energy state, which eventually decreased the band gap of TiO2.13 The modes of N doping in the TiO2 lattice include substitution and interstitial doping. Substitutional doping involves oxygen replacement, whereas interstitial doping involves the addition of N to the TiO2 lattice. A previous study indicated that the decrease of the bandgap obtained by substitutional doping was smaller than that achieved by interstitial doping.13 Therefore, it is inferred that the incorporation of N into the TiO2 lattice in this study occurred via interstitial means, which was also verified by the XPS analysis. Moreover, Ag doping resulted in an increase of electron density in the structure at an energy lower than the conduction level of TiO2. With sufficient electron density, the electrons behaved as a new conduction band, leading to a decrease of the bandgap energy.26 Therefore, the band gap of 0.05Ag-0.1N-TiO2-AC is the lowest, and the synergistic effect of Ag and N will effectively improve its photocatalytic performance under visible light irradiation.
3.4 Surface functional group analysis
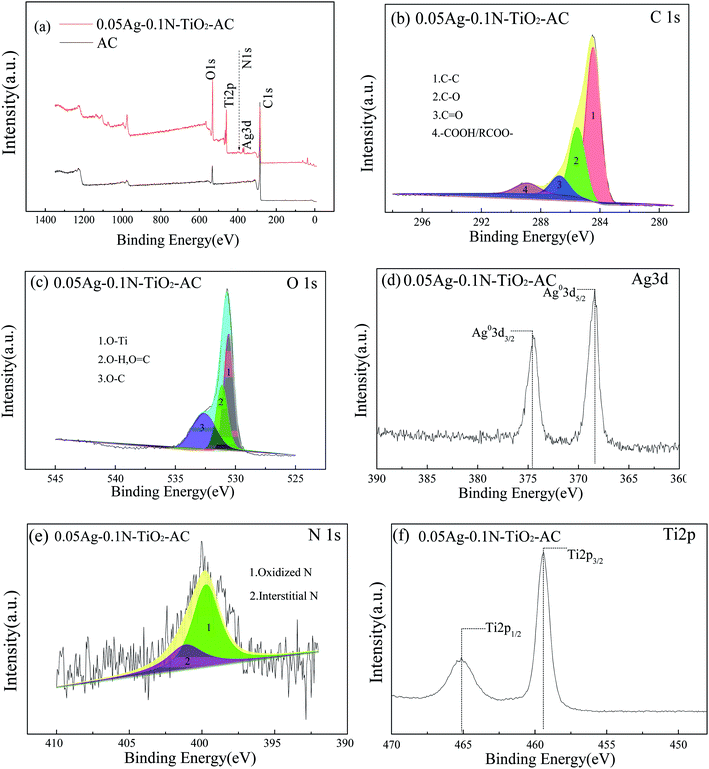
The full XPS spectra of the samples are shown in Fig. 5(a). Signals of C and O elements are displayed in the survey spectrum for AC, and other characteristic peaks of Ti, Ag and N elements can be found for 0.05Ag-0.1N-TiO2-AC. The high resolution spectra are shown in Fig. 5(b–f), and the results of the fitting of the C1s, O1s and N1s regions are shown in Table 2.| Sample | C1s (%) | O1s (%) | N1s (%) | ||||||
|---|---|---|---|---|---|---|---|---|---|
| Graphite | C–O | C![[double bond, length as m-dash]](https://www.rsc.org/images/entities/char_e001.gif) O O |
–COOH | O–Ti | O![[double bond, length as m-dash]](https://www.rsc.org/images/entities/char_e001.gif) C C |
O–C | Oxidized N | Interstitial N | |
| RCOO– | O–H | ||||||||
| AC | 70.25 | 16.45 | 5.86 | 7.44 | 0 | 25.06 | 74.94 | — | — |
| TiO2-AC | 62.17 | 24.64 | 4.70 | 8.49 | 47.37 | 28.42 | 24.21 | — | — |
| 0.1N-TiO2-AC | 60.34 | 24.58 | 6.24 | 8.84 | 46.63 | 28.89 | 24.48 | 68.01 | 31.99 |
| 0.1Ag-TiO2-AC | 52.95 | 29.71 | 8.25 | 9.09 | 45.74 | 27.64 | 26.62 | — | — |
| 0.05Ag-0.1N-TiO2-AC | 57.28 | 27.58 | 8.63 | 6.51 | 46.14 | 28.74 | 25.12 | 68.19 | 31.81 |
| 0.1Ag-0.1N-TiO2-AC | 53.36 | 28.91 | 8.41 | 9.32 | 44.27 | 28.59 | 27.14 | 68.31 | 31.78 |
| 0.2Ag-0.1N-TiO2-AC | 51.59 | 30.89 | 8.18 | 9.34 | 41.73 | 29.18 | 29.09 | 68.52 | 31.48 |
The C1s spectra were deconvoluted into four peaks, corresponding to C–C (284.5 eV), C–O (285.5 eV), C![[double bond, length as m-dash]](https://www.rsc.org/images/entities/char_e001.gif) O (286.7 eV) and –COOH (288.9 eV).27 Graphitic carbon was the predominant component in all the samples. After modification, the content of graphitic carbon decreased, while the contents of C–O and C
O (286.7 eV) and –COOH (288.9 eV).27 Graphitic carbon was the predominant component in all the samples. After modification, the content of graphitic carbon decreased, while the contents of C–O and C![[double bond, length as m-dash]](https://www.rsc.org/images/entities/char_e001.gif) O greatly increased. This is because some of the graphitic carbon was oxidized during the process of loading the TiO2 films and AgNPs. The hydroxyl groups on the surface of TiO2, originating from the reaction between adsorbed H2O and TiO2, such as H2O + Ti–O–Ti → 2Ti–OH,28 could trap the photogenerated holes (h+) to produce hydroxyl radicals with very strong oxidizing properties. Some graphitic carbon was involved in this oxidization reaction, leading to an increment of the C–O content. More hydroxyl radicals were produced in the 0.1N-TiO2-AC sample; thus, its graphitic carbon content was lower than that of TiO2-AC. When AC was immersed in the AgNO3 solution, with the transition from Ag+ to Ag0, water attacked the intermediate radical cations formed to produce C–O at locations where ortho or para dihydroxy groups were present. As the reaction continued, the C–O groups on catechol and hydroquinone were oxidized to generate C
O greatly increased. This is because some of the graphitic carbon was oxidized during the process of loading the TiO2 films and AgNPs. The hydroxyl groups on the surface of TiO2, originating from the reaction between adsorbed H2O and TiO2, such as H2O + Ti–O–Ti → 2Ti–OH,28 could trap the photogenerated holes (h+) to produce hydroxyl radicals with very strong oxidizing properties. Some graphitic carbon was involved in this oxidization reaction, leading to an increment of the C–O content. More hydroxyl radicals were produced in the 0.1N-TiO2-AC sample; thus, its graphitic carbon content was lower than that of TiO2-AC. When AC was immersed in the AgNO3 solution, with the transition from Ag+ to Ag0, water attacked the intermediate radical cations formed to produce C–O at locations where ortho or para dihydroxy groups were present. As the reaction continued, the C–O groups on catechol and hydroquinone were oxidized to generate C![[double bond, length as m-dash]](https://www.rsc.org/images/entities/char_e001.gif) O.8 The reaction formulas are shown in eqn (3)–(5). Therefore, the C–C content of nAg-mN-TiO2-AC was lowest. Moreover, as the dosage of AgNO3 rose, increasing graphitic carbon was oxidized to C–O groups.
O.8 The reaction formulas are shown in eqn (3)–(5). Therefore, the C–C content of nAg-mN-TiO2-AC was lowest. Moreover, as the dosage of AgNO3 rose, increasing graphitic carbon was oxidized to C–O groups.
| –C–H + Ag+ + H2O → –C–OH + Ag0 + H+ | (3) |
–C–OH + Ag+ + H2O → –C![[double bond, length as m-dash]](https://www.rsc.org/images/entities/char_e001.gif) O + Ag0 + H+ O + Ag0 + H+
| (4) |
–C–H + Ag+ + H2O → –C![[double bond, length as m-dash]](https://www.rsc.org/images/entities/char_e001.gif) O + Ag0 + H+ O + Ag0 + H+
| (5) |
Two types of oxygen functional groups were found on AC; the peak at 531.5 eV corresponds to the O![[double bond, length as m-dash]](https://www.rsc.org/images/entities/char_e001.gif) C/O–H group, and the peak at 532.8 eV corresponds to the O–C group. O–C is the main component, which is consistent with the result of the C1s peaks. After modification, the O1s spectra can be divided into three peaks positioned at 530.4, 531.3 and 532.6 eV, corresponding to O–Ti, O
C/O–H group, and the peak at 532.8 eV corresponds to the O–C group. O–C is the main component, which is consistent with the result of the C1s peaks. After modification, the O1s spectra can be divided into three peaks positioned at 530.4, 531.3 and 532.6 eV, corresponding to O–Ti, O![[double bond, length as m-dash]](https://www.rsc.org/images/entities/char_e001.gif) C/O–H, and O–C, respectively.29,30 O–Ti became the main component for modified AC. Simultaneously, the O–C group content greatly decreased, while that of O
C/O–H, and O–C, respectively.29,30 O–Ti became the main component for modified AC. Simultaneously, the O–C group content greatly decreased, while that of O![[double bond, length as m-dash]](https://www.rsc.org/images/entities/char_e001.gif) C/O–H slightly increased. This is because the O–C groups mainly originate from the AC surface, while the O
C/O–H slightly increased. This is because the O–C groups mainly originate from the AC surface, while the O![[double bond, length as m-dash]](https://www.rsc.org/images/entities/char_e001.gif) C/O–H groups are distributed in the TiO2 and AC surfaces.25 Moreover, the O–C group content slightly increased with increasing dosage of AgNO3, which is in good agreement with the previous result for the C1s spectra.
C/O–H groups are distributed in the TiO2 and AC surfaces.25 Moreover, the O–C group content slightly increased with increasing dosage of AgNO3, which is in good agreement with the previous result for the C1s spectra.
As shown in Fig. 5(d), two individual peaks observed at 374.5 and 368.5 eV are in accord with Ag3d3/2 and Ag3d5/2, indicating that the AgNPs mainly exist in the zero-valence form.31 These results are consistent with the XRD results.
Fig. 5(e) displays the N1s spectrum, which is fitted into two peaks at 399.3 eV and 401.1 eV, respectively. The peak at 399.3 eV is generally ascribed to oxidized nitrogen, such as Ti–O–N bonding. The peak at 401.1 eV is assigned to interstitial nitrogen.32 Therefore, it is concluded that the N-doped element is incorporated into TiO2 mainly in the form of interstitial nitrogen, and there is little substitutional nitrogen.
As shown in Fig. 5(f), two peaks were observed at around 465.1 and 459.4 eV, corresponding to the binding energies of Ti2p1/2 and Ti2p3/2.33 The peak position of nAg-0.1N-TiO2-AC is the same as that of TiO2-AC (see Fig. S1†), which implies that Ti element exists in the form of Ti4+.
3.5 Pore structure
N2 adsorption–desorption isotherms of all the samples are shown in Fig. 6(a). At low relative pressure, the N2 adsorption increases sharply, suggesting the presence of a large number of micropores, while the appearance of hysteresis behavior during the N2 adsorption–desorption process indicates the existence of mesopores.34 The detailed pore structure parameters calculated from the N2 adsorption–desorption isotherms are listed in Table 3. As expected, the micropore ratios in all the samples were significantly higher than those of the mesopores. Also, some differences were apparent in the different samples. The specific surface area (S) and pore volume (V) of AC are larger than those of the other samples; this demonstrates that all the modifying agents, including TiO2, N and Ag, can lead to decreases of S and V. This is because these modifying agents with few pores block some of the pores in AC. Except for 0.2Ag-0.1N-TiO2-AC, the Smeso and Vmeso values of the modified AC samples were similar to each other; meanwhile, Smicro and Vmicro sharply declined with increasing addition type and dosage. This result implies that N and the AgNPs preferred to fill the micropores. As the AgNO3 dosage increased, the formed AgNP size increased. Thus, the mesopores of 0.2Ag-0.1N-TiO2-AC decreased due to the increasing AgNP blocking.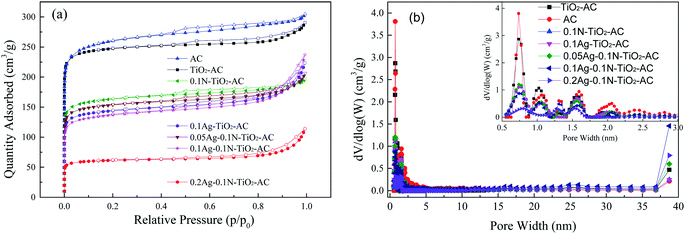 | ||
| Fig. 6 (a) Nitrogen adsorption–desorption isotherms of the samples; (b) pore width distributions of the samples. | ||
| Sample | Total pores | Micropores | Mesopores | |||
|---|---|---|---|---|---|---|
| SBET | Vtotal | Smicro | Vmicro | Smeso | Vmeso | |
| AC | 1082 | 0.479 | 876 | 0.337 | 206 | 0.142 |
| TiO2-AC | 898 | 0.399 | 793 | 0.312 | 105 | 0.087 |
| 0.1N-TiO2-AC | 632 | 0.289 | 520 | 0.204 | 112 | 0.086 |
| 0.1Ag-TiO2-AC | 465 | 0.294 | 363 | 0.178 | 102 | 0.116 |
| 0.05Ag-0.1N-TiO2-AC | 588 | 0.288 | 484 | 0.192 | 104 | 0.096 |
| 0.1Ag-0.1N-TiO2-AC | 525 | 0.301 | 415 | 0.163 | 110 | 0.137 |
| 0.2Ag-0.1N-TiO2-AC | 239 | 0.136 | 203 | 0.080 | 36 | 0.056 |
The pore width distributions obtained from the isotherms are displayed in Fig. 6(b). Most of the pores of the samples are positioned in the range of 0.5 to 2 nm, while fewer mesopores were found in the range of 2 to 3 nm. This result is in good agreement with the previous analysis of the N2 adsorption–desorption isotherms. After modification, the volumes of pores in the range of 0.5 to 0.8 nm dramatically decreased, while the pores distributed in the range of 0.8 to 3 nm also decreased to some extent.
3.6 Self-regeneration performance
Fig. 7 shows the self-regeneration performance of the samples under visible light irradiation. As the light irradiation time was prolonged, more MB was removed by all the samples. As expected, AC almost reached saturated adsorption after 48 h dark adsorption, and only 30% MB was removed by AC as the adsorption time was prolonged from 48 h to 72 h. Otherwise, the modified AC maintained a higher MB removal effect in this period. These results demonstrate that the modified AC shows self-regeneration performance under visible light irradiation. TiO2-AC exhibited a certain amount of self-regeneration, and its MB removal ratio reached 60% after 24 h of visible light irradiation. There are three reasons for this: firstly, the wavelength of the Xe lamp used as the light source is 280 to 980 nm, which includes part of the ultraviolet light region, and triggered the photocatalytic reaction of TiO2; secondly, the well-developed pore structure of TiO2-AC could increase the MB concentration of the surrounding TiO2 and facilitate MB photodegradation; thirdly, C element was doped into TiO2 during the TiO2-AC synthesis. After doping with N or Ag, the MB removal effects were slightly improved due to the increased photocatalytic activities and the decreased adsorption properties. The comparison of 0.1N-TiO2-AC and 0.1Ag-TiO2-AC shows that the self-regeneration performance of the former was higher in the period from 48 to 63 h because of the developed pore structure. The self-regeneration performance of co-doped TiO2-AC was further improved. 0.05Ag-0.1N-TiO2-AC represented the highest self-regeneration performance, and its MB removal ratio reached 73% after 24 h of visible light irradiation. However, with increasing AgNO3 dosage, the MB removal ratio of nAg-0.1N-TiO2-AC decreased initially and then increased. This result was determined by their variations of photodegradation and adsorption. As the AgNO3 dosage rose, the MB removal curve slope of nAg-0.1N-TiO2-AC in Fig. 7 gradually increased, which demonstrated that the photodegradation was enhanced. Meanwhile, the pore structure analysis indicates that the adsorption of nAg-0.1N-TiO2-AC decreased with increasing AgNO3 dosage, which weakened the synergistic effects of adsorption and photodegradation. Therefore, the self-regeneration performance of nAg-0.1N-TiO2-AC varied according to the previously described trend.3.7 Self-regeneration mechanism
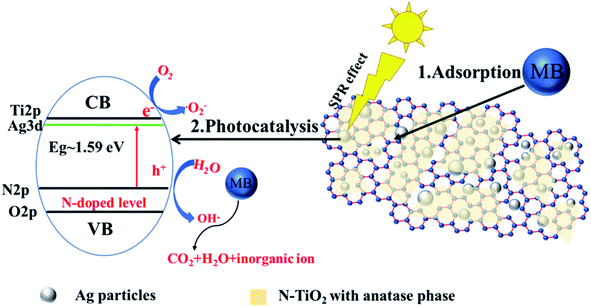
Fig. 8 illustrates the probable self-regeneration mechanism of Ag-N-TiO2-AC under visible light irradiation. AgNPs were distributed in the AC pores, and the N-doped TiO2 films covered them. The self-regeneration performance of Ag-N-TiO2-AC was determined by the synergistic effects of two factors: adsorption and photodegradation. The developed pore structure of Ag-N-TiO2-AC could increase the concentration of MB surrounding TiO2 and facilitate the MB photodegradation. MB was degraded into micromolecules by the photocatalytic reaction of TiO2. The holes generated in the valence band of TiO2 were scavenged by OH− ions to generate highly oxidative species, such as hydroxyl radicals (OH˙), which are highly reactive and were responsible for the degradation and mineralization of MB.13 After photodegradation, the blocked pores were released, and AC self-regeneration was thus achieved.Both the TiO2 photocatalytic activity and optical response region were improved by Ag and N modification. The AgNPs developed plasmon excitations at their outermost surfaces in contact with the host TiO2 network. As a consequence, there were strong interactions between light and the AgNPs, inducing a collective oscillation of the surface conduction electrons.24 The electron density in the structure in the energy region lower than the conduction level of TiO2 was increased. With sufficient electron density, the electrons behaved as the conduction band, leading to a decrease of the bandgap energy.26 Furthermore, the AgNPs promoted interfacial charge-transfer processes.24 More photoelectrons were removed to the conduction level of TiO2 and finally consumed by the adsorbed oxygen on the surface to yield highly oxidative species, such as superoxide radical anions. This process increased the lifetime of the holes, leading to the redox reactions required for MB degradation. The N doping enhanced the visible light response upon decreasing the band gap of TiO2 by creating a N-induced midgap level,35 which was demonstrated by XPS analysis. The combination of AgNPs and N decreased the band gap of TiO2 to 1.59 eV, greatly improving the photocatalytic performance of TiO2 under visible light irradiation.
4. Conclusion
In order to improve the self-regeneration performance of SP-based AC under visible light irradiation, Ag and N-doped TiO2 were loaded on AC, respectively. Ag+ was reduced and agglomerated into AgNPs, which were coated by the N-doped TiO2 film. Ti element only existed as Ti4+, and N element was incorporated into TiO2 mainly in the form of interstitial nitrogen. The average crystal size of anatase TiO2 greatly decreased after co-modification. With a low bandgap (1.59 eV), the photoresponse region of Ag and N co-modified TiO2 was greatly extended, and the lifetime of the photogenerated holes was increased. Therefore, the photodegradation of Ag-N-TiO2-AC was superior to that of Ag-TiO2-AC, N-TiO2-AC and TiO2-AC. Meanwhile, the photodegradation of Ag-N-TiO2-AC was enhanced with increasing AgNO3 dosage, while its adsorption decreased. Because of the synergistic effects of adsorption and photodegradation, 0.05Ag-0.1N-TiO2-AC presented the highest self-regeneration performance.Conflicts of interest
There are no conflicts to declare.Acknowledgements
This research is supported by the National Natural Science Foundation of China (31960292) and University of Young Scientific and Technological Backbone (2017XQG-1).References
- X. F. Li, Q. Xu, Y. Fu and Q. X. Guo, Environ. Prog. Sustainable Energy, 2014, 33, 519–526 CrossRef CAS.
- D. Angin, Bioresour. Technol., 2014, 168, 259–266 CrossRef CAS PubMed.
- Y. Huang and G. Zhao, Holzforschung, 2016, 70, 195–202 CAS.
- J. Li, H. Jia, X. Han, J. Zhang, P. Sun, M. Lu and J. Hu, Front. Plant Sci., 2016, 7, 1505 Search PubMed.
- X. Liu, Y. Wan, P. Liu, L. Zhao and W. Zou, Water Sci. Technol., 2018, 77, 2555–2565 CrossRef CAS PubMed.
- P. Lu, H. Lin, W. Yu and J. Chern, J. Taiwan Inst. Chem. Eng., 2011, 42, 305–311 CrossRef CAS.
- M. El Gamal, H. A. Mousa, M. H. El-Naas, R. Zacharia and S. Judd, Sep. Purif. Technol., 2018, 197, 345–359 CrossRef CAS.
- W. Liu, W. Han, M. Zhang and Z. Guo, Polymers, 2019, 11, 983 CrossRef CAS PubMed.
- M. Liu, J. Zheng, Q. Liu, S. Xu, M. Wu, Q. Xue, Z. Yan, H. Xiao, Z. Wei and H. Zhu, RSC Adv., 2013, 3, 9483 RSC.
- S. Y. Mendiola-Alvarez, J. L. Guzman-Mar, G. Turnes-Palomino, F. Maya-Alejandro, A. Hernandez-Ramirez and L. Hinojosa-Reyes, Environ. Sci. Pollut. Res. Int., 2017, 24, 12673–12682 CrossRef CAS PubMed.
- Z. Jiang, W. Wei, D. Mao, C. Chen, Y. Shi, X. Lv and J. Xie, Nanoscale, 2015, 7, 784 RSC.
- E. Kowalska, Z. Wei, B. Karabiyik, A. Herissan, M. Janczarek, M. Endo, A. Markowska-Szczupak, H. Remita and B. Ohtani, Catal. Today, 2015, 252, 136–142 CrossRef CAS.
- S. A. Ansari, M. M. Khan, M. O. Ansari and M. H. Cho, New J. Chem., 2016, 40, 3000–3009 RSC.
- Z. Jiang, X. Lv, D. Jiang, J. Xie and D. Mao, J. Mater. Chem. A, 2013, 1, 14963 RSC.
- J. Yu, J. Xiong, B. Cheng and S. Liu, Appl. Catal., B, 2005, 60, 211–221 CrossRef CAS.
- H. Chen, L. Wang, L. Guan, H. Ren, Y. Zhang and J. Tao, Surf. Interface Anal., 2018, 50, 146–153 CrossRef CAS.
- D. Liu, Z. Wu, F. Tian, B. Ye and Y. Tong, J. Alloys Compd., 2016, 676, 489–498 CrossRef CAS.
- F. Tian, Z. Wu, Y. Yan, B. Ye and D. Liu, Nanoscale Res. Lett., 2016, 11, 1–10 CrossRef CAS PubMed.
- W. Liu and G. Zhao, Polym. Compos., 2017, 38, 1404–1411 CrossRef CAS.
- Y. Ao, J. Xu, Y. Gao, P. Wang, C. Wang, J. Hou and J. Qian, Catal. Commun., 2014, 53, 21–24 CrossRef CAS.
- M. Li, B. Lu, Q. Ke, Y. Guo and Y. Guo, J. Hazard. Mater., 2017, 333, 88–98 CrossRef CAS PubMed.
- R. R. Bhosale, S. R. Pujari, M. K. Lande, B. R. Arbad, S. B. Pawar and A. B. Gambhire, Appl. Surf. Sci., 2012, 261, 835–841 CrossRef CAS.
- W. Liu and G. Zhao, Surf. Interface Anal., 2015, 47, 931–937 CrossRef CAS.
- J. Vargas Hernández, S. Coste, A. García Murillo, F. Carrillo Romo and A. Kassiba, J. Alloys Compd., 2017, 710, 355–363 CrossRef.
- J. Zhang, Y. Li, L. Li, W. Li and C. Yang, ACS Sustainable Chem. Eng., 2018, 6, 12893–12905 CrossRef CAS.
- O. Jongprateep, K. Meesombad, R. Techapiesancharoenkij and K. Surawathanawises, Ceram. Int., 2018, 44, 228–232 CrossRef.
- C. L. Weitzsacker, M. Xie and L. T. Drzal, Surf. Interface Anal., 1997, 25, 53–63 CrossRef CAS.
- C. Su, B. Y. Hong and C. M. Tseng, Catal. Today, 2004, 96, 119–126 CrossRef CAS.
- S. Park and W. Jung, J. Colloid Interface Sci., 2002, 250, 93–98 CrossRef CAS PubMed.
- S. S. Boxi and S. Paria, RSC Adv., 2015, 5, 37657–37668 RSC.
- X. Zhang, M. Zhou and L. Lei, Mater. Chem. Phys., 2005, 91, 73–79 CrossRef CAS.
- X. Wang, K. Zhang, X. Guo, G. Shen and J. Xiang, New J. Chem., 2014, 38, 6139–6146 RSC.
- P. Yap and T. Lim, Appl. Catal., B, 2011, 101, 709–717 CrossRef CAS.
- Z. Jiang, W. Wei, D. Mao, C. Chen, Y. Shi, X. Lv and J. Xie, Nanoscale, 2015, 7, 784 RSC.
- Y. Cong, J. Zhang, F. Chen and M. Anpo, J. Phys. Chem. C, 2007, 111, 6976–6982 CrossRef CAS.
Footnotes |
| † Electronic supplementary information (ESI) available: Fig. S1 high resolution spectrum of Ti2p for the TiO2-AC sample. See DOI: 10.1039/c9ra10305h |
| ‡ W. L. and Z. L. contributed equally. |
| This journal is © The Royal Society of Chemistry 2020 |

