 Open Access Article
Principle understanding towards synthesizing Fe/N decorated carbon catalysts with pyridinic-N enriched and agglomeration-free features for lithium–oxygen batteries†
Gangning Zhang abc,
Li Zhangbc,
Shangqian Zhao*bc,
Shigang Lu*abc,
Yan Lud,
Haobo Sunbc and
Lve Wangbc
aNational Power Battery Innovation Center, Grinm Group Corpration Limited (GRINM), No. 2 Xinjiekou Wai Street, Xicheng District, Beijing, 100088, PR China. E-mail: lusg8867@163.com
bChina Automotive Battery Research Institute Co. Ltd, No. 11 Xingke Dong Street, Yanqi Economic Development Zone, Huairou District, Beijing, 101407, PR China. E-mail: zhaosq@glabat.com
cGeneral Research Institute for Nonferrous Metals, No. 2 Xinjiekou Wai Street, Xicheng District, Beijing 100088, PR China
dDepartment of Physics, School of Sciences, Nanchang University, Nanchang, Jiangxi 330031, PR China
First published on 22nd January 2020
Abstract
Metal-N-decorated carbon catalysts are cheap and effective alternatives for replacing the high-priced Pt-based ones in activating the reduction of oxygen for metal–air or fuel cells. The preparation of such heterogeneous catalysts often requires complex synthesis processes, including harsh acid treatment, secondary pyrolysis processes, etching, etc., to make the heteroatoms evenly dispersed in the carbon substrates to obtain enhanced activities. Through combined experimental characterizations, we found that by precise control of the precursors added, a Fe/N uniformly distributed, agglomeration-free Fe/N decorated Super-P carbon material (FNDSP) can be easily obtained by a one-pot synthesis process with distinctly higher pyridinic-N content and elevated catalytic activity. An insight into this phenomenon was carefully demonstrated and also verified in Li–O2 batteries, which delivered a high discharging platform of 2.85 V and can be fully discharged with a capacity of 5811.5 mA h gcarbon+catalyst−1 at the cut-off voltage of 2.5 V by the low-cost Super-P modified catalyst.
1. Introduction
At present, increasing the energy density of batteries is an important measure to resolve people's anxiety about the electric mileage range of new energy vehicles, and it has become a research hotspot and a pressing problem world-wide. Secondary Li–O2 chemistries have been extensively investigated as potential alternatives to conventional Li ion batteries owing to their ultrahigh energy density (the practical value can reach 1700 W h kg−1).1–3 However, Li–O2 batteries often exhibit a giant overpotential because of the sluggish cathode reaction kinetics on catalyzing the formation and decomposition of the approximately insulating discharging product Li2O2, especially by using pure carbon materials.4–6 In addition, the large overpotential is harmful in that it can trigger a series of problems, such as electrolyte decomposition and carbon cathode corrosion, forming accumulated recalcitrant by-products in the pores of the cathode and resulting in a poor cycling performance of the battery.7–12 Designing more electro-chemical catalytically active cathode materials is therefore regarded as a pivotal limiting factor for Li–O2 batteries in catalyzing the oxygen reduction reaction (ORR)/oxygen evolution reaction (OER) process with a much lower overpotential and better cycling performance.5,6,8,13,14Heteroatom decorated carbon catalysts have been demonstrated to be promising towards the ORR process because non-carbon atom introduction can activate the binding affinity with oxygen species by tuning the electronic structure and creating more defect sites for the carbon matrix.15–17 Among these, carbon substrates with N-anchored metal catalysts (denoted as Me/N@C) have been explored and utilized in fuel cells for exchanging the expensive Pt@C materials for catalyzing the ORR process with competitive performances.18–20 Since the fuel cells and Li–O2 batteries share many similarities in terms of the ORR process, more and more researchers have also attempted to adapt them to catalyze ORR/OER processes for Li–O2 batteries.21 However, the nature of the catalytic activity,22 especially what function the metal plays in the synthesized material, is as yet controversial and not clear.23
Higher Me/N active site densities within the carbon matrix can offer more catalytic reaction positions on the surfaces inside the porous air-cathode for Li–O2 batteries, significantly reducing the cathode polarization and eliminating the occurrence of side products. Towards this end, we have screened and drawn lessons from several related previous studies, and found two interesting phenomena in different literature reports. One group of correlative reports showed that notable Fe-related crystal-phase particles formed and found that the particles were encapsulated in the carbon substrates when synthesizing Fe/N doped carbon catalysts,24–28 and the particle diameter usually exceeded approximately 10 nm, thus leaving the Fe species and N species comparatively isolated from each other in space. This may cause a loss of effective active sites, since catalytic reactions usually take place at the surface of the material instead of in the inner part of a large particle. Moreover, some complicated synthetic processes such as secondary high temperature pyrolysis and acid leaching are applied to purify the agglomerated metal particles, making this technique cumbersome for industrial scale production. In contrast, other research groups presented catalysts with Fe/N atomically and uniformly distributed in the carbon matrix,19,29–33 which showed no crystal phase formation based on their X-ray diffraction results. Furthermore, original correlation analyses through detailed experimental characterizations have been rarely discussed based on the two situations above, limiting the understanding of what guidance people should follow to obtain the optimized results. In summary, there is a general lack of a comprehensive study, as well as a comparative analysis, on the nature of the material catalytic activity towards these two phenomena. Furthermore, future Me/N@C catalyst optimization and design heavily relies on a mechanical understanding of the catalysis and also manufacturing engineering improvements. In this regard, there is still much pioneering and basic work based on principle understanding to be persistently fulfilled.15
In this work, we applied a very facile method and synthesized a series of FNDSP materials which can be classified based on two typical features corresponding to the Me/N@C catalysts reported in different literature. This paper revealed that Fe-based inorganic crystal particle agglomeration can lead to a decrease in catalytic activity. Fe-based particle agglomeration can be eliminated or obviously suppressed by precisely controlling the proportion of precursors and a much-enhanced catalytic activity of FNDSP materials with Fe/N evenly distributed in the carbon substrates can be obtained. The mechanism of the decrease in catalytic activity caused by agglomeration is analyzed. Through combined analysis, we found that the agglomeration of Fe-based particles will lead to the loss of N elements and particularly a decrease in the pyridinic-N proportion (considered to have the highest ORR catalytic activity among the N-containing functional groups12). The above findings were also verified in Li–O2 batteries to reflect the material performances in a real battery situation and the catalytic activity variation laws of the as-prepared FNDSP series coordinated well with the electrochemical performances of the batteries.
2. Experimental section
2.1. Synthesizing the FNDSP composite series
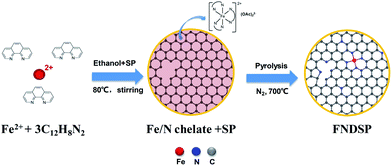
The precursor of 1,10-phenanthroline (phen), iron(II) acetate tetra-hydrate (FeAc2·4H2O), and SP carbon black were all of analytical grade. FeAc2·4H2O (95%) and phen (97%) were purchased from Shanghai Macklin Biochemical Co., Ltd and were used as-received without any further purification. We applied an easily-realizable one-pot pyrolysis method to synthesize the FNDSP catalysts (Fig. 1). Specifically, four groups of slurries are designed in our work. We fixed the molar ratio of the Fe precursor (iron(II) acetate) to N precursor (1,10-phenanthroline (phen)) at 1![[thin space (1/6-em)]](https://www.rsc.org/images/entities/char_2009.gif) :
:![[thin space (1/6-em)]](https://www.rsc.org/images/entities/char_2009.gif) 3 to form a stable clathrate (a sanguineous metallic ion complex ([Fe(C12H8N2)3]2+)), and assigned four molar ratios of Fe/N atoms to SP carbon atoms (the molar ratios of SP carbon atoms to phen nitrogen atoms being 10
3 to form a stable clathrate (a sanguineous metallic ion complex ([Fe(C12H8N2)3]2+)), and assigned four molar ratios of Fe/N atoms to SP carbon atoms (the molar ratios of SP carbon atoms to phen nitrogen atoms being 10![[thin space (1/6-em)]](https://www.rsc.org/images/entities/char_2009.gif) :
:![[thin space (1/6-em)]](https://www.rsc.org/images/entities/char_2009.gif) 1, 30
1, 30![[thin space (1/6-em)]](https://www.rsc.org/images/entities/char_2009.gif) :
:![[thin space (1/6-em)]](https://www.rsc.org/images/entities/char_2009.gif) 1, 50
1, 50![[thin space (1/6-em)]](https://www.rsc.org/images/entities/char_2009.gif) :
:![[thin space (1/6-em)]](https://www.rsc.org/images/entities/char_2009.gif) 1 and 70
1 and 70![[thin space (1/6-em)]](https://www.rsc.org/images/entities/char_2009.gif) :
:![[thin space (1/6-em)]](https://www.rsc.org/images/entities/char_2009.gif) 1) to carry out the investigation. The corresponding solution was stirred homogenously on a magnetic stirring apparatus for 2 h at 60 °C, and dried overnight in a drying cabinet at 80 °C. Then, the dried powder bulk was harvested and ground in a mortar. A ceramic boat was used to collect the obtained mixture and then sent to a pipe furnace and kept at a temperature of 700 °C for 0.5 h under a N2 atmosphere. After cooling to ambient temperature, the synthesized catalysts were sieved through a 400 mesh sieve, and the as-prepared materials (denoted as FNDSP-10, FNDSP-30, FNDSP-50, and FNDSP-70, respectively) were systematically characterized and manufactured as cathodes to run electrochemical performance tests in Li–O2 batteries. For comparison, an iron-free sample of NDSP powder was prepared using the same procedure described above with the molar ratio of SP carbon atoms to phen nitrogen atoms being 30
1) to carry out the investigation. The corresponding solution was stirred homogenously on a magnetic stirring apparatus for 2 h at 60 °C, and dried overnight in a drying cabinet at 80 °C. Then, the dried powder bulk was harvested and ground in a mortar. A ceramic boat was used to collect the obtained mixture and then sent to a pipe furnace and kept at a temperature of 700 °C for 0.5 h under a N2 atmosphere. After cooling to ambient temperature, the synthesized catalysts were sieved through a 400 mesh sieve, and the as-prepared materials (denoted as FNDSP-10, FNDSP-30, FNDSP-50, and FNDSP-70, respectively) were systematically characterized and manufactured as cathodes to run electrochemical performance tests in Li–O2 batteries. For comparison, an iron-free sample of NDSP powder was prepared using the same procedure described above with the molar ratio of SP carbon atoms to phen nitrogen atoms being 30![[thin space (1/6-em)]](https://www.rsc.org/images/entities/char_2009.gif) :
:![[thin space (1/6-em)]](https://www.rsc.org/images/entities/char_2009.gif) 1, and was labelled as NDSP-30.
1, and was labelled as NDSP-30.
2.2. Material characterization
X-ray photoelectron spectroscopy (XPS) was used to characterize the iron and nitrogen species of the synthesized FNDSP catalysts by using an X-ray photoelectron spectrometer (Thermo ESCALAB 250Xi) with Al Kα as the radiation source. The degree of carbon defects was investigated by Raman spectra and measured on a Horiba Jobin Yvon (HJY) Lab RAM Raman spectrometer. For structure characterization, X-ray diffraction (XRD) tests were carried out on an X-ray diffractometer (Brucker D8 Advance) with Cu Kα radiation. The composition and morphology of the FNDSP cathode materials were analyzed by using field emission scanning electron microscopy (FE-SEM, Hitachi S-4800). Transmission electron microscopy (TEM) and elemental mapping investigations were performed with a FEI Tecnai G2 F20 microscope operated at 200 kV. To acquire the cathode after the cycling process, the cell was dissembled in a glove box (MBraun MB 200B) filled with argon, and the cathode was soaked in pure DME for 3–5 minutes to remove residual salts of the electrolyte. After being washed 3 times, the cathode was dried in a vacuum oven and then transferred to an airtight container filled with argon for further characterization.2.3. Li–O2 cell assembly and electrochemical tests
The O2 electrodes adopted Ni foam as the current collector instead of Al mesh to avoid possible corrosion reactions with LiTFSI.34 Then, a mixture of 80 wt% FNDSP, 10 wt% Super P and 10 wt% PVDF was sprayed across the weighed Ni foam (∅14 mm) with an airbrush, and dried at 80 °C overnight within a vacuum oven. The mass loading of the FNDSP cathode material is around 1 mg cm−2. A CR2032 coin-type battery with 19 pores (1.2 mm in diameter) in the center of the cathode shell for O2 passage was used to fabricate the Li–O2 cell in an Ar atmosphere. Inside, the cell consists of Li foil, and a glass-fiber separator (Whatman GF/C), together with an FNDSP-O2-electrode, and 1.0 M lithium bis(trifluoromethyl) sulfonylimide (LiTFSI) in tetra-ethylene glycol dimethyl ether (TEGDME) was used as the electrolyte. The batteries' cycling stabilities were investigated at a current density of 0.1 mA cm−2 with a cut-off value of 2.4 V for discharge and 4.5 V for charge, together with 500 mA h gcarbon+catalyst−1 as the limited specific capacity for each cycle on a LAND CT2001A instrument (Wuhan Blue Electronics Co., Ltd., China) at ambient temperature.The above coin-type batteries were also applied in the cyclic voltammetry (CV) tests using a CHI1140 electrochemical workstation (Shanghai Chenhua instrument Co., Ltd., China). As for the parameter settings, the scanning rate was set at 0.2 mV s−1 and the electrochemical scanning window was set from 2.2 to 4.5 V. Before running the CV test, the cell treatment consists of being transferred out of the glovebox filled with Ar with a sealed container, and then feeding oxygen into the container for 2 minutes. Electrochemical tests of the batteries were performed in 1 atm purity O2 to avoid side reactions due to H2O and CO2 from the environment.
Linear sweep voltammograms (LSV) were performed to more directly reflect the synthesized FNDSP materials' electrochemical activities, and also to help compare the two typical phenomena demonstrated by the TEM results in the following discussion. This experiment was carried out by an electrochemical testing system (Biologic VMP3, France). A glassy carbon electrode (∅0.5 cm) was used as the working electrode and was prepared with the following procedure: firstly, ink containing the as-prepared catalyst was made by dispersing 2 mg of the catalyst into 1 mL of ethanol and 0.5 mL of Nafion solution (0.15 wt% in ethanol) with ultrasonic processing, and then we injected the ink (30 μL) onto the working electrode (the loading was about 30 μg). The reference electrode was a mercuric oxide electrode (Hg/HgO/OH−, 0.165 V vs. the reversible hydrogen electrode (RHE) @25 °C) and a graphite rod was applied as the counter electrode. The experiment used an alkaline environment (0.1 M KOH solution). The test was carried out under O2-saturated conditions and the scanning rate was set at 10 mV s−1 with a test window of 0.00–1.23 V (vs. RHE). A commercial Pt/C catalyst (20 wt%, J&M) was also tested for comparison. The above electrochemical performance tests did not involve iR drop correction in order to reflect a more real situation.
2.4. Computational methods
The first principles calculations were performed through applying the Vienna ab initio simulation package (VASP)35,36 with a plane-wave-kinetic cut-off energy of 400 eV. The ion–electron interactions were described by the projector-augmented plane wave (PAW) approach, and the exchange–correlation interactions were approximated by the Perdew–Burke–Ernzerhof (PBE)37 generalized gradient approximation (GGA). A 4 × 4 × 1 Monkhorst–Pack k mesh was applied for a 9 × 9-unit cell, and increased to 12 × 12 × 1 for a 3 × 3-unit cell. All structures were fully relaxed and the force tolerance was limited to 0.01 eV Å−1. The vacuum thickness inserted between two neighboring images in the c direction was set at 20 Å to avoid interactions.3. Results and discussion
3.1. TEM characterizations associated with LSV tests
In order to clarify how the excess Fe/N precursor addition can influence the material structure and morphology, we firstly characterized the as-synthesized FNDSP samples through transmission electron microscope (TEM) measurements (Fig. 2). The representative TEM images of the sample powders of a relatively higher Fe/N precursor proportion in Fig. 2a (FNDSP-10) and a lower one in Fig. 2d (FNDSP-30) were taken for comparison. When the Fe/N precursor proportion was higher (FNDSP-10), small particles appeared in the carbon matrix, and elemental mapping results (Fig. 2c) revealed that the formation of these particles was mainly due to the agglomeration of Fe related species, while the N element still distributed rather uniformly in the carbon matrix. Fig. 2d shows that when the Fe/N precursor proportion was relatively lower (FNDSP-30), however, the particles observed above can hardly be detected in the carbon matrix, and elemental mapping results (Fig. 2f) evidenced that the doped heteroatoms dispersed quite evenly in the carbon substrates. Moreover, high-resolution transmission electron microscopy (HRTEM) analysis of FNDSP-10 (Fig. 2b) further proved that the particles were crystals and had an interplanar spacing of 0.294 nm. Furthermore, this parameter fitted well with the (220) plane of Fe3O4 (ICSD, PDF#: 88-0866), revealing the possibility of the existence of Fe3O4 in the sample. In contrast, only a microcrystalline carbon structure can be observed through the sample of FNDSP-30 (Fig. 2e).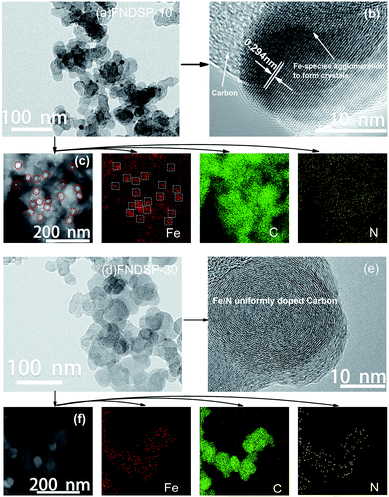 | ||
| Fig. 2 Representative TEM images (a), HRTEM (b), STEM images along with elemental mappings (c) of FNDSP-10; TEM images (d), HRTEM (e), STEM images as well as elemental mappings (f) of FNDSP-30. | ||
Furthermore, to more directly evaluate to what extent the differences observed by TEM characterization can affect the ORR catalytic activities of the FNDSP-30 and FNDSP-10 materials, corresponding LSV tests were carried out (see Fig. S1 in the ESI†). To remove the possible effect of N2 during the ORR tests, pure oxygen was continually pushed into the solution for 0.5 h before all the tests. In terms of the half-wave potential, that of the FNDSP-30 sample was 28 mV more positive than that of FNDSP-10 and 237 mV higher than that of the pristine Super P material, and it was close to that of commercial Pt/C (20 wt%). We noticed that this result is comparable to references where zero-dimensional carbon materials (e.g. Ketjen Black, Black Pearls, etc.) or polymer-derived carbon precursors were used in synthesizing such catalysts.19,25,28,32,38 Besides, the electron transfer number (n) varied notably from 4.30 for FNDSP-30, to 3.99 for FNDSP-10, and 3.33 for pure Super P based on the Koutecky–Levich equations (Fig. S1 in the ESI†). To conclude, the FNDSP-30 sample exhibited a much-improved activity compared to FNDSP-10, and further insights into the above phenomenon will be explained in the following discussion.
3.2. XRD and Raman characterizations
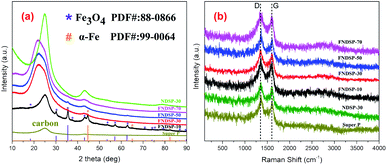
To further figure out the composition differences of the synthesized FNDSP materials with different precursor proportions, XRD tests were carried out and the patterns are compared in Fig. 3a. The pattern of pure SP powder is also present in Fig. 3a, and two remarkable diffraction peaks can be found at around 25.0° and 43.2°, which can be respectively identified as the (002)/(100) diffraction from the hexagonal graphitic carbon structure.39 Interestingly, the powder of FNDSP-10 shares the same diffraction peak position at around 25.0° for the (002) diffraction, and it has been found to shift to a lower angle of 22.0° for FNDSP-30, FNDSP-50 and FNDSP-70, indicating an increase of the inter-planar distance for the latter three samples based on the Bragg equation. Besides, the peak shapes of the latter three samples become obviously broader, which indicates a decrease of graphitization degree, and this can be explained as the result of heteroatom doping into the graphitic carbon layers. For comparison, an iron-free sample was prepared using the same procedure described above with a molar ratio of SP carbon atoms to phen nitrogen atoms of 30![[thin space (1/6-em)]](https://www.rsc.org/images/entities/char_2009.gif) :
:![[thin space (1/6-em)]](https://www.rsc.org/images/entities/char_2009.gif) 1, and was labelled as NDSP-30. Significantly, the (002) diffraction of NDSP-30 exhibited no shift compared with FNDSP-30 (Fig. 3a), indicating that the increase of the inter-planar distance was related to the addition of Fe element.
1, and was labelled as NDSP-30. Significantly, the (002) diffraction of NDSP-30 exhibited no shift compared with FNDSP-30 (Fig. 3a), indicating that the increase of the inter-planar distance was related to the addition of Fe element.
In addition to the differences in the (002) peak, we detected Fe3O4 (ICSD, PDF#: 88-0866) and α-Fe (ICSD, PDF#: 99-0064) as a major phase in the FNDSP-10 powder, which is obviously different from other samples (Fig. 3a). Combined with the TEM results in Fig. 2, we can conclude that when too much Fe/N precursor is added into the carbon matrix, it can result in particle agglomeration for Fe related species, which may inhibit the enhancement of the doping level. Note that there were relatively few diffraction peaks of α-Fe phase for FNDSP-10, and it may not be easy to capture its HRTEM lattice image in Fig. 2e. Besides, our Raman tests demonstrated that the FNDSP-30 sample has the maximum defect degree, instead of FNDSP-10, in these synthesized materials and this helped to explain that iron will facilitate the anchoring of N at carbon substrates to form more defective structures or active sites (Fig. 3b).
Fig. 3b gives the Raman spectra of the as-synthesized FNDSP series materials to help clarify the carbon defect structure. Two typical carbon resonance peaks at around 1590 and 1350 cm−1 dominated the spectra, which correspond to the G/D band peaks, respectively. Theoretically, the G band is representative of in-plane sp2-hybridized carbon atoms in an ideal graphene layer and the D band denotes defects formed by disordered sp3-hybridized carbon atoms. Consequently, the ratio of integrated intensities ID/IG shows the proportion of defect level to graphitization degree within the carbon substrates, and is found to increase in the order of SP (1.01) < NDSP-30 (1.03) < FNDSP-70 (1.04) < FNDSP-10 (1.05) < FNDSP-50 (1.07) < FNDSP-30 (1.11). Obviously, the doping level is enhanced by providing a higher Fe/N precursor ratio. However, it can also be attenuated when it exceeds an optimal value. In other words, this result has demonstrated that FNDSP-30 has the maximum defect degree, instead of FNDSP-10, in these synthesized materials, and this coordinates well with the XRD results. Meanwhile, the NDSP-30 sample prepared with no addition of Fe-containing precursor has the minimum ID/IG value among all of the FNDSP series materials, and has only a slightly higher value than that of pure SP. The conclusion that iron will facilitate the anchoring of N at the carbon substrate to form more defective structures or active sites can be reached through this comparison.
3.3. XPS characterization
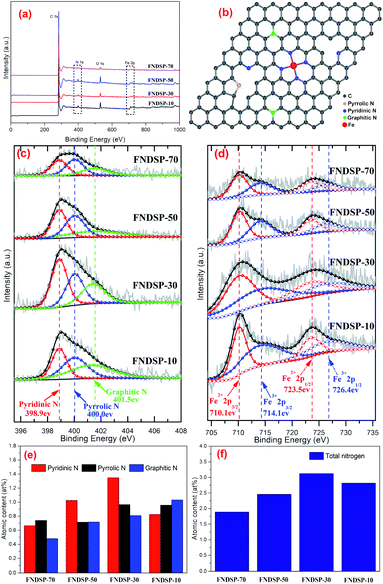
The chemical compositions and valence states for the as-synthesized FNDSP samples were further identified through XPS measurements. The XPS survey scans for the as-prepared FNDSP series are displayed in Fig. 4a, and it can be seen that all samples exhibited four dominant peaks at 285, 399, 532 and 711 eV, corresponding to the C 1s, N 1s, O 1s and Fe 2p valence electrons, respectively. Meanwhile, they also helped to confirm that Fe/N elements were authentically imported into the carbon-based materials. For comparison, the total atomic concentrations of N element in the FNDSP series samples increased from 1.89% for FNDSP-70 to 2.46% for FNDSP-50, reaching a maximum at 3.12% for FNDSP-30, but then diminished to 2.82% for FNDSP-10 (Table 1). Interestingly, the total atomic concentrations of Fe element kept rising from 0.12 at% to 0.14 at%, 0.15 at% and 0.27 at% with the increase of Fe/N precursor addition in the carbon substrate (Table 1). Based on the above analysis, the reason for the decreased N concentration at elevated Fe/N proportion for FNDSP-10 was possibly because of the Fe-related species agglomeration, which decreased its anchoring effect for stabilizing nitrogen during the pyrolysis process.40| Sample | C (at%) | O (at%) | Fe (at%) | N (at%) | |||
|---|---|---|---|---|---|---|---|
| Total N (at%) | Graphitic N (at%) | Pyrrolic N (at%) | Pyridinic N (at%) | ||||
| FNDSP-10 | 94.01 | 2.91 | 0.27 | 2.82 | 1.03 | 0.96 | 0.83 |
| FNDSP-30 | 94.52 | 2.21 | 0.15 | 3.12 | 0.81 | 0.97 | 1.35 |
| FNDSP-50 | 95.50 | 1.90 | 0.14 | 2.46 | 0.68 | 0.90 | 0.89 |
| FNDSP-70 | 96.98 | 1.01 | 0.12 | 1.89 | 0.48 | 0.74 | 0.67 |
Charge correction was performed based on 284.8 eV of C 1s and the fitted XPS N 1s spectra for the FNDSP series are depicted in Fig. 4c. Each of the spectra were deconvoluted into three peaks at around 398.9, 400.0 and 401.5 eV, corresponding to pyridinic, pyrrolic, and graphitic N (Fig. 4b), respectively.19 Besides, it should be noted that Fe–Nx moieties can be formed by coordinating pyridinic or pyrrolic nitrogen with Fe.38,41,42 According to previous research, pyrrolic N was revealed to have little contribution to the enhancement of the ORR catalytic activity, while pyridinic N was demonstrated to be much more active than graphitic N.22
Analysis of the percentage content of functional groups containing N may help understand the influence of precursor proportioning on the catalytic performance and the possible mechanisms. It can be seen from Table 1 and Fig. 4e that as the Fe/N precursor ratio increases, the atomic content of pyridinic N firstly changes from 0.67% for FNDSP-70 to 0.89% for FNDSP-50, moving on to a maximum of 1.35% for FNDSP-30, but then decreased to 0.83% for FNDSP-10, which showed a similar trend to the total N content of the synthesized materials (Fig. 4f). Meanwhile, it was noticed that the graphitic N content increased continually with elevated Fe/N precursor ratio. The higher graphitic N but lower pyridinic N content and simultaneously lower catalytic activity of FNDSP-10 than FNDSP-30 may imply that pyridinic N plays a more critical role for better catalytic performances. In addition, the pyrrolic N content exhibited small changes when the proportioning varied. Hence, we could reasonably infer that the decreased total nitrogen content at high Fe/N proportion (FNDSP-10) can be explained as follows. As one can see from the TEM and XRD results shown above, Fe-rich particles came into being for the highest Fe/N precursor ratio sample of FNDSP-10, and the Fe agglomeration lowered its bonding effect on stabilizing nitrogen through Fe–Nx moieties, which led to a decrease of the nitrogen occupation, especially the content of pyridinic N. From another aspect, first-principles calculations (Fig. S2 in the ESI†) showed that the rising total energy values of the system caused by the interaction between dopants will exhibit exponential growth when the concentration of Fe/N moieties increases during the preparation process (the value of “x” in the Fe–Nx moieties was taken as “4” just as an example for this calculation and previous articles also supported that the active sites in such catalysts were most likely to be FeN4 moieties.23,31,43), indicating that the doping process will become quite difficult by simply increasing the precursor proportion. To summarize, pyridinic N was proved to be most active for the ORR among the N-containing functional groups, and this implies that catalysts possessing an optimal pyridinic N content (FNDSP-30, 1.35 at%) may have the best ORR catalytic performances.
Furthermore, Fig. 4c shows the fine XPS spectra of the Fe 2p electrons. Because of spin-orbital coupling, the Fe 2p peak will split into 2p1/2 and 2p3/2. Actually, these two peaks have a certain ratio in terms of the peak area, which is 1![[thin space (1/6-em)]](https://www.rsc.org/images/entities/char_2009.gif) :
:![[thin space (1/6-em)]](https://www.rsc.org/images/entities/char_2009.gif) 2. Furthermore, two chemical states were obtained through deconvolution, namely Fe2+ (710.1 and 723.5 eV) and Fe3+ (714.1 and 726.4 eV), and this suggested the entrapment of iron nitrides (Fe–Nx) and iron oxides in the porous carbon, respectively.38 Yet, as mentioned above, the total Fe content was very low, only at 0.12 at%–0.27 at%.
2. Furthermore, two chemical states were obtained through deconvolution, namely Fe2+ (710.1 and 723.5 eV) and Fe3+ (714.1 and 726.4 eV), and this suggested the entrapment of iron nitrides (Fe–Nx) and iron oxides in the porous carbon, respectively.38 Yet, as mentioned above, the total Fe content was very low, only at 0.12 at%–0.27 at%.
3.4. Catalytic performance verified in a Li–O2 battery
We also assembled lithium–oxygen coin cells to verify the actual performance differences of the series of as-synthesized FNDSP catalysts. A comparison of the charge–discharge curves in the first cycle of the FNDSP series catalysts and pure SP is displayed in Fig. 5a, and the mean voltage of FNDSP-30 for the discharging and charging processes was 2.85 V and 3.63 V, respectively, demonstrating the least polarization value and most outstanding electrochemical catalytic performance of the optimized FNDSP-30 catalyst material among the series. This was further identified by our CV test result (Fig. 6). Furthermore, the FNDSP-30 electrode delivered stable cycling for over 50 cycles, longer than FNDSP-50 (39 cycles), FNDSP-10 (35 cycles) and FNDSP-70 (27 cycles) (see Fig. S3 in the ESI† for more details). In terms of the deep discharging test, the cut-off voltage was set as 2.5 V, and we can see that the pure SP electrode only delivered a discharge capacity of 3689.3 mA h gcarbon+catalyst−1 (Fig. 5b). In comparison, the FNDSP-30 electrode exhibited a discharge capacity of 5811.5 mA h gcarbon+catalyst−1, which was 120 mV higher than that of SP for the discharging mean voltage (more details of the comparison can be found in Table S1 in the ESI†).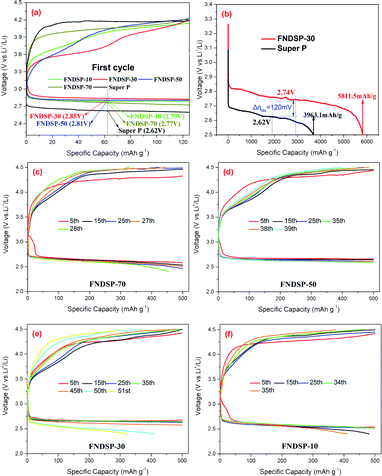 | ||
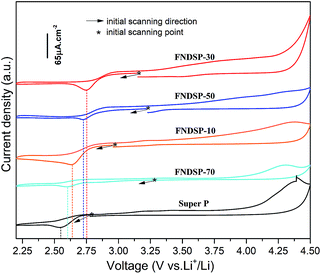
| Fig. 6 Cyclic voltammograms of FNDSP cathode batteries (the cut-off voltage range was limited to 2.2–4.5 V and the voltage scanning rate was set at 0.2 mV s−1). | ||
Cyclic voltammogram (CV) measurements were performed to compare the potential catalytic ability of the FNDSP materials for Li–O2 batteries (Fig. 6). The theoretical redox potential for aprotic lithium oxygen batteries is ∼2.96 V vs. Li/Li+. Because of the slow reaction kinetics (sluggish electron delivery, oxygen adsorption etc.) at the cathode during discharge, CV measurements usually give a much lower potential than 2.96 V in practice. As the reaction kinetics can be enhanced by applying catalytic materials as cathodes, it is advisable to judge the electrochemical catalytic performance by comparing the potential of the reductive peak by CV tests. Before the tests, the Li–O2 batteries were rested in pure oxygen for ∼10 h to approach the theoretical potential of 2.96 V vs. Li/Li+. Then, the scanning firstly starts from the initial open-circuit voltage in the negative direction in accordance with the discharge–charge nature of Li–O2 batteries. The results in Fig. 6 demonstrate that all of the FNDSP series catalysts exhibited better ORR catalytic activity than SP materials. In addition, the FNDSP-30 catalyst material shows the highest potential of the reductive peak, demonstrating its outstanding electro-catalytic performance over the others for the operation of Li–O2 batteries. Additionally, it was noticed that the curves did not close in Fig. 6, and the reason for this may be the increase of resistance after the CV test (Fig. S4 in the ESI†). When applying the same voltage to the cell, a higher impedance should give a lower current, which inevitably makes it not an ideal loop curve based on the testing method introduced above.
The morphology and structure of the pristine electrodes, discharged electrodes and recharged electrodes were also characterized by XRD and SEM (Fig. 7, the FNDSP-30 cathode was chosen for representation). The as-fabricated pristine FNDSP-30 electrode exhibited a porous structure (Fig. 7a), and the FNDSP-30 particles were loosely dispersed. After discharge, copious hemoglobin-like discharging products were formed in the pores of the cathode, and they were demonstrated to be Li2O2 by XRD characterization (Fig. 7d). The discharging product morphology is a typical feature for aprotic lithium–oxygen systems, consistent with previous reports in the literature.2,3 After the charging process, the hemoglobin-like products disappeared and the electrode returned to the initial porous structure. XRD tests revealed that the peaks of Li2O2 disappeared for the recharged cathode. These results indicated that the generated Li2O2 during discharge was reversibly decomposed during charge, indicating the possibility of the FNDSP-30 electrode being used in reversible lithium air batteries.
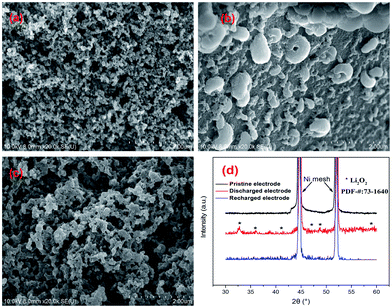 | ||
| Fig. 7 SEM characterizations for the FNDSP-30 electrode: (a) pristine, (b) after discharge, and (c) after recharge; (d) XRD analysis for the pristine, discharged, and recharged FNDSP-30 cathodes. | ||
4. Conclusions
In summary, a fundamental understanding of the relationship between Fe/N decorated carbon materials (FNDSP) and the stoichiometry was systematically acquired. The catalyst activity strengthened at elevated active site density tuned by the stoichiometry. However, Fe-related particle agglomeration occurred at the highest designed ratio of Fe/N precursors (FNDSP-10) and resulted in the runaway of the total N content (especially the pyridinic-N content) due to the weakened anchoring effect stabilizing the N on the carbon substrate, thus resulting in subdued activity of the FNDSP-10 catalyst. In contrast, the pyridinic-N enriched and agglomeration-free FNDSP-30 catalyst with optimized catalytic activity was synthesized without acid washing treatment or an energy-consuming secondary pyrolysis process, showing the advantages of being facile and environmentally friendly, and it being easy to scale-up production to an industrial scale. The as-prepared FNDSP catalysts were applied and verified in Li–O2 batteries and the optimized cathode material sample (FNDSP-30) exhibited distinct advantages of electrochemical performance over the particle agglomeration formed one (FNDSP-10). The findings in this work reveal that the catalytic performance of FNDSP-10 materials with crystalline particle formation commonly observed in previously reported literature studies can be further ameliorated by precise control of the synthetic routes, which has been ignored mostly and not systematically investigated. This may help to promote the fundamental understanding towards designing Fe/N-doped carbon catalysts with an optimized electro-catalytic activity and will have instructive functions for future improvements and applications of N-doped carbon materials for Li–O2 batteries with theoretical and practical significance.Conflicts of interest
There are no conflicts to declare.Acknowledgements
We acknowledge the financial support of Beijing Municipal Science and Technology Project (No. Z181100004518003), Science and Technology Nova Plan of Beijing City (Grant No. Z191100001119032) and GRINM Youth Foundation Funded Project (Grant No. QGL20190060) for this work.Notes and references
- G. Girishkumar, B. Mccloskey, A. C. Luntz, S. Swanson and W. Wilcke, J. Phys. Chem. Lett., 2010, 1, 2193–2203 CrossRef CAS.
- O. Sapunkov, V. Pande, A. Khetan, C. Choomwattana and V. Viswanathan, Transl. Mater. Res., 2015, 2, 045002 CrossRef.
- C. Wang, Z. Xie and Z. Zhou, APL Mater., 2019, 7, 040701 CrossRef.
- G. Karkera and A. S. Prakash, ACS Appl. Mater. Interfaces, 2019, 11, 27870–27881 CrossRef CAS PubMed.
- Z. Ma, X. Yuan, L. Li, Z. F. Ma, D. P. Wilkinson, L. Zhang and J. Zhang, Energy Environ. Sci., 2015, 8, 2144–2198 RSC.
- J. Wang, Y. LI and X. Sun, Nano Energy, 2013, 2, 443–467 CrossRef CAS.
- S. A. Freunberger, Y. Chen, Z. Peng, J. M. Griffin, L. J. Hardwick, F. Bardé, P. Novák and P. G. Bruce, J. Am. Chem. Soc., 2011, 133, 8040–8047 CrossRef CAS PubMed.
- Y. C. Lu, B. M. Gallant, D. G. Kwabi, J. R. Harding, R. R. Mitchell, M. S. Whittingham and Y. Shao-Horn, Energy Environ. Sci., 2013, 6, 750–768 RSC.
- B. D. McCloskey, D. S. Bethune, R. M. Shelby, G. Girishkumar and A. C. Luntz, J. Phys. Chem. Lett., 2011, 2, 1161–1166 CrossRef CAS PubMed.
- N. Mozhzhukhina, F. Marchini, W. R. Torres, A. Y. Tesio, L. P. Mendez De Leo, F. J. Williams and E. J. Calvo, Electrochem. Commun., 2017, 80, 16–19 CrossRef CAS.
- M. M. Ottakam Thotiyl, S. A. Freunberger, Z. Peng and P. G. Bruce, J. Am. Chem. Soc., 2013, 135, 494–500 CrossRef CAS PubMed.
- D. M. Itkis, D. A. Semenenko, E. Y. Kataev, A. I. Belova, V. S. Neudachina, A. P. Sirotina, M. Hävecker, D. Teschner, A. Knop-Gericke, P. Dudin, A. Barinov, E. A. Goodilin, Y. Shao-Horn and L. V. Yashina, Nano Lett., 2013, 13, 4697–4701 CrossRef CAS PubMed.
- Y. Wang and Y. C. Lu, Angew. Chem., Int. Ed., 2019, 131, 7036–7040 CrossRef.
- L. Zou, J. Cheng, Y. Jiang, Y. Gong, B. Chi, J. Pu and L. Jian, RSC Adv., 2016, 6, 31248–31255 RSC.
- U. I. Kramm, I. Abs-Wurmbach, I. Herrmann-Geppert, J. Radnik, S. Fiechter and P. Bogdanoff, J. Electrochem. Soc., 2011, 158, B69 CrossRef CAS.
- Y. Peng, B. Lu and S. Chen, Adv. Mater., 2018, 30, e1801995 CrossRef PubMed.
- J. Zhang, Y. Sun, J. Zhu, Z. Kou, P. Hu, L. Liu, S. Li, S. Mu and Y. Huang, Nano Energy, 2018, 52, 307–314 CrossRef CAS.
- G.-Q. Yu, P.-J. Wei, F.-F. Wang and J.-G. Liu, ChemElectroChem, 2017, 4, 1509–1515 CrossRef CAS.
- X. Liu, S. Zou and S. Chen, Nanoscale, 2016, 8, 19249–19255 RSC.
- J. Wang, K. Li, H. X. Zhong, D. Xu, Z. L. Wang, Z. Jiang, Z. J. Wu and X. B. Zhang, Angew. Chem., Int. Ed., 2015, 54, 10530–10534 CrossRef CAS PubMed.
- J. L. Shui, N. K. Karan, M. Balasubramanian, S. Y. Li and D. J. Liu, J. Am. Chem. Soc., 2012, 134, 16654–16661 CrossRef CAS PubMed.
- D. Guo, R. Shibuya, C. Akiba, S. Saji, T. Kondo and J. Nakamura, Science, 2016, 351, 361–365 CrossRef CAS PubMed.
- Y. J. Sa, D. J. Seo, J. Woo, J. T. Lim, J. Y. Cheon, S. Y. Yang, J. M. Lee, D. Kang, T. J. Shin, H. S. Shin, H. Y. Jeong, C. S. Kim, M. G. Kim, T. Y. Kim and S. H. Joo, J. Am. Chem. Soc., 2016, 138, 15046–15056 CrossRef CAS PubMed.
- Y. Lai, W. Chen, Z. Zhang, Y. Qu, Y. Gan and J. Li, Electrochim. Acta, 2016, 191, 733–742 CrossRef CAS.
- G. Tan, L. Chong, R. Amine, J. Lu, C. Liu, Y. Yuan, J. Wen, K. He, X. Bi, Y. Guo, H. H. Wang, R. Shahbazian-Yassar, S. Al Hallaj, D. J. Miller, D. Liu and K. Amine, Nano Lett., 2017, 17, 2959–2966 CrossRef CAS PubMed.
- Y. Zhang, W. J. Jiang, L. Guo, X. Zhang, J. S. Hu, Z. Wei and L. J. Wan, ACS Appl. Mater. Interfaces, 2015, 7, 11508–11515 CrossRef CAS PubMed.
- W. Niu, L. Li, X. Liu, N. Wang, J. Liu, W. Zhou, Z. Tang and S. Chen, J. Am. Chem. Soc., 2015, 137, 5555–5562 CrossRef CAS PubMed.
- J. Zhu, M. Xiao, C. Liu, J. Ge, J. St-Pierre and W. Xing, J. Mater. Chem. A, 2015, 3, 21451–21459 RSC.
- Z. Guan, X. Zhang, W. Chen, J. Pei, D. Liu, Y. Xue, W. Zhu and Z. Zhuang, Chem. Commun., 2018, 54, 12073–12076 RSC.
- L. Yang, D. Cheng, H. Xu, X. Zeng, X. Wan, J. Shui, Z. Xiang and D. Cao, Proc. Natl. Acad. Sci. U. S. A., 2018, 115, 6626–6631 CrossRef CAS PubMed.
- Y. Chen, S. Ji, Y. Wang, J. Dong, W. Chen, Z. Li, R. Shen, L. Zheng, Z. Zhuang, D. Wang and Y. Li, Angew. Chem., Int. Ed. Engl., 2017, 56, 6937–6941 CrossRef CAS PubMed.
- X. Zeng, J. Shui, X. Liu, Q. Liu, Y. Li, J. Shang, L. Zheng and R. Yu, Adv. Energy Mater., 2018, 8(1), 1701345 CrossRef.
- H. Fei, J. Dong, Y. Feng, C. S. Allen, C. Wan, B. Volosskiy, M. Li, Z. Zhao, Y. Wang, H. Sun, P. An, W. Chen, Z. Guo, C. Lee, D. Chen, I. Shakir, M. Liu, T. Hu, Y. Li, A. I. Kirkland, X. Duan and Y. Huang, Nat. Catal., 2018, 1, 63–72 CrossRef CAS.
- X. Wang, E. Yasukawa and S. Mori, Electrochim. Acta, 2000, 45, 2677–2684 CrossRef CAS.
- G. Kresse and J. Furthmüller, Phys. Rev. B: Condens. Matter Mater. Phys., 1996, 54, 11169–11186 CrossRef CAS PubMed.
- G. Kresse and D. Joubert, Phys. Rev. B, 1999, 59, 1758–1775 CrossRef CAS.
- J. P. Perdew, K. Burke and M. Ernzerhof, Phys. Rev. Lett., 1996, 77, 3865–3868 CrossRef CAS PubMed.
- L. Lin, Q. Zhu and A. W. Xu, J. Am. Chem. Soc., 2014, 136, 11027–11033 CrossRef CAS PubMed.
- F. Su, C. K. Poh, J. S. Chen, G. Xu, D. Wang, Q. Li, J. Lin and X. W. Lou, Energy Environ. Sci., 2011, 4, 717–724 RSC.
- J. Ekspong, T. Sharifi, A. Shchukarev, A. Klechikov, T. Wågberg and E. Gracia-Espino, Adv. Funct. Mater., 2016, 26, 6766–6776 CrossRef CAS.
- X. Cui, S. Yang, X. Yan, J. Leng, S. Shuang, P. M. Ajayan and Z. Zhang, Adv. Funct. Mater., 2016, 26, 5708–5717 CrossRef CAS.
- W. Niu, L. Li, X. Liu, N. Wang, J. Liu, W. Zhou, Z. Tang and S. Chen, J. Am. Chem. Soc., 2015, 137, 5555–5562 CrossRef CAS PubMed.
- B. Lu, T. J. Smart, D. Qin, J. E. Lu, N. Wang, L. Chen, Y. Peng, Y. Ping and S. Chen, Chem. Mater., 2017, 29, 5617–5628 CrossRef CAS.
Footnote |
| † Electronic supplementary information (ESI) available. See DOI: 10.1039/c9ra08207g |
| This journal is © The Royal Society of Chemistry 2020 |

