 Open Access Article
Non-covalent interactions between sertraline stereoisomers and 2-hydroxypropyl-β-cyclodextrin: a quantum chemistry analysis†
Joanatan-Michael Bautista-Renedoa,
Erick Cuevas-Yañeza,
Horacio Reyes-Pérezc,
Rubicelia Vargas b,
Jorge Garza
 b and
Nelly González-Rivas
 *a
*a
aCentro Conjunto de Investigación en Química Sustentable UAEM-UNAM, km 14.5 carretera Toluca-Atlacomulco, Campus UAEMex “El Rosedal” San Cayetano-Toluca de Lerdo, Toluca de Lerdo, Estado de México C. P. 50200, Mexico. E-mail: nmdgonzalezr@uaemex.mx
bDepartamento de Química, División de Ciencias Básicas e Ingeniería, Universidad Autónoma Metropolitana-Iztapalapa, San Rafael Atlixco 186, Col. Vicentina. Iztapalapa, México D. F., C. P. 09340, Mexico. E-mail: jgo@xanum.uam.mx
cTecnológico de Estudios Superiores de Jocotitlán, Carretera Toluca-Atlacomulco KM 44.8 Ejido de San Juan y, San Agustin, C.P. 50700 Jocotitlán, Mexico
First published on 27th May 2020
Abstract
Inclusion compounds formed between sertraline stereoisomers and β-cyclodextrin, and 2-hydroxypropyl-β-cyclodextrin, were analyzed by using quantum chemistry methods. The exploration of the potential energy surface was performed using chemical intuition and classical molecular mechanics. This approach delivered around 200 candidates for low energy adducts, which were optimized through the PBE0/6-31G(d,p) method, and after this process solvent effects were considered by the continuous solvent model. This analysis showed that β-cyclodextrin and 2-hydroxypropyl-β-cyclodextrin are good trappers of sertraline, although the isomers suggested by molecular dynamics presented higher binding energies than those obtained by chemical intuition. The role of hydrogen bonds in the formation of adducts was studied using the non-covalent interactions index and the quantum theory of atoms in molecules. In this article we concluded that these interactions are present in all adducts, however, they are not important in the stabilization of these inclusion compounds. The molecular electrostatic potential indicates that Coulomb interactions could be responsible for the formation of these systems, although sophisticated solvent models must be used to confirm this conclusion, which are impractical in this case because of the sizes involved in these systems.
1 Introduction
Sertraline (cis-(1S,4S)-4-(3,4-dichlorophenyl)-N-methyl-1,2,3,4-tetrahydronaphthalen-1-amine) is an important inhibitor of serotonin, with remarkable antidepressant characteristics.1,2 The relevance of this compound is evidenced by the sales observed in the pharmaceutical industry for the treatment of obsessive–compulsive disorder, panic disorder or social anxiety disorder.3,4 The chemical structure of sertraline (SRT), depicted in Fig. 1, contains one amino group, three rings (two aromatic and one aliphatic) plus two chiral centers, which yield 4 stereoisomers: cis-(1S,4S)-SRT, cis-(1R,4R)-SRT, trans-(1R,4S)-SRT, and trans-(1S,4R)-SRT. In this article, we will refer to these stereoisomers as I, II, III and IV, respectively. Curiously, only stereoisomer I exhibits the desired biological activity, which is another example of chiral molecules involved in pharmaceutical analysis that represent challenges to separation methods since only this stereoisomer must be favored in industrial processes.5 Naturally, the remaining stereoisomers can be found as impurities and consequently knowledge of the molecular interactions involved in separation methods is crucial for improving the efficiency of such processes.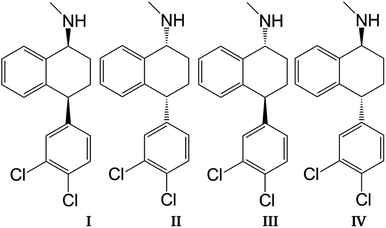 | ||
| Fig. 1 Sertraline stereoisomers: (I) cis-(1S,4S), (II) cis-(1R,4R), (III) trans-(1R,4S), (IV) trans-(1S,4R). | ||
One of the most used separation methods is high-performance liquid chromatography with β-cyclodextrin (βCD), presented in Fig. 2a, and derivatives of it.6–8 It is well recognized that cyclodextrins (CDs) are convenient for forming inclusion compounds due to the toroidal form acquired when glucopyranose units are linked to form a ring. Typically, these CDs contain 6, 7, or 8 glucopyranose units, labeled as α, β, or γ, respectively.9 In some cases, the molecular characteristics exhibited by CDs are used to separate stereoisomer mixtures by forming diastereomeric complexes through host–guest chemistry.10,11 It is worth noting that the hydroxyl groups of CDs increase the solubility of the host, inducing additional sites to interact with the corresponding enantiomer, and improving the chiral recognition.12,13
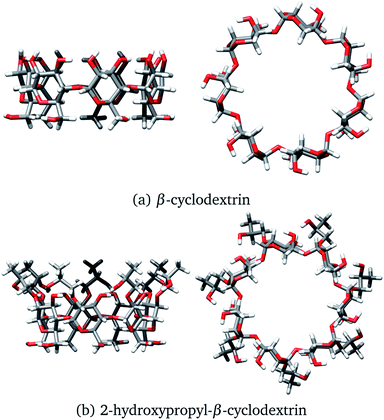 | ||
| Fig. 2 Two views of (a) β-cyclodextrin and (b) 2-hydroxypropyl-β-cyclodextrin. Both structures were optimized with the PBE0/6-31G(d,p) method. | ||
From a theoretical viewpoint, classical molecular dynamics predominates over quantum chemistry techniques for the study of CD inclusion compounds.14 The reason is clear: a high computational effort is required to study the electronic structures of these systems. Passos et al. proposed some inclusion complexes between βCD and stereoisomer I by using two supramolecular models: βCD:I and βCD:I:βCD. In this study, the potential energy surface (PES) was explored using structures built by chemical intuition and by evaluating the total energy with the PM3 semi-empirical method. For the molecular structure with the lowest PM3 energy, the PBE1PBE/6-31G(d,p) method was used without solvent effects.15 The main conclusion of this study is that the interactions between βCD and I arise from the amino and hydroxyl groups. Unfortunately, this study was not in accordance with the experimental information; for this reason, a few of the authors of the report recomputed the supramolecular models including water molecules.16 In this study, the PBE0/6-31G(d,p) method was used to analyze the electronic structures of these systems. In both studies, there are some crucial conclusions: (1) the primary host–guest interactions involve the amino group and take place outside the cavity, and (2) βCD exhibits no important structural distortions when it forms adducts, compared with the isolated system. This result is strange since such distortions are observed in inclusion adducts. For example, αCD shows deformations when dimethylformamide is enclosed within its cavity,17 and deformations are also observed when 4-dimethylamino-benzonitrile forms an inclusion adduct with βCD.18
At this point, we have explained that βCD has been used to form inclusion compounds, in particular with SRT. However, there are reports where this CD is functionalized to improve its trapping capacity. 2-hydroxypropyl-β-cyclodextrin (HPβCD), depicted in Fig. 2b, is an example of a functionalized CD, which has been used for several applications.19–25 This functionalized CD is obtained by replacing all the secondary alcohols in βCD with 2-hydroxypropyl groups. From a theoretical viewpoint, some structures for the HPβCD:I system have been proposed by using chemical intuition.21 To the best of our knowledge, the interactions involved in βCD:SRT adducts, especially which interactions control the behavior of these systems, have not been characterized through quantum chemistry methods. Thus, the aim of this article is twofold. First, we study the capacity of βCD and HPβCD to trap SRT stereoisomers, and second, the interactions that drive the stabilization of βCD:SRT and HPβCD:SRT adducts are analyzed by using several scalar and vector fields developed in quantum chemistry.
2 Methods
The starting point of this study was a βCD structure obtained by X-ray diffraction.26 We removed the water molecules from the cif file and from this structure we built the HPβCD structure. For SRT, we started with the SRT·HCl compound characterized by X-ray diffraction,27 since this compound is known experimentally. For this reason, we work with the protonated form, SRT·H+, because this species is found in aqueous medium. This procedure was used for the cis-(1S,4S) SRT stereoisomer and from this structure we built the rest of the stereoisomers. All these structures were optimized with the PBE0/6-31G(d,p) method, and they were true minima since we checked them using a frequency analysis. Eight inclusion compounds were proposed by looking for favorable contacts between SRT and βCD, testing both sides of the toroidal structure of βCD. These structures were the starting point for classical molecular dynamics (MD) simulations with the Tinker code v8.4 (ref. 28) and the MM3 force field. We carried out this simulation at a temperature of 298 K and an interval of 100![[thin space (1/6-em)]](https://www.rsc.org/images/entities/char_2009.gif) 000 ps. From this simulation we took snapshots of all structures within a window of relative energies defined between 0 and 10 kcal mol−1. With this procedure we obtained around 200 structures. The main reason for this approach was the fact that exploration of the PES was of interest to us, not the average thermodynamical properties. The final structures obtained by MD were optimized with the PBE0/6-31G(d,p) method. It is worth noting that some structures were structurally similar, and for that reason, we used unique structures. All these electronic structure calculations were performed with the Terachem suite code v1.9.29,30 From here, we used those structures with relative energies less than 5 kcal mol−1. Binding energies were estimated in the gas phase and in solution through the COSMO model implemented in Terachem by using the structure of the gas phase and performing a single point calculation with a dielectric constant ε = 78.4 for COSMO. The non-covalent interactions index (NCI)31 was used to explore the contacts involved in each inclusion compound and the characterization of each contact was carried out using the quantum theory of atoms in molecules (QTAIM).32,33 All these calculations were done using the graphics processing units for atoms and molecules (GPUAM) code.34,35 The molecular electrostatic potential (MEP) was evaluated by using a new implementation of this property over graphics processing units.36 The approach used for βCD adducts was also applied to find HPβCD:SRT structures.
000 ps. From this simulation we took snapshots of all structures within a window of relative energies defined between 0 and 10 kcal mol−1. With this procedure we obtained around 200 structures. The main reason for this approach was the fact that exploration of the PES was of interest to us, not the average thermodynamical properties. The final structures obtained by MD were optimized with the PBE0/6-31G(d,p) method. It is worth noting that some structures were structurally similar, and for that reason, we used unique structures. All these electronic structure calculations were performed with the Terachem suite code v1.9.29,30 From here, we used those structures with relative energies less than 5 kcal mol−1. Binding energies were estimated in the gas phase and in solution through the COSMO model implemented in Terachem by using the structure of the gas phase and performing a single point calculation with a dielectric constant ε = 78.4 for COSMO. The non-covalent interactions index (NCI)31 was used to explore the contacts involved in each inclusion compound and the characterization of each contact was carried out using the quantum theory of atoms in molecules (QTAIM).32,33 All these calculations were done using the graphics processing units for atoms and molecules (GPUAM) code.34,35 The molecular electrostatic potential (MEP) was evaluated by using a new implementation of this property over graphics processing units.36 The approach used for βCD adducts was also applied to find HPβCD:SRT structures.
3 Results
The exploration of the PES for inclusion compounds of CDs is an issue in quantum chemistry because sometimes the size of such systems is forbidden by several quantum chemistry methods. For that reason, in this article, we used classical MD techniques to explore the PES. Besides, some inclusion compounds were proposed by inserting SRT in different orientations on both sides of βCD and trying to form hydrogen bonds. In this article, this procedure will be referred to as chemical intuition, and the structures proposed in this way are presented in Fig. 3.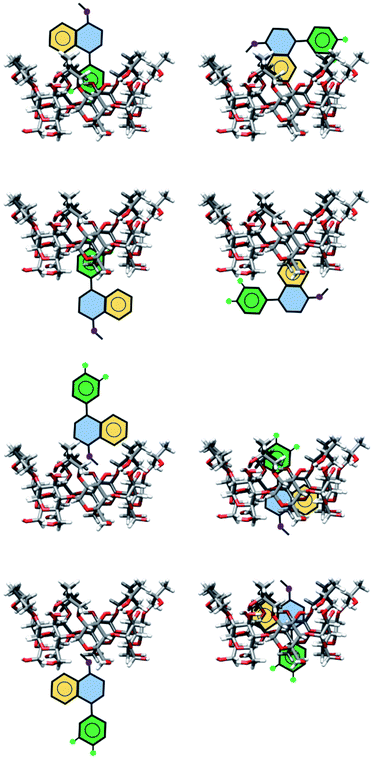 | ||
| Fig. 3 Schematic representation of geometries of inclusion compounds formed between βCD and sertraline stereoisomer I proposed by chemical intuition . | ||
3.1 βCD as a trapper of sertraline
As a starting point, we will analyze inclusion compounds between βCD and stereoisomer I. For this discussion, we will remark on the results obtained for adducts proposed by chemical intuition (CI) and MD since in many reports CI is the only way to analyze these systems. Remember that each structure obtained with these two approaches was optimized with the PBE0/6-31G(d,p) method. We report in Fig. 4 the three most stable adducts found by each approach, where CI and MD indicate chemical intuition and molecular dynamics, respectively. The coordinates of these structures are reported in the ESI† where we report more adducts found by CI and MD. A rapid comparison between our structures and those reported in the literature shows that βCD:I_CI3 is quite similar to that reported by Passos.15 We want to mention that the structures provided by MD differ appreciably from those optimized by DFT, mainly where there are hydrogen bonds, since some parts of the CDs do not show important deviations, particularly where hydrogen bonds are not present. Table S1 in the ESI† presents some results of the comparison between MD and optimized structures.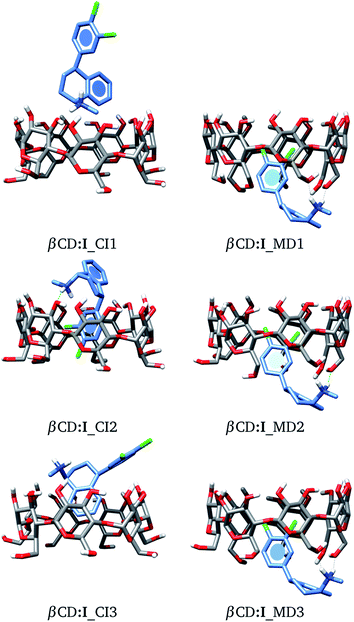 | ||
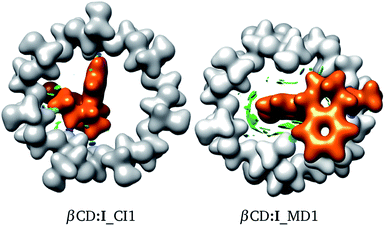
| Fig. 4 Three lowest-lying βCD:I adducts obtained from proposals made by chemical intuition (CI) and molecular dynamics (MD). Final structures obtained with the PBE0/6-31G(d,p) method. | ||
For the six adducts in Fig. 4, the corresponding binding energies in the gas phase,
| ΔEg = Eoptadduct − EoptCD − EoptSRT, | (1) |
| Adduct | ΔEg | ΔGg | ΔEs | ΔGs | ΔEdef |
|---|---|---|---|---|---|
| Chemical intuition | |||||
| βCD:I_CI1 | −25.0 | −10.6 | −8.8 | 5.6 | 10.3 |
| βCD:I_CI2 | −24.8 | −7.0 | −5.3 | 12.5 | 11.2 |
| βCD:I_CI3 | −18.4 | −1.0 | −4.7 | 12.6 | 6.0 |
![[thin space (1/6-em)]](https://www.rsc.org/images/entities/char_2009.gif) |
|||||
| Molecular dynamics | |||||
| βCD:I_MD1 | −44.8 | −25.0 | −11.8 | 7.9 | 14.8 |
| βCD:I_MD2 | −41.7 | −22.9 | −12.6 | 6.2 | 4.5 |
| βCD:I_MD3 | −41.5 | −23.2 | −13.1 | 5.3 | 14.5 |
Clearly MD proposes molecular structures that present large binding energies. In principle, this result must be mapped over the geometrical structures in these systems, in particular over the cone formed in βCD. To explore this idea, we used an energy contribution that takes into account the deformation of βCD when it creates the corresponding adduct. This term is defined as
| ΔEdef = EadductCD − EoptCD, | (2) |
The interactions involved in βCD inclusion compounds are interesting since, in principle, they induce the most stable structures. To understand the intermolecular interactions involved within the adducts reported here, we used the NCI to reveal the sites where weak interactions are present. In Fig. 5 we contrast the NCI (green and blue isosurfaces) for adducts proposed by CI and MD. We did this analysis for several adducts, as reported in the ESI.† The colours are as follows: (a) blue is negative, (b) green is small (close to zero), and (c) red is positive. Blue regions indicate strong attractive zones between fragments and green isosurfaces are associated with weak attractive van der Waals interactions. Red zones represent non-attractive interactions. In the same figure, the electron density, ρ(r), is presented with an isosurface of ρ(r) = 0.01 atomic units (au). This is shown in white for βCD and orange for SRT.
From Fig. 5, a large green zone is clearly present in βCD:I_MD1; contrary to this behavior, in βCD:I_CI1, this region is small. Thus, the NCI indicates that there are more attractive interactions in the adduct proposed by MD than in that suggested by CI. Besides, in this figure the electron density helps in observing the distortions exhibited in both adducts. For this reason we used the NCI plus ρ(r) to observe possible non-covalent interactions between fragments and structural distortions, in addition to ΔEdef.
The electron density was not only used to observe structural distortions, but was also used in the QTAIM approach, where the electron density and derivatives of it give information about a molecular system by using critical points of the scalar quantum chemistry field. In particular, bond critical points (BCPs) associated with hydrogen bonds were the main target since the electron density evaluated at these points is related to the strength of a hydrogen bond.40 Within this approach, bond path prediction is required to check for the presence of hydrogen bonds. Thus, the electron densities evaluated at BCPs corresponding to hydrogen bonds are reported in Table 2. In the same table, some geometrical parameters that define hydrogen bonds, like donor–acceptor (RDA) and hydrogen–acceptor (RHA) distances, and the angle (θ) defined by D–H⋯A, are also reported. We can mention several results in this table. The N–H⋯O hydrogen bond is present in all systems analyzed in this article, and for all cases the electron density, ρBCP, exhibits similar values. It is worth noting that these values are associated with hydrogen bonds with greater strength than that presented by the O–H⋯O bonds between water molecules.40 C–H⋯O and O–H⋯C hydrogen bonds are found in several adducts studied in this article; these contacts represent weak hydrogen bonds and therefore the corresponding ρBCP values are lower than that observed for the N–H⋯O contact.40 From these results, we observe that the adducts obtained from MD exhibit more hydrogen bonds than those obtained by chemical intuition; this is another reason to use MD structures instead of CI proposals.
| Adduct | Interaction | θ | RDA | RHA | ρBCP |
|---|---|---|---|---|---|
| Chemical intuition | |||||
| βCD:I_CI1 | N–H⋯O | 175.8 | 2.75 | 1.69 | 0.0458 |
| βCD:I_CI2 | N–H⋯O | 162.1 | 2.78 | 1.77 | 0.0435 |
| βCD:I_CI3 | C–H⋯O | 158.9 | 3.40 | 2.30 | 0.0129 |
![[thin space (1/6-em)]](https://www.rsc.org/images/entities/char_2009.gif) |
|||||
| Molecular dynamics | |||||
| βCD:I_MD1 | N–H⋯O | 154.8 | 2.74 | 1.76 | 0.0401 |
| N–H⋯O | 158.2 | 2.70 | 1.69 | 0.0467 | |
| O–H⋯C | 151.2 | 3.62 | 2.75 | 0.0063 | |
| βCD:I_MD2 | N–H⋯O | 154.6 | 2.73 | 1.75 | 0.0406 |
| N–H⋯O | 158.4 | 2.69 | 1.69 | 0.0467 | |
| O–H⋯C | 148.2 | 3.79 | 2.94 | 0.0051 | |
| βCD:I_MD3 | N–H⋯O | 154.2 | 2.74 | 1.76 | 0.0397 |
| N–H⋯O | 156.7 | 2.68 | 1.68 | 0.0475 | |
| O–H⋯C | 145.2 | 3.50 | 2.66 | 0.0071 | |
We want to finish this discussion by mentioning that in the adducts built by chemical intuition, βCD binds sertraline through external sections of the cone, and for the adducts obtained from MD, sertraline is bound by internal regions of βCD. In these situations, the hydrogen bonds in the MD adducts present geometrical parameters that are not favorable for their formation since the corresponding angles are far from linearity. This problem is balanced by the number of contacts observed in the structures proposed by MD.
3.2 Functionalized βCD as a sequestering agent for sertraline
In this article we built HPβCD:I adducts in the same way as βCD:I adducts. We started with 8 structures, similar to those presented in Fig. 3, and MD was performed on these structures. The three low-lying adducts obtained through chemical intuition and by MD are presented in Fig. 6. All these adducts are reported in the ESI.† We present the adducts obtained by chemical intuition, although HPβCD:I_CI2 and HPβCD:I_CI3 are not inclusion compounds since the SRT is outside of the cone defined by the functionalized βCD, which is evident in the figure.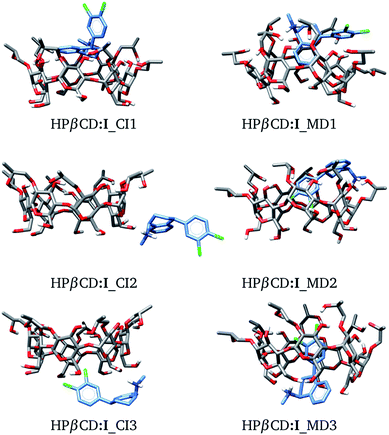 | ||
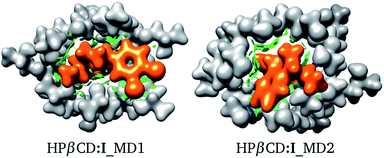
| Fig. 6 Three lowest-lying HPβCD:I adducts obtained from chemical intuition (CI) and molecular dynamics (MD). Final structures were obtained with the PBE0/6-31G(d,p) method. | ||
The binding energies for the six adducts reported in Fig. 6 are presented in Table 3. By looking through the binding energies in the gas phase, we see an important increase in these values with respect to those observed for the βCD:I adducts (Table 1), suggesting that HPβCD has a higher sequestering capability to trap SRT than βCD. This is an important result since it suggests that 2-hydroxypropyl-βCD should be used instead of βCD. At T = 298.15 K, the Gibbs energy changes are lower than ΔEg, in the same way as for the βCD–SRT adducts. Besides, the MD candidates exhibit larger binding energies than those predicted by CI. Thus, MD is useful for exploring the PES in inclusion compounds of βCD or its derivatives. From Table 3 we observe that the energy changes due to deformations of HPβCD are larger than those reported for βCD. This result indicates that HPβCD is more susceptible to deformation than βCD.
| Adduct | ΔEg | ΔGg | ΔEs | ΔGs | ΔEdef |
|---|---|---|---|---|---|
| Chemical intuition | |||||
| HPβCD:I_CI1 | −34.7 | −18.5 | −12.1 | 4.1 | 6.5 |
| HPβCD:I_CI2 | −26.3 | −11.3 | −9.2 | 5.8 | 9.9 |
| HPβCD:I_CI3 | −26.3 | −11.4 | −7.0 | 7.9 | 4.9 |
![[thin space (1/6-em)]](https://www.rsc.org/images/entities/char_2009.gif) |
|||||
| Molecular dynamics | |||||
| HPβCD:I_MD1 | −53.6 | −33.7 | −17.6 | 2.4 | 19.1 |
| HPβCD:I_MD2 | −51.8 | −32.1 | −15.4 | 4.2 | 34.9 |
| HPβCD:I_MD3 | −52.4 | −35.0 | −18.4 | −0.9 | 19.2 |
For these adducts, we also evaluated the NCI in order to observe regions where these systems exhibit intermolecular contacts like hydrogen bonds or van der Waals interactions. The NCI and the electron density are exhibited in Fig. 7 for HPβCD:I_MD1 and HPβCD:I_MD2. From this figure there is no doubt about the deformation exhibited by HPβCD when this CD forms adducts with SRT; it seems that this CD encapsulates SRT, and consequently there is a large contact surface available. This result is corroborated by the NCI, which exhibits several blue and green regions between HPβCD and SRT. To give a quantitative analysis of these interactions, the QTAIM was used to characterize the hydrogen bonds. Thus, in Table 4 we report θ, RDA, RHA and ρBCP for these contacts.
| Adduct | Interaction | θ | RDA | RHA | ρBCP |
|---|---|---|---|---|---|
| Chemical intuition | |||||
| HPβCD:I_CI1 | N–H⋯O | 161.4 | 2.74 | 1.72 | 0.0389 |
| HPβCD:I_CI2 | N–H⋯O | 171.8 | 2.73 | 1.69 | 0.0398 |
| HPβCD:I_CI3 | N–H⋯O | 155.1 | 2.74 | 1.76 | 0.0338 |
![[thin space (1/6-em)]](https://www.rsc.org/images/entities/char_2009.gif) |
|||||
| Molecular dynamics | |||||
| HPβCD:I_MD1 | N–H⋯O | 164.6 | 2.73 | 1.70 | 0.0448 |
| N–H⋯O | 155.6 | 2.88 | 1.90 | 0.0328 | |
| HPβCD:I_MD2 | N–H⋯O | 173.6 | 2.72 | 1.67 | 0.0488 |
| N–H⋯O | 168.2 | 2.80 | 1.77 | 0.0384 | |
| HPβCD:I_MD3 | N–H⋯O | 157.9 | 2.83 | 1.84 | 0.0344 |
| N–H⋯O | 109.1 | 2.89 | 2.37 | 0.0123 | |
From Table 4 we observe that the N–H⋯O hydrogen bond appears in all adducts considered in this article. Except for one N–H⋯O contact present in adduct HPβCD:I_MD3, this contact presents similar values of ρBCP in all adducts. This result is interesting because for adducts HPβCD:I_CI2 and HPβCD:I_MD3, these hydrogen bonds are present outside of the cone defined by HPβCD. Besides, if we compare these contacts with the N–H⋯O contacts reported in Table 2 for βCD adducts, clearly the N–H⋯O contact is similar in both sets of adducts. Therefore, the functionalized βCD contains large regions to trap sertraline, but in this situation, hydrogen bonds are not favored, suggesting that these contacts do not drive the stabilization of these inclusion compounds.
3.3 Functionalized β-CD in the separation of sertraline stereoisomers
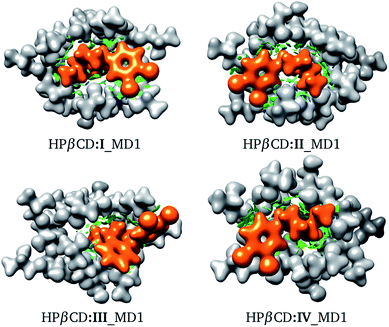
We used the same approach as that applied to HPβCD:I adducts for the II, III and IV stereoisomers in contact with HPβCD. The structures of these adducts are shown in Fig. 8, and additional structures are reported in the ESI.† We again observed that the structures suggested by chemical intuition gave binding energies above those obtained by MD, in the same way as in the previous discussion, and for this reason we will not include adducts suggested by chemical intuition in the following discussion.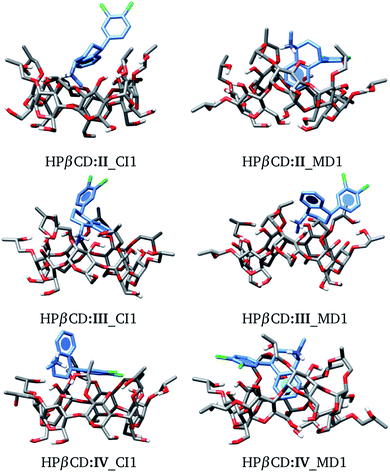 | ||
| Fig. 8 Conformation of the most stable geometries of inclusion compounds formed between HPβCD and three stereoisomers of sertraline: (II) cis-(1R,4R), (III) trans-(1R,4S) and (IV) trans-(1S,4R). | ||
The binding energies for adducts between HPβCD and the 4 stereoisomers of SRT are reported in Table 5. For completeness we have included the binding energies reported in Table 3 for the HPβCD:I adducts. Let us analyze the most stable adduct for each stereoisomer. In the gas phase we observe practically the same ΔGg for each adduct, and no trend is observed when solvent effects are taken into account, although we have mentioned the issues with this model for charged systems. Thus, based on the energy, we cannot determine differences in these stereoisomers.
| Adduct | ΔEg | ΔGg | ΔEs | ΔGs |
|---|---|---|---|---|
| HPβCD:I_MD1 | −53.6 | −33.7 | −17.6 | 2.4 |
| HPβCD:I_MD2 | −51.8 | −32.1 | −15.4 | 4.2 |
| HPβCD:I_MD3 | −52.4 | −35.0 | −18.4 | −0.9 |
| HPβCD:II_MD1 | −52.9 | −33.3 | −13.1 | 6.9 |
| HPβCD:II_MD2 | −51.0 | −30.2 | −11.8 | 9.5 |
| HPβCD:II_MD3 | −50.2 | −29.2 | −13.6 | 7.9 |
| HPβCD:III_MD1 | −53.7 | −33.7 | −14.6 | 5.4 |
| HPβCD:III_MD2 | −49.7 | −25.9 | −2.5 | 21.4 |
| HPβCD:III_MD3 | −42.0 | −32.1 | −12.6 | 7.3 |
| HPβCD:IV_MD1 | −55.9 | −32.7 | −10.3 | 12.9 |
| HPβCD:IV_MD2 | −49.5 | −26.0 | −3.4 | 20.1 |
| HPβCD:IV_MD3 | −48.4 | −26.7 | −7.2 | 14.4 |
We recognize that there are several energy contributions to the stabilization of βCD inclusion compounds; we can mention hydrogen bonds, van der Waals interactions and electrostatic interactions, all of which are non-covalent interactions. For this reason, we used the NCI to look for the interactions responsible for the stabilization of these systems. The NCI for the structures presented in Fig. 8 is depicted in Fig. 9. From this figure, the role of non-covalent interactions in the formation of these adducts is clear; in particular, the blue regions indicate possible formation of hydrogen bonds. The hydrogen bonds involved in the HPβCD:SRT adducts were obtained using the QTAIM and their characteristics are reported in Table 6. In many reports, the electron density evaluated at a bond critical point has been used to obtain an idea of the strength of a hydrogen bond. The results in Table 6 show that this property does not follow the same trend as that exhibited by the binding energies. Thus, there are additional interactions aside from hydrogen bonds that stabilize HPβCD:SRT adducts. We must bear in mind that electrostatic interactions are important effects involved in CD inclusion compounds, and for this reason we evaluated the electrostatic potential and the dipole moment of each system involved in HPβCD:SRT adducts.
| Adduct | Interaction | θ | RDA | RHA | ρBCP |
|---|---|---|---|---|---|
| Molecular dynamics | |||||
| HPβCD:I_MD1 | N–H⋯O | 164.6 | 2.73 | 1.70 | 0.0448 |
| N–H⋯O | 155.6 | 2.88 | 1.90 | 0.0328 | |
| HPβCD:II_MD1 | N–H⋯O | 160.6 | 2.91 | 1.91 | 0.0290 |
| N–H⋯O | 159.2 | 2.85 | 1.85 | 0.0333 | |
| N–H⋯O | 168.3 | 2.77 | 1.73 | 0.0442 | |
| HPβCD:III_MD1 | N–H⋯O | 147.1 | 2.81 | 1.89 | 0.0304 |
| N–H⋯O | 125.6 | 3.06 | 2.34 | 0.0120 | |
| HPβCD:IV_MD1 | N–H⋯O | 170.1 | 2.74 | 1.70 | 0.0470 |
| N–H⋯O | 161.5 | 2.74 | 1.73 | 0.0448 | |
| O–H⋯C | 158.1 | 3.27 | 2.36 | 0.0140 | |
The molecular electrostatic potential (MEP) of HPβCD is presented in Fig. 10, and the corresponding MEPs for the SRT stereoisomers are depicted in Fig. 11. From Fig. 10 we observe that the negative regions of the MEP for the functionalized CD are localized mainly over the inner regions of the cone. For this reason, this system attracts species with positive charge towards the wider rim of its cavity. As we mentioned at the beginning of this article, the sertraline used in this study has charge +1. However, there is an important difference between its stereoisomers. Stereoisomers I and II exhibit almost the same dipole moment, 15.49 and 15.50 debye respectively, which is lower than that presented by stereoisomers III and IV (20.78 debye for both cases). As we see from Fig. 11, the conformations adopted by the cis and trans stereoisomers are the main reason for the different dipole moments. Thus, the MEPs suggest that the HPβCD:III and HPβCD:IV adducts could exhibit bigger binding energies than the adducts containing the I and II stereoisomers. However, the solvent model used in this article could result in erroneous interpretations of the Gibbs energy changes.
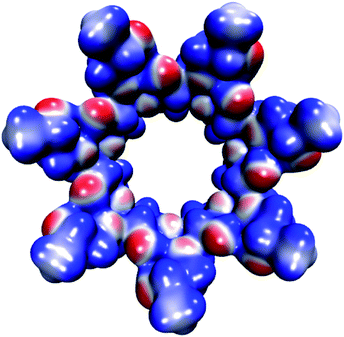 | ||
| Fig. 10 Molecular electrostatic potential of HPβCD from −0.07 (blue color) to 0.07 (red color) atomic units mapped over an isosurface of the electron density (ρ(r) = 0.01 atomic units). | ||
4 Conclusions
The interactions of βCD and HPβCD with sertraline were analyzed using quantum chemistry methods. On the one hand, we concluded that these CDs are suitable species for trapping sertraline since they induce high binding energies, particularly HPβCD. The adducts used to form this conclusion were suggested by molecular dynamics since, without this strategy, the isomers found by chemical intuition exhibited small binding energies. Thus, the second conclusion obtained in this article is that for inclusion compounds with βCD and HPβCD, a molecular dynamics simulation is needed to explore the potential energy surface since this technique allows for distortions in these CDs, and such distortions induce large binding energies. Finally, the molecular electrostatic potential provides insight into the factors involved in the separation of these stereoisomers. However, the solvent model used in this article gives large differences in the binding energies. Thus, the next step of this project is the use of an explicit–implicit model to treat solvent effects.Conflicts of interest
There are no conflicts to declare.Acknowledgements
We thank the Laboratorio de Supercómputo y Visualización en Paralelo at the Universidad Autónoma Metropolitana-Iztapalapa for access to its computer facilities. JG thanks CONACYT, México, for financial support through the project FC-2016/2412. JMBR thanks CONACYT for the scholarship 473595.References
- R. Valle-Cabrera, Y. Mendoza-Rodriguez, M. Robaina-Garcia, J. Ballesteros, J. R. Cordero-Jimenez, N. B. Espinosa-Rodriguez, Y. Sotolongo-Garcia and B. G. Lauria-Horner, J. Clin. Psychopharmacol., 2018, 38, 454–459 CrossRef CAS.
- N. A. Fineberg, D. S. Baldwin, L. M. Drummond, S. Wyatt, J. Hanson, S. Gopi, S. Kaur, J. Reid, V. Marwah, R. A. Sachdev, I. Pampaloni, S. Shahper, Y. Varlakova, D. Mpavaenda, C. Manson, C. O’Leary, K. Irvine, D. Monji-Patel, A. Shodunke, T. Dyer, A. Dymond, G. Barton and D. Wellsted, Int. Clin. Psychopharmacol., 2018, 33, 334–348 CrossRef PubMed.
- S. S. Al-Nimry and M. A. Jaber, Lat. Am. J. Pharm., 2017, 36, 665–672 CAS.
- S. S. Al-Nimry and M. A. Jaber, AAPS PharmSciTech, 2017, 18, 1190–1202 CrossRef CAS PubMed.
- M. X. Zhou and J. P. Foley, J. Chromatogr. A, 2004, 1052, 13–23 CrossRef CAS PubMed.
- R. N. Rao, M. V. N. Kumar Talluri and P. K. Maurya, J. Pharm. Biomed. Anal., 2009, 50, 281–286 CrossRef CAS PubMed.
- Q. J. Peng and J. J. Yang, Chin. Chem. Lett., 2014, 25, 1416–1418 CrossRef CAS.
- M. L. Reyes-Reyes, G. Roa-Morales, R. Melgar-Fernández, H. Reyes-Pérez and P. Balderas-Hernández, Chromatographia, 2014, 77, 1315–1321 CrossRef CAS.
- M. Palomar-Pardavé, S. Corona-Avendaño, M. Romero-Romo, G. Alarcón-Angeles, A. Merkoci and M. T. Ramírez-Silva, J. Electroanal. Chem., 2014, 717–718, 103–109 CrossRef.
- M. Ceborska, M. Asztemborska and J. Lipkowski, Chem. Phys. Lett., 2012, 553, 64–67 CrossRef CAS.
- L. M. Guo, Z. Q. Liu and S. Y. Liu, Chin. J. Anal. Chem., 2005, 36, 495–497 Search PubMed.
- M. Brusnikina, O. Silyukov, M. Chislov, T. Volkova, A. Proshin, A. Mazur, P. Tolstoy and I. Terekhova, J. Therm. Anal. Calorim., 2017, 130, 443–450 CrossRef CAS.
- K. Tang, Y. Chen, K. Huang and J. Liu, Tetrahedron: Asymmetry, 2007, 18, 2399–2408 CrossRef CAS.
- C. S. Nascimento Jr, J. F. Lopes, L. Guimarães and K. B. Borges, Analyst, 2014, 139, 3901–3910 RSC.
- J. J. Passos, F. B. De Sousa, I. S. Lula, E. A. Barreto, J. F. Lopes, W. B. De Almeida and R. D. Sinisterra, Int. J. Pharm., 2011, 421, 24–33 CrossRef CAS PubMed.
- J. F. Lopes, C. S. Nascimento Jr, C. P. A. Anconi, H. F. Dos Santos and W. B. De Almeida, J. Mol. Graphics, 2015, 62, 11–17 CrossRef CAS PubMed.
- H. Santillán-Vargas, J. Z. Ramírez, J. Garza and R. Vargas, Int. J. Quantum Chem., 2012, 112, 3587–3593 CrossRef.
- G. Nieto-Malagón, J. M. Hernández-Pérez, R. Vargas and J. Garza, Int. J. Quantum Chem., 2012, 112, 3552–3557 CrossRef.
- D. T. Thao, K. Nauwelaerts, L. Baudemprez, M. Van Speybroeck, J. Vermant, P. Augustijns, P. Annaert, J. Martens, J. Van Humbeeck and G. Van den Mooter, J. Inclusion Phenom. Macrocyclic Chem., 2011, 71, 137–147 CrossRef.
- U. Domanska, A. Pelczarska and A. Pobudkowska, Int. J. Mol. Sci., 2011, 12, 2383–2394 CrossRef CAS PubMed.
- M. L. Reyes-Reyes, G. Roa-Morales, R. Melgar-Fernández, H. Reyes-Pérez, L. M. Gómez-Oliván, N. González-Rivas, J. Bautista-Renedo and P. Balderas-Hernández, J. Inclusion Phenom. Macrocyclic Chem., 2015, 82, 373–382 CrossRef CAS.
- V. Buko, I. Zavodnik, O. Lukivskaya, E. Naruta, B. Palecz, S. Belica-Pacha, E. Belonovskaya, R. Kranc and V. Abakumov, Chem.-Biol. Interact., 2016, 244, 105–112 CrossRef CAS PubMed.
- M. V. Ol’khovich, A. V. Sharapova, G. L. Perlovich, S. Y. Skachilova and N. K. Zheltukhin, J. Mol. Liq., 2017, 237, 185–192 CrossRef.
- M. Terauchi, A. Tamura, S. Yamaguchi and N. Yui, Int. J. Pharm., 2018, 547, 53–60 CrossRef CAS PubMed.
- S. Adhikari, S. Daftardar, F. Fratev, M. Rivera, S. Sirimulla, K. Alexander and S. H. S. Boddu, Int. J. Pharm., 2018, 545, 357–365 CrossRef CAS PubMed.
- R. W. Seidel and B. B. Koleva, Acta Crystallogr., Sect. E: Struct. Rep. Online, 2009, 65, o3162–o3163 CrossRef CAS PubMed.
- F. Caruso, A. Besmer and M. Rossi, Acta Crystallogr., Sect. C: Cryst. Struct. Commun., 1999, 55, 1712–1714 CrossRef.
- L. Lagardere, L. H. Jolly, F. Lipparini, F. Aviat, B. Stamm, Z. F. Jing, M. Harger, H. Torabifard, G. A. Cisneros, M. J. Schnieders, N. Gresh, Y. Maday, P. Y. Ren, J. W. Ponder and J. P. Piquemal, Chem. Sci., 2018, 9, 956–972 RSC.
- I. S. Ufimtsev and T. J. Martinez, J. Chem. Theory Comput., 2009, 5, 2619–2628 CrossRef CAS PubMed.
- A. V. Titov, I. S. Ufimtsev, N. Luehr and T. J. Martinez, J. Chem. Theory Comput., 2013, 9, 213–221 CrossRef CAS PubMed.
- J. Contreras-García, E. R. Johnson, S. Keinan, R. Chaudret, J.-P. Piquemal, D. N. Beratan and W. Yang, J. Chem. Theory Comput., 2011, 7, 625–632 CrossRef PubMed.
- E. R. Johnson, S. Keinan, P. Mori-Sánchez, J. Contreras-García, A. J. Cohen and W. Yang, J. Am. Chem. Soc., 2010, 132, 6498–6506 CrossRef CAS PubMed.
- K. B. Lipkowitz, Chem. Rev., 1998, 98, 1829–1874 CrossRef CAS PubMed.
- R. Hernández-Esparza, S. M. Mejía-Chica, A. D. Zapata-Escobar, A. Guevara-García, A. Martínez-Melchor, J. M. Hernández-Pérez, R. Vargas and J. Garza, J. Comput. Chem., 2014, 35, 2272–2278 CrossRef PubMed.
- R. Hernández-Esparza, A. Vázquez-Mayagoitia, L. A. Soriano-Agueda, R. Vargas and J. Garza, Int. J. Quantum Chem., 2019, 119, e25671 CrossRef.
- J. C. Cruz, R. Hernández-Esparza, A. Vázquez-Mayagoitia, R. Vargas and J. Garza, J. Chem. Inf. Model., 2019, 59, 3120–3127 CrossRef CAS PubMed.
- B. P. Hay, D. Zhang and J. R. Rustad, Inorg. Chem., 1996, 35, 2650–2658 CrossRef CAS PubMed.
- B. P. Hay, D. A. Dixon, R. Vargas, J. Garza and K. N. Raymond, Inorg. Chem., 2001, 40, 3922–3935 CrossRef CAS PubMed.
- J. J. García, R. Hernández-Esparza, R. Vargas, W. Tiznado and J. Garza, New J. Chem., 2019, 43, 4342–4348 RSC.
- A. M. Navarrete-López, J. Garza and R. Vargas, J. Phys. Chem. A, 2007, 111, 11147–11152 CrossRef PubMed.
Footnote |
| † Electronic supplementary information (ESI) available. See DOI: 10.1039/c9ra10218c |
| This journal is © The Royal Society of Chemistry 2020 |

