
 Open Access Article
 This Open Access Article is licensed under a Creative Commons Attribution-Non Commercial 3.0 Unported Licence
High capacity rock salt type Li2MnO3−δ thin film battery electrodes
Henry A. Müllera,
Yug Joshi *a,
Efi Hadjixenophontosa,
Claudia Petera,
Gábor Csiszára,
Gunther Richterb and
Guido Schmitza
*a,
Efi Hadjixenophontosa,
Claudia Petera,
Gábor Csiszára,
Gunther Richterb and
Guido Schmitza
aChair of Materials Physics, Institute of Materials Science, University of Stuttgart, Heisenbergstraße 3, 70569 Stuttgart, Germany. E-mail: yug.joshi@mp.imw.uni-stuttgart.de
bMax-Planck-Institute for Intelligent Systems, Heisenbergstraße 3, 70569 Stuttgart, Germany
First published on 22nd January 2020
Abstract
Recent investigations of layered, rock salt and spinel-type manganese oxides in composite powder electrodes revealed the mutual stabilization of the Li–Mn–O compounds during electrochemical cycling. A novel approach of depositing such complex compounds as an active cathode material in thin-film battery electrodes is demonstrated in this work. It shows the maximum capacity of 226 mA h g−1 which is superior in comparison to that of commercial LiMn2O4 powder as well as thin films. Reactive ion beam sputtering is used to deposit films of a Li2MnO3−δ composition. The method allows for tailoring of the active layer's crystal structure by controlling the oxygen partial pressure during deposition. Electron diffractometry reveals the presence of layered monoclinic and defect rock salt structures, the former transforms during cycling and results in thin films with extraordinary electrochemical properties. X-ray photoelectron spectroscopy shows that a large amount of disorder on the cation sub-lattices has been incorporated in the structure, which is beneficial for lithium migration and cycle stability.
Introduction
Importance of lithium-ion batteries
Today, rechargeable batteries are in use in billions of mobile devices such as phones, tablets and notebook computers, sensors, and the like. High specific capacity, a long lifetime and good thermal and mechanical stability, all at low cost, are desired.1 Besides tackling the challenge to better fulfil these requirements, interest in thin-film batteries has grown.† With a typical electrode thickness between a few nanometres and a few micrometres, they offer high flexibility and energy density whilst preserving good cycling stability.2–5 The availability of long-lasting rechargeable micro-batteries will encourage their on-chip implementation and developments in applications from medical devices like pacemakers to independent wireless sensors.2–4Manganese oxides have been established as promising active materials for use in battery cathodes. They provide high rate capabilities and good specific capacities while being cheaper and less toxic than cobalt oxide, which is used in the biggest share of today's Li-ion batteries. A wide range of different manganese oxide compounds have been investigated for possible applications as electroactive material in supercapacitors6–8 and in both negative9 and positive10,11 electrodes for secondary batteries. For the reader's perusal, we provide a comprehensive overview of the most important manganese oxides used in battery electrodes to help understand the electrochemical and microstructural behaviour of the thin films reported herein.
Lithium manganese oxide as cathode material
Fig. 1 depicts a section of the ternary Li–Mn–O phase diagram at 25 °C.12 Notably, almost all the compounds within Fig. 1 are derived from a cubic close-packed oxygen lattice.11,13,14 The different stoichiometries are achieved by adding various ratios of manganese and lithium. More importantly, the degree to which the interstitial sites of the oxygen lattice are filled, the coordination of the cations and the state of order or disorder have a large influence on the symmetry of the crystal. As a result, cubic, orthorhombic, monoclinic or tetragonal unit cells are used to represent diverse lithium-manganese oxides.10,11,15–18 In other words, changing the order of cations in the oxygen lattice effectively changes the point group i.e. symmetry of the unit cell.10 Several Li–Mn–O structures can exist even within the same particle or grain due to the shared oxygen lattice and phase or structure changes are usually continuous.19 It has not been established with certainty whether these compounds exclusively exist as either (nano-) composites containing heterogeneous grains of different structures or as single-phase containing domains separated by stacking faults and disordered layers; evidence of both has been reported.10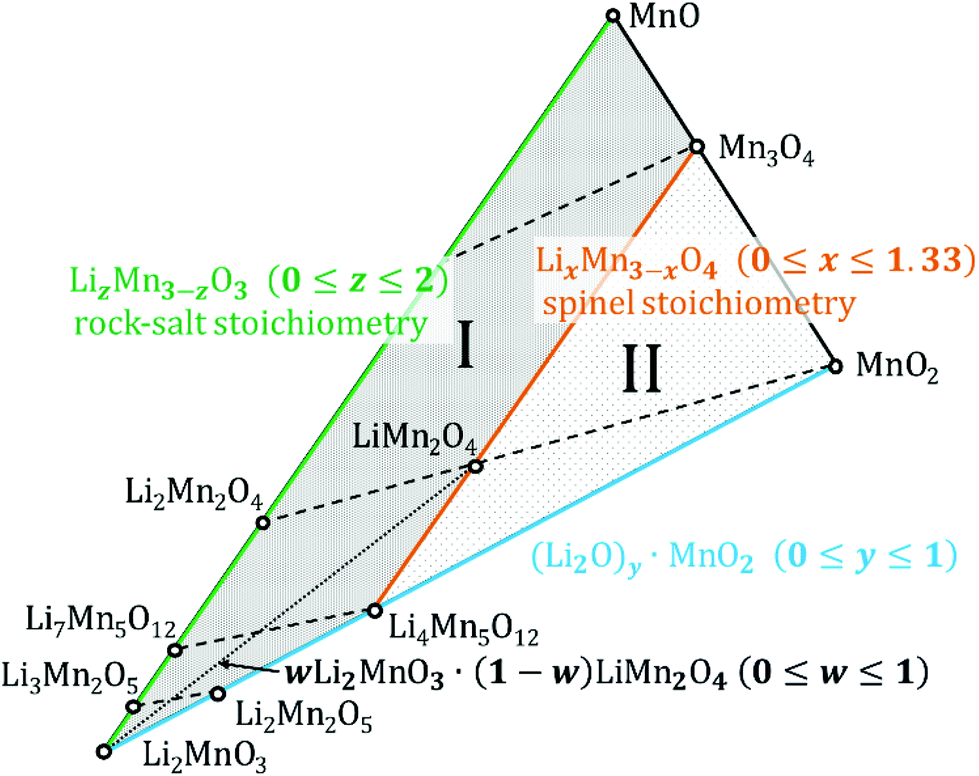 | ||
| Fig. 1 Isothermal section of the Li–Mn–O phase diagram at 25 °C. Based on phase diagrams previously published.40,43 Dashed lines indicate the removal of Li from the respective structures from left to right. The area marked I contains defect rock salt structures, the area marked II encloses defect spinel structures. The dotted line indicates the addition of monoclinic Li2MnO3 to spinel-structured LiMn2O4 to achieve structural stabilization during cycling. | ||
Spinel type LiMn2O4 (or LMO)
On the Li4Mn5O12–Mn3O4 tie-line [LixMn3−xO4 (0 ≤ x ≤ 1.33)] lie the structures with a spinel stoichiometry (AB2O4 where A and B respectively occupy the tetrahedral and octahedral sites in the cubic close-packed oxygen lattice,13 space group Fd![[3 with combining macron]](https://www.rsc.org/images/entities/char_0033_0304.gif) m (ref. 17)). Stoichiometries that fall in the area marked as II in Fig. 1 crystallize in defect spinel structures (cation deficient spinel). Dashed lines in the figure indicate the phase changes during lithiation and delithiation.
m (ref. 17)). Stoichiometries that fall in the area marked as II in Fig. 1 crystallize in defect spinel structures (cation deficient spinel). Dashed lines in the figure indicate the phase changes during lithiation and delithiation.
Of all the lithium manganese oxides the one most prominently utilized in battery cathodes is LiMn2O4, usually referred to as LMO or slight stoichiometric variations thereof. Upon delithiation (i.e. charge of a battery cell) it transforms into λ-MnO2 (along the dashed line to the right) which has the same cubic structure but a diminished lattice parameter.20 The unoccupied interstitial sites facilitate the movement of the Li+ ions during discharge, thus high rates can be achieved.21 The insertion of the first Li+ into the tetrahedral sites takes place at about 4 V vs. Li/Li+. The insertion process of a second Li+ is centred at 3 V and causes the displacement of the lithium from tetrahedral to octahedral sites.5,13 The result is a Li2Mn2O4 stoichiometry. Mn3+ is Jahn–Teller-active, thus, a drop of the average manganese oxidation state below +3.5 causes a distortion towards a tetragonal symmetry (I41/amd (ref. 17)). This accounts for the capacity fade when a pristine LiMn2O4 is repeatedly cycled below 3 V.12,19,22 During fast dis/charging the oxidation state of Mn in pristine LiMn2O4 can drop locally already below 3.5 when cycled close to 3 V, thereby reducing the cyclic stability. This loss of stability can be minimized by using Li-rich spinel (Li1+δMn2−δO4) as this will force the Mn oxidation state to stay always above +3.5.11,12
Rock salt structure-type manganese oxides
The Li2MnO3–MnO tie line (LizMn3−zO3 with 0 ≤ z ≤ 2) indicates structures with a rock salt stoichiometry (1![[thin space (1/6-em)]](https://www.rsc.org/images/entities/char_2009.gif) :1 ratio between cations and anions). This does not necessarily mean they all have a rock salt symmetry (space group Fmm (ref. 14)) – for instance Li2Mn2O4 is tetragonal. Stoichiometries enclosed in the area between the rock salt and spinel lines (marked as I in Fig. 1) are referred to as defect rock salt structures. It is well known that during discharge, electrodes from spinel-type manganese oxides will form disordered rock salt structures, eventually with rock salt stoichiometry.5,23 The differences in structure are understood to be caused by cation exchange and migration while the oxygen sub-lattice remains unchanged.
:1 ratio between cations and anions). This does not necessarily mean they all have a rock salt symmetry (space group Fmm (ref. 14)) – for instance Li2Mn2O4 is tetragonal. Stoichiometries enclosed in the area between the rock salt and spinel lines (marked as I in Fig. 1) are referred to as defect rock salt structures. It is well known that during discharge, electrodes from spinel-type manganese oxides will form disordered rock salt structures, eventually with rock salt stoichiometry.5,23 The differences in structure are understood to be caused by cation exchange and migration while the oxygen sub-lattice remains unchanged.
Monoclinic Li2MnO3 and derivatives
In Li2MnO3, the underlying fcc oxygen sub-lattice known from the spinel and rock salt structures is deformed. The layers of octahedral sites are filled with Li and [Li1/3Mn2/3] in an alternating manner. This results in a monoclinic symmetry (space group C2/m (ref. 16)) which is often just referred to as layered structure in literature.11,16,19,24 The stoichiometries on the Li2MnO3–MnO2 tie-line are formally achieved by removing Li2O from the Li2MnO3 compound ((Li2O)y·MnO2 with 0 ≤ y ≤ 1).The oxidation of manganese beyond Mn4+ in an octahedral oxygen environment is not considered a feasible option,25 therefore for a long time the Li2MnO3 layered structure was believed to be electrochemically inactive.24,26 Kalyani et al. were the first to confute this hypothesis.22 Nowadays it is commonly accepted that the monoclinic structure can undergo electrochemical cycling, but it has to be activated before.11,19,24,26 The activation method used in this work will be explained in greater detail in the discussion part.
When cycled in chronopotentiometry, the activated Li2MnO3-based cells show a sloping voltage profile with an approximate plateau centred around 3 V vs. Li/Li+.19,22,27 The potential needed for lithium insertion probably varies with the positions of the Mn atoms in the transition metal layer. The process takes place across a scope of voltages, the range of which depends on the actual composition of the electrode.27
Efforts have been made to improve both, capacity and cycle stability of Li–Mn–O cathode materials by integrating them in composite electrodes.11,19 These can contain substituted manganese oxides LiMO2 (M = Mn, Ni, Co) but also multiple different manganese oxide structures. Since monoclinic, spinel and rock salt structures share a common oxygen lattice, the active spinel component may be structurally stabilized by adding an electrochemically inactive Li2MnO3 component (see dotted line in Fig. 1). This will lower the amount of Jahn–Teller distortion by increasing the average oxidation state of manganese (i.e. greater than +3.5).11,19 On the other hand, Li2MnO3-based electrodes themselves contain several structures after the activation. Therefore, they are sometimes interpreted as composite electrodes as well.
In this work we show that, the oxygen partial pressure during sputter deposition can be varied conveniently to achieve different compositions and structures in the films produced from a constant target with the nominal composition Li2MnO2.75 (for details see Experimental section). The samples deposited using 10% oxygen partial pressure are referred to as LMOx10, samples deposited using 35% oxygen partial pressure are referred to as LMOx35. This detail of the procedure is important because, as we will show, the oxygen content in the layer fundamentally affects its microstructure and electrochemical behaviour. In the following, the term LMO refers to the well-known material with a spinel structure and a nominal LiMn2O4 composition.
Experimental section
Material preparation
Oxidized silicon <111> wafers (Siltronic AG) were used as substrate. A Pt film, 50 nm in thickness, was deposited to act as current collector. Active thin films of 85 nm thickness were deposited thereon using a target with the nominal composition of Li2MnO2.75. For producing the target, a mixture of LiMn2O4 powder (electrochemical grade, Sigma-Aldrich, CAS 12057-17-9) and Li2O (Sigma-Aldrich, CAS 12057-24-8) in a 2:3 mass ratio was cold pressed and sintered at 900 °C for 12 h.
A custom-built ion beam sputtering chamber was used for deposition.28 The ion source (Roth & Rau AG, 4 cm diameter) uses a radio frequency (RF) of 13.56 MHz to create an Ar-plasma. The operation argon pressure in the chamber was about 5 × 10⁻⁴ mbar. Additionally, oxygen was introduced as reactive gas with partial pressures corresponding to 10% and 35% of the resulting total pressure for LMOx10 and LMOx35, respectively. The source was operated with a power of 140 W and the acceleration voltage was set to 0.7 kV resulting in a beam current of 27 mA. The ion beam and an electron beam were activated alternatingly with a frequency of 11.6 kHz (ion beam for 80% of total sputtering time) to prevent target charging.
Annealing was performed under an ambient atmosphere. The samples were placed into the preheated furnace at 450 °C for a nominal annealing time of 165 min and left in air to cool to room temperature afterward.
For electron diffraction of films on TEM grids, 30 nm thin films of the active material were deposited directly on S 160-type carbon-coated TEM grids (made from nickel or copper) using the same conditions as previously used for the electrodes on the Pt current collector. Also, the same annealing treatment was applied.
To determine the thickness of the sputtered thin films, TEM images were acquired from lamellas prepared with the FIB lift-out technique29,30 using an FEI Scios dual-beam microscope. The cycled area of each individual electrode (circa 0.6 cm2) was measured using a calibrated light microscope.
Structural and chemical analysis
TEM analysis was carried out on a Philips CM200-FEG at an operating voltage of 200 kV. Selective area electron diffraction (SAED) patterns were acquired from films deposited directly on TEM grids (see above) and the scraped-off surface of actual electrodes. For the latter, a glass cutter with a diamond tip was used to scrape parts of the active layer (without the Pt current collector) off the silicon wafer and onto a clean TEM-grid. For indexing diffraction patterns CrysTBox RingGUI 1.16 was used.31,32 Theoretical patterns of the following materials were used as reference for fitting the respective crystal structures: LiMnO2 for rock salt, LiMn2O4 for spinel, Li2MnO3 for monoclinic.For XPS, a Theta Probe Angle-Resolved X-ray Photoelectron Spectrometer System (Thermo Fischer Scientific Inc.) with a source power of 100 W was used. The spectra were collected with a resolution of 0.1 eV and a pass energy of 50 eV. The adventitious C 1s peak was set to 284.8 eV to correct for charging. All spectra were modelled using parameters according to Biesinger et al.33 Prior to XPS measurements all the films were cleaned with acetone followed by ethanol and isopropanol.
Electrochemical characterization
Three electrode cells were used for the electrochemical measurements. For both, reference and counter electrode, lithium metal (Albemarle Germany GmbH) was used hence all the potentials mentioned in this work are with respect to lithium. A 1 M solution of lithium perchlorate (LiClO4, Sigma-Aldrich, CAS: 7791-03-9) in a 1:1 mass mixture of ethylene carbonate (EC, Alpha-Aesar, CAS: 96-49-1) and dimethyl carbonate (DMC, Sigma-Aldrich, CAS: 616-38-6) was employed as a liquid electrolyte. The cells were assembled and sealed airtight in an argon-filled glove box. For all electrochemical measurements, a VSP-300 multi potentiostat (Bio-Logic SAS) was utilized. Both cyclic voltammetry (CV) and chronopotentiometry (CP) were undertaken in the voltage range of 2 V to 4.4 V vs. Li/Li+ using a scan rate of 1 mV s−1 and a current of 10 μA, respectively. The specific capacities were calculated by integrating the current in the CV and by calculating the mass by the known volume (determined from the area of the layer immersed in the electrolyte and the thickness from the TEM micrograph). The density used for the calculation is 3.98 g cm−3 which is in agreement with the monoclinic as well as the rock salt type structures.34,35
Results
Electron diffraction
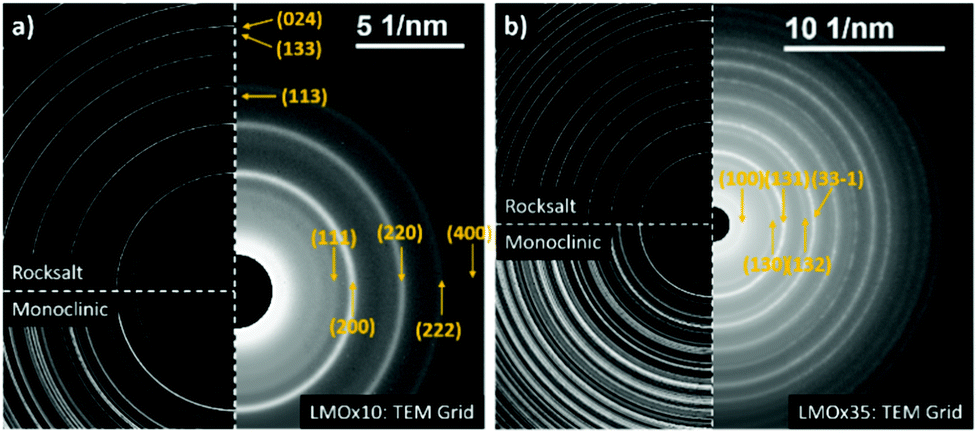 | ||
| Fig. 2 Electron diffraction patterns of LMOx10 (a) and LMOx35 (b) deposited on TEM grids. LMOx10 is better fitted with a LiMnO2 pattern to reference rock salt symmetry and is indexed accordingly.36 LMOx35 has a higher number of maxima which better match the pattern of monoclinic Li2MnO3 (ref. 37) and is indexed according to the monoclinic structure. | ||
The diffraction pattern of the LMOx10 layer sputtered on a grid closely matches a rock salt structure for which the LiMnO2 was used as a ref. 36. As a result, the lattice parameter of the unit cell in the LMOx10 sample is calculated to be 4.22 Å for the rock salt structure. The maxima (113) and (133) present in the reference pattern do not appear in the acquired diffraction patterns, which may be due to the particular growth texture of the thin film texture, while a weak additional maximum is located at a lower angle (lower than the (111) plane). It corresponds to the theoretical (100) reflection which does not satisfy the selection rules of the rock salt structure (the most natural explanation would be a partly ordered distribution of Mn atoms on subsequent (200) lattice planes). In contrast, the diffraction pattern of the LMOx35 material shows significantly more reflections and thus is in good agreement with the monoclinic symmetry of Li2MnO3 (reference pattern as per (ref. 37)). It should be noted here that, for the monoclinic structure, the first maximum matches to the already mentioned (100) reflection. Therefore, the presence of a minor fraction of domains of this monoclinic structure in the LMOx10 films, obtained with lower oxygen pressure cannot be excluded.
Since both kinds of films are synthesized using the same target, we conclude that by controlling the oxygen partial pressure various structures and presumably various compositions of the deposited layer can be achieved. While LMOx10 primarily satisfies the rock salt-type structure investigating LMOx35 reveals predominantly a monoclinic structure.
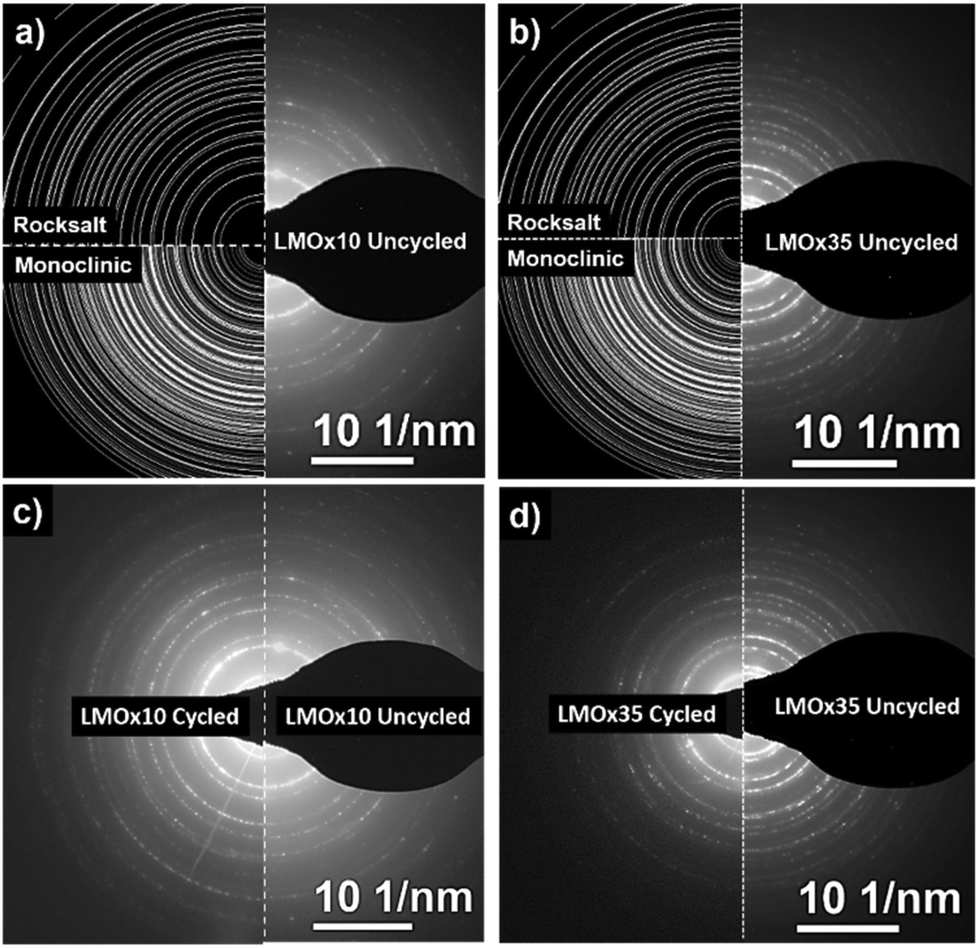 | ||
| Fig. 3 The electron diffraction pattern of LMOx10 (a and c) and LMOx35 (b and d) obtained from the electrode layer scraped off the substrate. (a) Shows the SAED pattern of the as-annealed LMOx10 and (b) the SAED pattern of the as-annealed LMOx35. In addition, a comparison between the patterns before cycling in the right section and after 50 CV cycles in the left section is shown for LMOx10 (c) and for LMOx35 (d). | ||
Both films were subjected to electrochemical cycling in a voltage range of 2.0 V to 4.4 V vs. Li/Li+ for 50 cycles with the measurement ending at 4.4 V. The diffraction patterns after this electrochemical operation are compared to the as-deposited and annealed states in Fig. 3(c) and (d) for the LMOx10 and the LMOx35 films, respectively.
Interestingly, the electron diffraction patterns of the LMOx10 layer before and after cycling are indistinguishable (see Fig. 3(c)), but the patterns of the LMOx35 films differ substantially (see Fig. 3(d)). In the LMOx35, before cycling, many reflections are observed, matching either to the monoclinic and/or the rock salt diffraction pattern but after cycling, many reflections have disappeared entirely, and the pattern practically matches that of the LMOx10 samples (best described by a defective rock salt structure), hinting that the LMOx35 material experiences an important structural transformation during cycling.
Electrochemical characterization
Both films were subjected to cycling tests in cyclic voltammetry and chronopotentiometry between 2.0 and 4.4 V with a rate of 1 mV s−1 and an absolute current of 10 μA (resulting in dis-/charge rate of 1.63C and 2.73C for LMOx10 and LMOx35, respectively). The initial cycles for both kinds of films are presented in Fig. 4(a) and (b), later ones up to the 50th cycle are shown in Fig. 4(c) and (d) and the dis-/charge profile are shown in Fig. 4(e) and (f), respectively. The effect of the deposition under different oxygen partial pressure, yielding two different structures, is reflected in a different number of cycles needed for “running in” the electrode layer: the electrochemical activation of the monoclinic lithium manganese oxide (see Fig. 4(a)) takes place in the first few cycles. Indeed, the formation of clear charge and discharge peaks is completed after five cycles in the LMOx10 as can be seen in Fig. 4(a). In contrast, Fig. 4(b) shows that still no significant charge and discharge peaks can be observed after ten cycles in the case of the LMOx35 samples. Instead, these electrodes need up to 30 charge/discharge cycles for a full electrochemical activation (Fig. 4(c)). The main charging (i.e. delithiation) peak of LMOx10 remains at 3.3 V vs. Li/Li+ during further cycling (Fig. 4(c)) even though significant removal of Li continues into the range above 3.8 V. The main discharge peak (intercalation of Li) is located at 3.1 V. The most pronounced charging and discharging peaks of the LMOx35 phase are located at 3.1 V and 2.8 V vs. Li/Li+ respectively (Fig. 4(d)). After 20 full cycles, additional peaks become visible in the 4 V region. A significant change in the peak position can be noted during the course of the experiment. In comparison, LMOx10 samples have much broader charge and discharge peaks at slightly higher voltages (ca. +0.3 V compared to LMOx35). From the CP data, the corresponding lithiation plateaus can be seen. Fig. 4(e) shows a sloppy “plateau” centred at around 3 V, whereas Fig. 4(f) shows two plateaus, a prominent one around 2.8 V contributing most to the capacity, another small plateau at around 4 V (which evolved during CV cycles too, see Fig. 4(b), performed before the CP). It can be seen from Fig. 4(f), that even after 50 CV cycles the capacity still increases, albeit slowly. Whereas for LMOx10, a gradual decrease in capacity is observed in Fig. 4(e). | ||
| Fig. 4 Cyclic voltammetry of a LMOx10 electrode (a) and (c) and of a LMOx35 electrode (b) and (d). The rate applied is 1 mV s−1. A potential window from 2.0 V to 4.4 V vs. Li/Li+ has been used. Ten subsequent CP recording during lithiation of LMOx10 at 1.6C rate (or 430 mA g−1) (e) and of LMOx35 at 2.7C rate (or 395 mA g−1) (f) after 50 and 60 CV cycles, respectively. | ||
The evaluated capacities are presented in Fig. 5. The maxima amount to 226 mA h g−1 (after 10 cycles) and 185 mA h g−1 (after 32 cycles) for the LMOx10 and LMOx35 samples, respectively (Fig. 5(a)). The different cycle number to reach the maximum capacity also highlights the different ‘running-in period’ in the films. Because of the quicker electrochemical activation, better stability and superior capacity, the LMOx10 was investigated further (Fig. 5(b)): after reaching its maximum at ten cycles, the capacity repeatedly fluctuates between 150 and 200 mA h g−1 until gradually decreasing to 60% of the former maximum at 140 cycles. Thereafter, the capacity stabilizes (a maximum of 200 cycles were investigated). The fluctuations observed in the capacity plots may be attributed to localized phase transformations (addressed in more detail in the discussion). Remarkably, the trend of a successive capacity fade with cycle number reported for spinel-type LMO electrodes when cycled in a large voltage window (i.e. below 3 V),12,19,22 is not observed in these measurements. This demonstrates the beneficial effect of structural disorder of the cations in battery application: the structure containing defects is significantly more stable to reversible deep intercalation of lithium.15
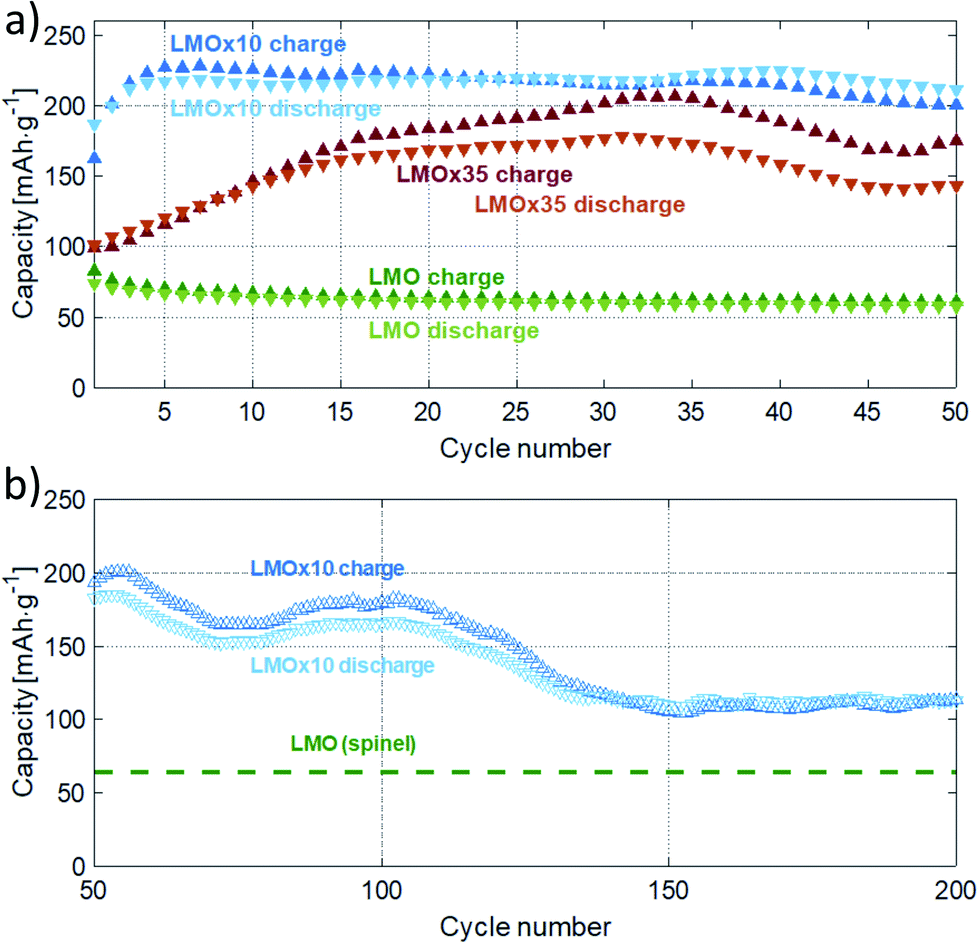 | ||
| Fig. 5 Charge and discharge capacities obtained from cyclic voltammetry at a rate of 1 mV s−1. Cycles one to fifty are shown in (a) for an LMOx10 and an LMOx35 sample together with a spinel LMO electrode as reference. Further cycles of the LMOx10 electrode are given in (b). | ||
Several aspects need to be regarded in comparing the electrochemical capacities. In general, compared to battery tests in literature, relatively high rates are used in this study (usually leading to lower capacities). In addition, rates in cyclic voltammetry (CV) and in chronopotentiometry (CP) cannot be directly compared to each other (constant ramp rate of voltage in CV vs. constant current in CP). It is worth mentioning that the voltage window used for cycling usually also affects the capacity, as it determines which electrochemical side processes are activated and so controls the kinetics of phase transformation during initial cycles and the cyclic stability of the material at high cycle numbers. Finally, capacities observed in thin-film electrodes amount typically to only 50–60% of the values achieved in powder electrodes with the same material.23,26,34,38,39 In view of the aforementioned factors, we also measured conventional LMO layers produced under the same conditions of layer deposition as the layers of interest for a meaningful comparison. The capacity of these conventional LMO films are presented as green data points and dashed green lines in Fig. 5(a) and (b), respectively.39 The direct comparison clearly discovers that the modified defective Li2MnO3−δ layers of this study outperforms the conventional LMO films by at least a factor of two (stabilized capacity, see Fig. 5(b)). Furthermore, the maximum capacity of LMOx10 is four times of the reference LMO thin film (thickness of the LMO thin-film is 100 nm). It should be noted that the capacity calculated for the pristine LMO is obtained from CV performed from 3.4 V to 4.4 V, which is the voltage window in which LMO can be operated to avoid any irreversible phase transformation of the spinel structured LiMn2O4 to the tetragonal Li2Mn2O4 phase. Johnson et al. reported that when powdered LMO is cycled in the voltage window between 2 V to 5 V, a capacity of 225 mA h g−1 is obtained in the first cycle which drops down to 170 mA h g−1 in mere 4 cycles due to the damaging Jahn–Teller distortion (caused by filling of the octahedral sites to form tetragonal Li2Mn2O4 from the cubic spinel).19 Hence it can be stated clearly that the electrochemistry occurring in the LMOx10 and LMOx35 differs distinctly from the pristine LMO and that the modified films of this study offer a way higher reversible charging capacity. For a wider comparison, literature data on charging capacities are compiled in Table 1 together with the value determined in this work. With a CV rate of 1 mV s−1 applied in this study, a complete charge–discharge cycle takes about 80 min, formally corresponding to a C-rate of 0.75C for the specimen with the highest capacity. However, the peak charging current is considerably higher. For instance, the electrode shown in Fig. 4(a) and (c) sustains currents of up to 740 mA g−1; that featured in Fig. 4(b) and (d) sustains 1180 mA g−1 at the respective discharge peaks. This would correspond approximately to rates of 4C and 5C in a constant current experiment, respectively, and is substantially higher than the rates used in the cited literature while still yielding a significantly better capacity.
| Electrode material | Specific capacity [mA h g−1] | After cycle no. (highest available) | Rate | Voltage window | Reference |
|---|---|---|---|---|---|
| Li2MnO3·Li4Mn5O12 | 214 | 10 | C/28, 0.05 mA cm−2 | 2 to 4.95 V | Johnson et al. 2005 (ref. 19) |
| Acid-treated Li2MnO3 | 190 | 11 | C/24, 0.05 mA cm−2 | 2 to 4.5 V | Thackeray et al. 2005 (ref. 11) |
| Li4Mn2O5 | 240 | 8 | C/20, ca. 11 mA g−1 | 1.2 to 4.8 V | Freire et al. 2015 (ref. 34) |
| Li2MnO3 | 138 | 10 | C/13.8, 10 mA g−1 | 2 to 5 V | Phillips et al. 2015 (ref. 40) |
| Mechanochemically treated Li2MnO3 | 185 | 13 | C/4, 46 mA g−1 | 1.2 to 4.8 V | Freire et al. 2017 (ref. 26) |
| 230 | 9 | C/20, 11.5 mA g−1 | |||
| Li2MnO3−δ | 65 | 41 | 2.5C, 160 mA g−1 | 2.5 to 4.7 V | Tan et al. 2018 (ref. 38) |
| 135 | 125 | C/6.75, 20 mA g−1 | |||
| LMOx10 | 226/120 | 10/200 | 1 mV s−1 | 2 to 4.4 V | This work |
| 216 | 52 | 1.6C or 430 mA g−1 | |||
| LMOx35 | 185 | 32 | 1 mV s−1 | ||
| 175 | 70 | 2.7C (395 mA g−1) |
XPS of cycled electrodes
Fig. 6 compares selected ranges of the XPS spectra of the LMOx10 (left column) and the LMOx35 (right column) thin-film electrodes. The measurements were modelled (light blue curve) using initial parameters according to Biesinger et al.41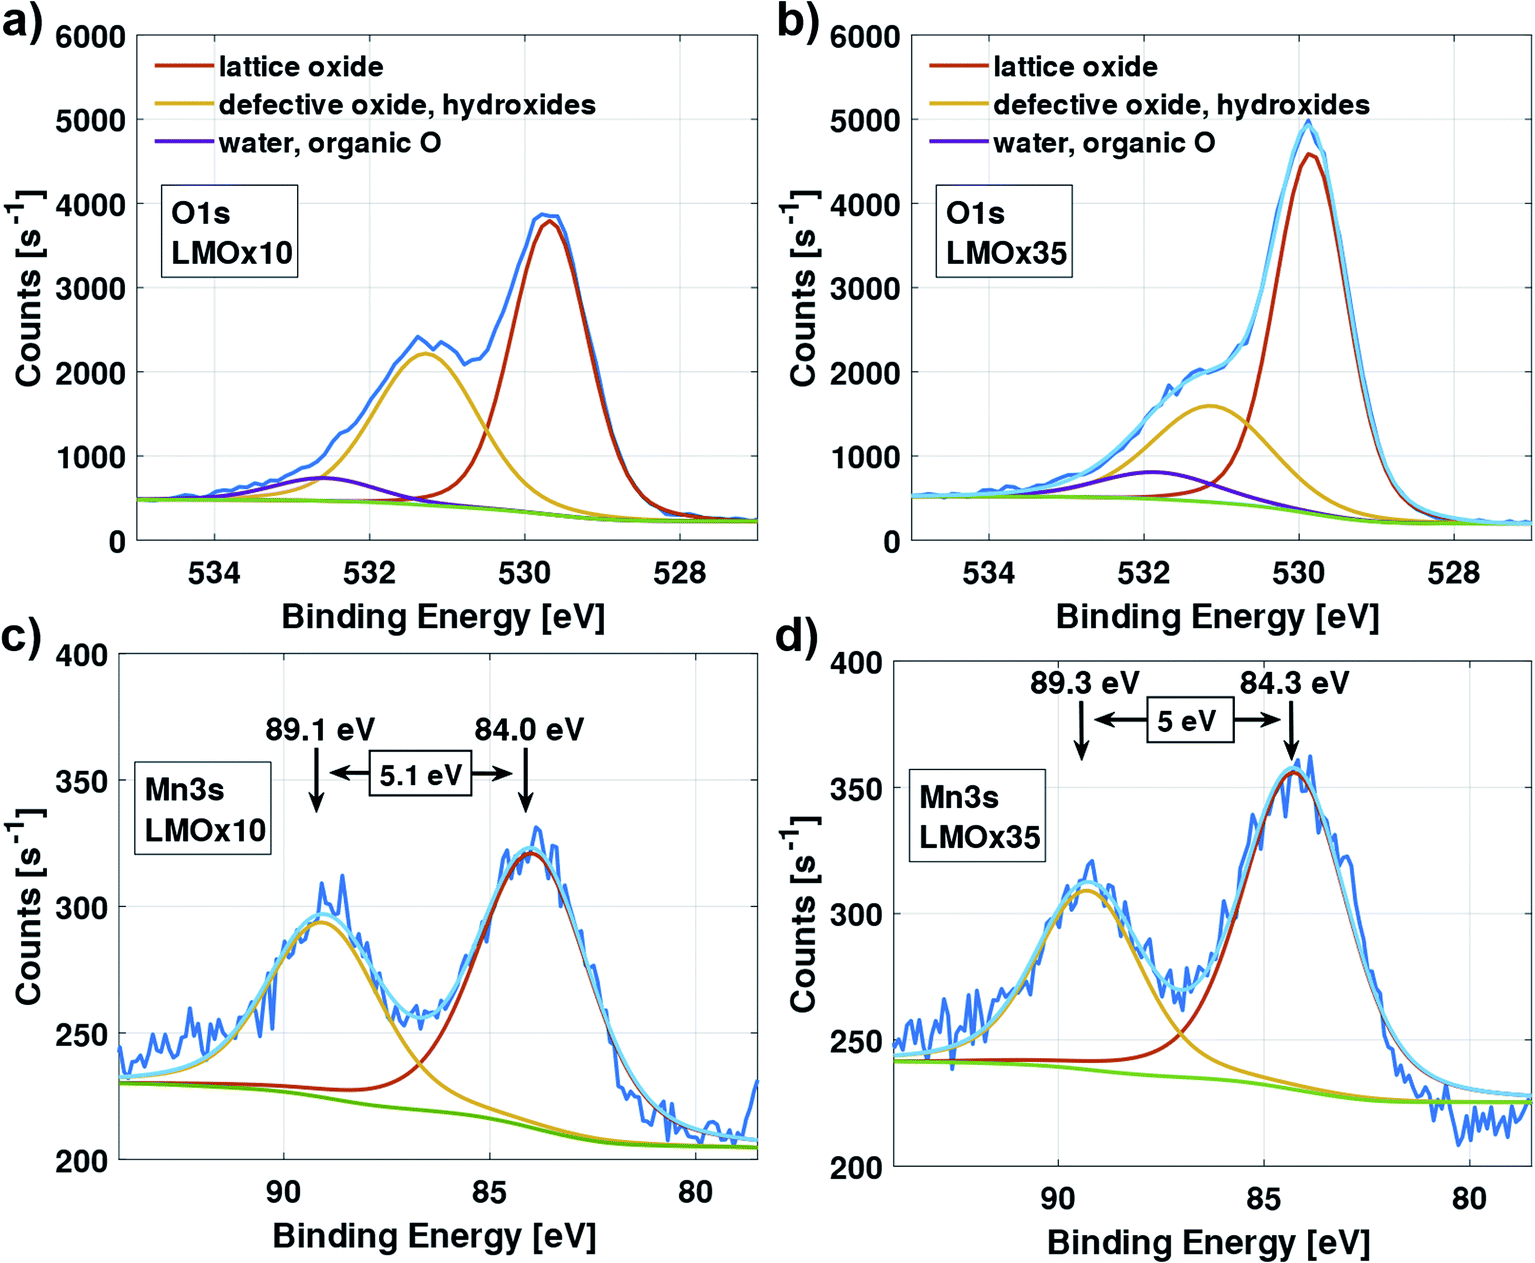 | ||
| Fig. 6 XPS scan of the O 1s peak (top) and Mn 3s peak (bottom) of an LMOx10 electrode layer (a and c); and an LMOx35 electrode layer (b) and (d). The major contributions to the O 1s peak are lattice oxide, and defective oxide, the latter coincides with the binding energy of hydroxides. The doublet-splitting of the Mn 3s peaks corresponds to the Mn oxidation state. | ||
Considering the O 1s spectrum (Fig. 6(a) and (b)), next to the peak of the lattice oxide (binding energy of 529.8 eV), a major contribution at higher binding energy (531.2 eV) is observed which corresponds to defective oxide (oxygen vacancies, non-ideal coordination) and possibly also surface hydroxides. We observe a relative increase of this peak for the oxygen-deficient LMOx10 (Fig. 6(a)) compared to the LMOx35 (Fig. 6(b)).
The Mn 3s region of the spectra of the LMOx10 and LMOx35 electrodes are presented in Fig. 6(c) and (d), respectively. A measurement of the energy splitting of a multiplet is more accurate than the absolute energy value of an observed peak. Therefore, note the reduction of the multiplet splitting from 5.1 eV in LMOx10 to 5.0 eV in LMOx35. This indicates an increase in the manganese oxidation state42 with increasing oxygen partial pressure during deposition and confirms a higher oxygen content in the sample. Note that the presented spectra were acquired after electrochemical characterization which means that even after cycling (i.e. after possibly removing oxygen from the structure during the running-in cycles) the oxygen content is still higher in the sample that was sputtered with higher oxygen pressure.
Discussion
We have presented an alternative procedure for creating battery electrodes from lithium manganese oxide by sputter deposition. Sputter deposition requires the atomic structure to reassemble from individual atoms during growth. Nonetheless, the similarities between the electrochemical properties of the thin films and the powder electrodes of previous studies are remarkable. The different pathways of synthesis and alterations in composition have finally led to the same family of nanocomposites, namely comprising defect rock salt-type along with, to some extent, defective monoclinic structures.Our presented results demonstrate that by tailoring the conditions during ion-beam sputter deposition, a composition ranging close to Li2MnO3−δ can be achieved, which, in comparison to the established spinel LiMn2O4, shows advantageous electrochemical performance.
As mentioned in the results, the material with the LMOx35 composition tends to form primarily a monoclinic lattice structure while the LMOx10 material crystallizes already in a cubic (rock salt-type) structure. During cycling, the initial LMOx35 monoclinic lattice structure transforms into a more stable rock salt like configuration, whereas the crystallographic structure of LMOx10 remains constant. Obviously, the transformation of a less symmetric monoclinic into cubic symmetry is preferred. During the initial charge–discharge cycles, lithium and oxygen are removed from the structure, effectively as Li2O.19,24,26 Several approaches for achieving this removal, both, chemically and electrochemically, have already been demonstrated.11,19,22 Using the electrochemical method, a voltage above 4 V (voltages in a range from ca. 4.2 V to 4.8 V have been reported) is applied upon initial charge.11,19,26,38 At such high voltage, the monoclinic structure becomes unstable and some lithium is withdrawn from it. As the manganese is coordinated octahedrally and thus cannot be oxidized further, oxygen is simultaneously released from the negatively charged electrode to compensate for the charge. This enables the manganese to migrate to more stable positions within the structure which results in the formation of a heterogeneous mixture of differently structured rock salt-like and spinel-like domains.11,23,26,27,40 After this activation process, an electrochemically active structure is left.19,38
Naturally, the duration of the activation process must depend on the initial composition of the material. In this study, the LMOx35 films need 20 to 30 cycles to reach their maximum capacity, while the LMOx10 electrodes need only five cycles. This indicates that the LMOx35 needs to undergo more significant reordering during activation which is confirmed by the SAED analysis reported in the Results. The formation of cubic rock salt-like and spinel-like structures during this process explains the increase in symmetry, hence the loss of rings in the diffraction pattern.26,40 Remarkably, the oxygen-deficient LMOx10 electrodes show no significant modification of the fundamental ring pattern revealing that the structural transformations during activation are minor. To conclude, a rearrangement of the cations takes place in both variants of the sputter-deposited electrodes to facilitate the intercalation and removal of Li-ions. Since the maximum capacity is reached much faster in the case of the LMOx10, obviously less rearrangement is necessary in the material's structure. This indicates that the oxygen vacancies, usually created during the activation, may already be formed during deposition. This, in turn, enables the cations to migrate more easily.
The given interpretation of the structural transformations in the LMOx35 films is well supported by previous reports. Phillips et al. combined LAADF STEM, high-resolution STEM imaging and FFT methods to reveal that pristine Li2MnO3 (monoclinic structure) locally transforms into rock salt and spinel structures upon electrochemical cycling.40 In the end state, the material consisted of a “layered” (i.e. monoclinic) structure and small integrated domains of a spinel structure. Freire et al.34 reported that an overlithiated compound of Li4Mn2O5 preferably occurs with a rock salt structure. Additionally, the conversion of a monoclinic Li2MnO3 compound into an electrochemically active monoclinic structure with nanometre sized domains of a cubic structure was reported.26 The important role of structural defects is further pointed out by Tan et al. who showed by comparing a pristine monoclinic Li2MnO3 powder to an oxygen-deficient Li2MnO3−δ powder that despite the fact that both have a monoclinic structure only the oxygen-deficient powder was electrochemically active.38
The XPS analysis of the layers consistently supports the aforementioned arguments. In the LMOx10 electrodes, the peak related to defective oxide is much larger, indicating that in fact more vacancies are present in this type of layer. On the other hand, the higher oxidation state of the manganese in the LMOx35 electrodes is expected from a higher oxygen content which is confirmed by the chemical shift in the XPS spectra of this material. Correspondingly, the findings of Tan et al. in comparing XPS spectra of a pristine monoclinic Li2MnO3 powder to those of an oxygen-deficient Li2MnO3−δ powder, are consistent with the results reported on sputtered thin films in this study.38 It is also worth mentioning that the XPS scans were acquired after the electrochemical characterization which means that even after cycling (i.e. after possibly removing some part of the oxygen from the structure during the running-in cycles) the oxygen content is still higher in the sample sputtered under larger oxygen pressure. To conclude, the different oxygen content naturally explains the differences in cycling behaviour between the two types of electrodes studied here.
To bring the discussion to a conclusion, the presented procedure for fabricating battery cathode thin films is appropriate for fine-tuning the nanostructure and so tailoring the specific electrochemical properties. The fundamental benefit of the presented thin-film synthesis is that it permits the deposition of an intentionally heterogeneous material that does not require a complicated activation process and combines high capacity and high cyclic stability.
Conclusions
By ion beam sputter deposition from a Li2MnO2.75 target, a lithium manganese oxide film with a defect rock salt structure can be directly obtained which shows promising performance in comparison to films of the conventional spinel LMO (LiMn2O4). Its stoichiometry is close to Li2MnO3 which is generated by providing additional oxygen during the deposition of the film. The material is therefore best described as LixMnO3−δ. These thin-film electrodes exhibit superior cycling stability and do not require acid leaching, ion beam irradiation or mechano-chemical treatment to become electrochemically active. Instead, the use of under stoichiometric amounts of oxygen during deposition minimizes the number of cycles needed until the full capacity is attained. A large number of defects beneficial for lithium migration and cyclability is incorporated in the structure as a result of the synthesis approach. A maximum capacity of 226 mA h g−1 after 10 cycles was achieved. After reaching its maximum, the capacity drops to roughly 60% after 140 cycles and stabilizes. As this stabilized capacity still doubles the value observed in comparable spinel LMO electrodes, this exceptional performance shows the promising potential of the complex nano-phase electrode material, and even a more stable performance in the thin film than in their powder counterpart.Conflicts of interest
There are no conflicts to declare.Acknowledgements
Joint support by the German Science Foundation (DFG, INST 41/982-1) and the Baden-Württemberg Foundation in the acquisition of the dual-beam microscope is gratefully acknowledged. Also, support by the European Union (Marie-Curie ITN ‘Ecostore’, grant agreement no. 607040) is acknowledged.Notes and references
- B. Scrosati and J. Garche, J. Power Sources, 2010, 195, 2419–2430 CrossRef CAS.
- N. J. Dudney, Electrochem. Soc. Interface, 2008, 17, 44–48 CAS.
- J. Bates, Solid State Ionics, 2000, 135, 33–45 CrossRef CAS.
- M. Koo, K. Il Park, S. H. Lee, M. Suh, D. Y. Jeon, J. W. Choi, K. Kang and K. J. Lee, Nano Lett., 2012, 12, 4810–4816 CrossRef CAS PubMed.
- M. M. Thackeray, J. Electrochem. Soc., 1997, 144, L100–L102 CrossRef CAS.
- D. P. Dubal, D. S. Dhawale, R. R. Salunkhe and C. D. Lokhande, J. Electrochem. Soc., 2010, 157, A812 CrossRef CAS.
- S.-C. Pang and M. A. Anderson, J. Mater. Res., 2000, 15, 2096–2106 CrossRef CAS.
- K. V. Sankar, D. Kalpana and R. K. Selvan, J. Appl. Electrochem., 2012, 42, 463–470 CrossRef CAS.
- Y. Zhang, Y. Yan, X. Wang, G. Li, D. Deng, L. Jiang, C. Shu and C. Wang, Chem.–Eur. J., 2014, 20, 6126–6130 CrossRef CAS PubMed.
- J. Wang, X. He, E. Paillard, N. Laszczynski, J. Li and S. Passerini, Adv. Energy Mater., 2016, 6, 1600906 CrossRef.
- M. M. Thackeray, C. S. Johnson, J. T. Vaughey, N. Li and S. A. Hackney, J. Mater. Chem., 2005, 15, 2257 RSC.
- R. J. Gummow, A. de Kock and M. M. Thackeray, Solid State Ionics, 1994, 69, 59–67 CrossRef CAS.
- M. M. Thackeray, J. Electrochem. Soc., 1992, 139, 363 CrossRef CAS.
- J. Akimoto, Y. Takahashi, Y. Gotoh, K. Kawaguchi, K. Dokko and I. Uchida, Chem. Mater., 2003, 15, 2984–2990 CrossRef CAS.
- N. V. Kosova and E. T. Devyatkina, Chem. Sustainable Dev., 2004, 12, 347–352 Search PubMed.
- A. Boulineau, L. Croguennec, C. Delmas and F. Weill, Solid State Ionics, 2010, 180, 1652–1659 CrossRef CAS.
- P. Strobel, F. Le Cras, L. Seguin, M. Anne and J.-M. Tarascon, J. Solid State Chem., 1998, 135, 132–139 CrossRef CAS.
- Y. Xie, Y. Jin and L. Xiang, Crystals, 2017, 7, 221 CrossRef.
- C. S. Johnson, N. Li, J. T. Vaughey, S. A. Hackney and M. M. Thackeray, Electrochem. Commun., 2005, 7, 528–536 CrossRef CAS.
- W. Liu, K. Kowal and G. C. Farrington, J. Electrochem. Soc., 1998, 145, 459–465 CrossRef CAS.
- M. Lanz, C. Kormann, H. Steininger, G. Heil, O. Haas and P. Novák, J. Electrochem. Soc., 2000, 147, 3997–4000 CrossRef CAS.
- P. Kalyani, S. Chitra, T. Mohan and S. Gopukumar, J. Power Sources, 1999, 80, 103–106 CrossRef CAS.
- P. J. Phillips, J. Bareño, Y. Li, D. P. Abraham and R. F. Klie, Adv. Energy Mater., 2015, 5, 1–12 Search PubMed.
- A. D. Robertson and P. G. Bruce, Chem. Mater., 2003, 15, 1984–1992 CrossRef CAS.
- J. A. Saint, M. M. Doeff and J. Reed, J. Power Sources, 2007, 172, 189–197 CrossRef CAS.
- M. Freire, O. I. Lebedev, A. Maignan, C. Jordy and V. Pralong, J. Mater. Chem. A, 2017, 5, 21898–21902 RSC.
- D. Y. W. Yu and K. Yanagida, J. Electrochem. Soc., 2011, 158, A1015 CrossRef CAS.
- S. Nowak, F. Berkemeier and G. Schmitz, J. Power Sources, 2015, 275, 144–150 CrossRef CAS.
- L. A. Giannuzzi, B. W. Kempshall, S. M. Schwarz, J. K. Lomness, B. I. Prenitzer and F. A. Stevie, in Introduction to Focused Ion Beams, ed. L. A. Giannuzzi and F. A. Stevie, Springer, Boston, MA, 2005, pp. 201–228 Search PubMed.
- L. A. Giannuzzi, J. L. Drown, S. R. Brown, R. B. Irwin and F. A. Stevie, Microsc. Res. Tech., 1998, 41, 285–290 CrossRef CAS PubMed.
- M. Klinger, J. Appl. Crystallogr., 2017, 50, 1226–1234 CrossRef CAS.
- M. Klinger and A. Jäger, J. Appl. Crystallogr., 2015, 48, 2012–2018 CrossRef CAS PubMed.
- M. C. Biesinger, L. W. M. Lau, A. R. Gerson and R. S. C. Smart, Appl. Surf. Sci., 2010, 257, 887–898 CrossRef CAS.
- M. Freire, N. V. Kosova, C. Jordy, D. Chateigner, O. I. Lebedev, A. Maignan and V. Pralong, Nat. Mater., 2016, 15, 173–177 CrossRef CAS PubMed.
- J. Bréger, M. Jiang, N. Dupré, Y. S. Meng, Y. Shao-Horn, G. Ceder and C. P. Grey, J. Solid State Chem., 2005, 178, 2575–2585 CrossRef.
- X. Y. Tu and K. Y. Shu, J. Solid State Electrochem., 2008, 12, 245–249 CrossRef CAS.
- P. Strobel and B. Lambert-Andron, J. Solid State Chem., 1988, 75, 90–98 CrossRef CAS.
- X. Tan, R. Liu, C. Xie and Q. Shen, J. Power Sources, 2018, 374, 134–141 CrossRef CAS.
- J. Mürter, S. Nowak, E. Hadjixenophontos, Y. Joshi and G. Schmitz, Nano Energy, 2018, 43, 340–350 CrossRef.
- P. J. Phillips, J. Bareño, Y. Li, D. P. Abraham and R. F. Klie, Adv. Energy Mater., 2015, 5, 1–12 Search PubMed.
- M. C. Biesinger, B. P. Payne, A. P. Grosvenor, L. W. M. Lau, A. R. Gerson and R. S. C. Smart, Appl. Surf. Sci., 2011, 257, 2717–2730 CrossRef CAS.
- J. L. Junta and M. F. Hochella, Geochim. Cosmochim. Acta, 1994, 58, 4985–4999 CrossRef CAS.
- M. M. Thackeray, Prog. Solid State Chem., 1997, 25, 1–71 CrossRef CAS.
Footnote |
| † Based on the number of publications containing “thin-film batteries” indexed on Google Scholar as of 2018-03-16. Since 1999 the number of publications added per year has increased every year from 2470 in 1999 to 9540 in 2009 to about 23600 in 2018. |
| This journal is © The Royal Society of Chemistry 2020 |