 Open Access Article
Resistive switching effect and magnetic properties of iron oxide nanoparticles embedded-polyvinyl alcohol film†
Hai Hung Nguyenab,
Hanh Kieu Thi Taabc,
Sungkyun Parkd,
Thang Bach Phanbc and
Ngoc Kim Pham *abc
*abc
aFaculty of Materials Science and Technology, University of Science, Vietnam. E-mail: phamkngoc@hcmus.edu.vn
bVietnam National University, Ho Chi Minh City, Vietnam
cCenter for Innovative Materials and Architectures, Korea
dDepartment of Physics, Pusan National University, Busan, Korea
First published on 31st March 2020
Abstract
In this study, the memory device of iron oxide (IO) nanoparticles (NPs) embedded in polyvinyl alcohol (PVA) demonstrates the bipolar resistive switching characteristics under an external electric field. The phase and magnetic properties of iron oxide nanoparticles change corresponding to its resistive states. At the high resistance state (HRS) of device, iron oxide nanoparticles are primarily in Fe2O3 phase and the ferromagnetism behavior is observed. In contrast, the iron oxide nanoparticles clustered by the bridging oxygen vacancies lead to mainly Fe3O4 phase and no hysteresis magnetic curve is observed at the low resistance state (LRS) of device. The results reveal that oxygen vacancies/ions in nanoparticles notably influence the resistance and magnetic behavior of nanocomposite thin films. Our study indicated that the magnetic NPs is high potential of multi-dimensional storage fields.
1. Introduction
Resistance random access memory (RRAM) has attracted much attention because of ideal memory characteristics such as simple structures, fast programmable, non-volatility, low power consumption, high-density integration, and low fabrication cost.1,2 A RRAM has the capacitor – like structure in which the insulator layer is sandwiched between two metal electrodes. One principle operation is based on repeatedly switching between a high resistance state (HRS) and low resistance state (LRS) by applying an external electric field. A numerous materials including metal oxides, perovskites, organic and hybrid nanocomposites were studied for RRAM devices.3–5Polyvinyl alcohol (PVA) is a nontoxic, friendly environmental, thermalstable polymer, good water solubility, biodegradability and semi-crystalline.6 Amazing optical/mechanical properties, good dielectric capacity and attractive charge storage ability make PVA effectively in multiple applications.7 PVA with their crystalline structure consist of H-atoms interlinked between the hydroxyl group and these hydrogen atoms could be interlinked. The physical, chemical and optoelectrical properties of PVA can be modified by doping with nanofillers as well as governed by the number of hydroxyl groups present in the PVA matrix. Interfacial interactions between the filler and the matrix improve dielectric, optical and electrical properties of composites.8 Metal NPs (Cu, Ag, Co…), oxides (CuO, ZnO…), graphene are incorporated into PVA polymer forming nanocomposites for nanophotonic, biomedical and optoelectronic devices.7 Some recent papers reported the resistive switching (RS) effect of PVA based nanocomposite with high potential for memory devices. Kim et al. investigated the multi-stacked PVA/GO + PVA/PVA layer based RRAM devices which were distributed the high ON/OFF ratio (∼104) and good retention (>2 × 10³ s).9 Hmar reported the devices using hybrid composite of ZnO nanoparticles embedded in PVA and PEDOT:PSS with low operating voltage and switching current ratio larger than five orders of magnitude.10 The flexible devices remain good performance even after bending the device from 60–120°. M. Rehman et al. fabricated the RRAM configuration of PET/Ag/MoS2-PVA/Ag by printing with mechanical robustness via various bending diameters (50–2 mm) for 1500 cycles.11 The nanocomposite of PVA and TiO2 nanotubes distributed the high resistive switching performance with high ON/OFF ratio (∼103) and long life retention (∼104 s).12
Besides, some studies reported that magnetic oxide materials show the high potential with RS characteristics. A. Odagawa et al. demonstrated that the RS behavior in Fe3O4 thin film is controlled by the formation of maghemite γ-Fe2O3 phase from Fe3O4 near the interface of an anode.13 Kim et al. observed RS in magnetite (Fe3O4) NP assembly that was driven by the responsive migration of Fe2+ and Fe3+ charges to the external field.14 Additionally, another report described the colloidal maghemite phase of iron oxide (γ-Fe2O3) NPs on a Pt electrode, with the memory controlled by the bias polarity. The transparent and flexible RS of Al/Fe3O4-PMMA/Al devices can be attributed to the trapping/de-trapping of electrons at the sites of Fe3O4 nanoparticles.15 Wei Chen et al. reported the high potential of multi-dimensional memory devices with simultaneous changes in resistance and magnetization of Fe3O4 thin films in an Ag/Ti/Fe3O4/Pt device.16
Most of studies of RRAM based on magnetic materials above revealed carefully of the performance and the RS mechanism of memory devices. Unfortunately, the correlation between switching mechanism and magnetic properties was rarely figured out. In this research, we report the bipolar resistive switching characteristics of the iron oxide (IO) nanoparticles (NPs) embedded in polyvinyl alcohol (PVA) and also comprehend a correlation between the RS and magnetic properties of nanoparticles. It is found that the data storage process closely relates to the majority phase ratio of the iron oxides in nanocomposite.
2. Experimental procedures
2.1 Synthesis of iron metal oxide nanoparticles
In this report, the ferromagnetic nanoparticles were synthesized by co-precipitation method. 1 gram iron(II) chloride tetrahydrate and 2.7 gram iron(III) chloride hexahydrate was dissolved in 40 mL distilled water. Then, the mixture was ultrasonicated for 15 minutes at 70 °C in nitrogen atmosphere for homogeneity and 40 mL NaOH (1 M) was slowly dripped into the mixture. After dripping NaOH, the reaction mixture continues to be ultrasonicated 70 °C in nitrogen atmosphere for an hour to form ferromagnetic nanoparticles. After that, 3.6 mL oleic acid was added into the ferromagnetic nanoparticle solution. The solution was continuously ultrasonicated an hour at 70 °C in nitrogen atmosphere to form a coating around ferromagnetic nanoparticles to help them disperse better. The ferromagnetic nanoparticles were separated by a magnetic bar, washed four times with a mixture of hexane and ethanol, three times with distilled water. Then, the produce was dried at 80 °C in vacuum for 8 hours.2.2 Fabrication of memory devices
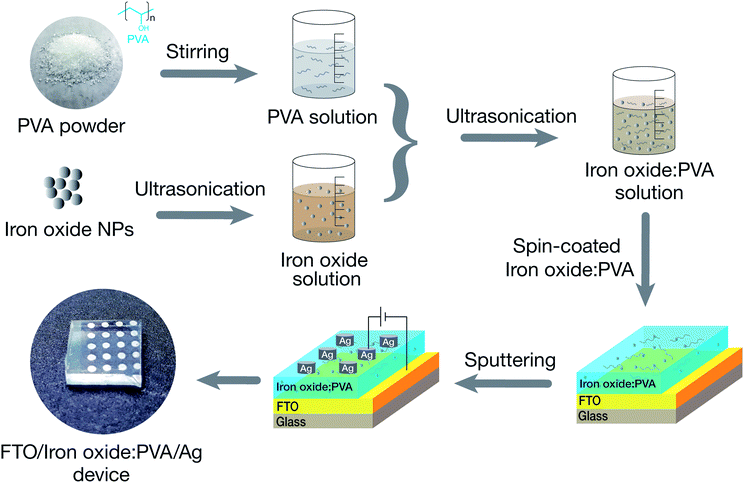
To fabricate the devices, the IO NPs were dissolved in a mixture of ethanol and deionized water and ultrasonicated simultaneously for 30 min at room temperature. The NPs solution (0.01 wt%) was mixed with PVA solution (1.0 wt%) to obtain a homogeneous solution. Then, the 40 nm-thick nanocomposite films were coated on a commercial fluorine-doped tin oxide substrate (FTO) by conventional spin coating. Finally, the top Ag electrode, which had an approximately thickness of 100 nm, was deposited onto the insulator layer by using a DC sputtering system. The details of device fabrication process are shown in Fig. 1.2.3 Analysis techniques
The crystalline structure of the IO NPs was characterized by using a Bruker D8 Advance X-ray diffractometer (XRD) with Cu-Kα radiation (λ = 0.154 nm). Fourier transform infrared spectroscopy (FTIR) was conducted on the NPs by using a 4800S spectrometer (Shimadzu Corporation) in the mid-infrared range from 500 to 4000 cm−1. An X-ray photoelectron spectroscopy (XPS) system [K-alpha, Thermo Fisher Scientific (UK)] with monochromated source Al Kα (hν = 1486.6 eV) and a spot size of 400 μm was used for the chemical state analysis. The survey scan was at 200 eV pass energy with a step of 1 eV, while the narrow scan was at 50 eV pass energy with a step of 0.1 eV. The size and morphology of the magnetic NPs were studied by using a JEOL JEM-2100F transmission electron microscope (TEM) and an S4800 Hitachi scanning electron microscope (SEM). The magnetic properties of magnetic NPs and thin films were investigated by using a vibrating sample magnetometer (VSM, MicroSense EasyVSM). A semiconductor characterization system (Keithley 4200 SCS) was employed to measure the I–V characteristics. When a DC voltage was applied to the FTO electrode, the Ag electrode was grounded. The current and voltage were measured under ambient conditions and at room temperature.3. Results and discussion
3.1 Structural and morphology of iron oxide NPs
The XRD pattern of the ferromagnetic NPs is shown in Fig. 2(a). In the range, 2θ = 20/80, representative diffraction peaks at 2θ = 30.3°, 35.7°, 56.7°, and 62.8°, which correspond to the (220), (311), (511), and (440) planes (JCPDS card no. 79-0417), respectively can be identified.17 The phase of iron metal oxide NPs may belong to Fe3O4 phase and/or γ-Fe2O3 phase. The average crystallite size of magnetite NPs can be calculated by the width of the reflection peak according to the Debye–Scherrer equation: D = 0.9λ/(β![[thin space (1/6-em)]](https://www.rsc.org/images/entities/char_2009.gif) cos
cos![[thin space (1/6-em)]](https://www.rsc.org/images/entities/char_2009.gif) θ), where λ, β, and θ are the wavelength of the X-ray radiation, the full width at half maximum (FWHM) of the peak, and the angle of diffraction, respectively. The average crystallite size of iron metal oxide NPs that is estimated from the most intense peak of (311) plane is ∼12 nm.
θ), where λ, β, and θ are the wavelength of the X-ray radiation, the full width at half maximum (FWHM) of the peak, and the angle of diffraction, respectively. The average crystallite size of iron metal oxide NPs that is estimated from the most intense peak of (311) plane is ∼12 nm.
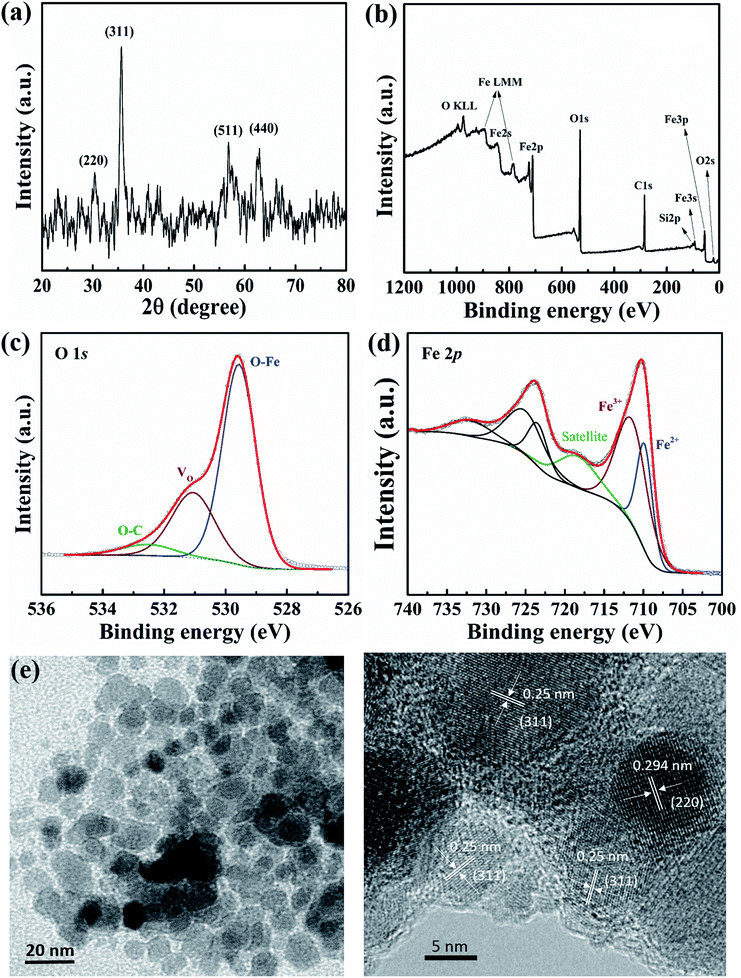 | ||
| Fig. 2 Structure and morphology of the IO NPs: XRD (a), survey XPS spectra (b), and O 1s (c) and Fe 2p (d) core-level X-ray photoelectron spectra, TEM (e) and HRTEM (f) images. | ||
Fig. 2(b) shows the XPS survey spectra of iron oxide NPs in the binding energy range from 0 to 1200 eV. The results confirm that the main elements of Fe and O in NPs. Furthermore, the O/Fe ratio from quantification is ∼2.8, which demonstrates that O bonds with Fe in ferric stoichiometry and there exists other oxidation states. The O 1s core-level X-ray photoelectron spectra can be deconvoluted into three peaks at 529.6, 531.1, and 532.5 eV, as in Fig. 2(c). The highest intensity peak at 529.6 eV (i.e., lowest binding energy peak) is attributed to oxygen from O–Fe bonds, with a prominent 66.2% ratio.18 The other lower intensity peak is at 531.1 eV, corresponding to oxygen vacancies (VO) with a relatively high ratio in the NPs (26%).18 The number of oxygen vacancies can influence the electrical properties of NP-based devices. A small ratio of oxygen (5.8%) can be distributed in O–C bonds through surface contamination.18 The convolution of Fe 2p is presented in Fig. 2(d). Two main peaks are related to the Fe2+ and Fe3+ oxidation states at 709.8 and 711.5 eV, corresponding to Fe3O4 and γ-Fe2O3 stoichiometry, respectively.19 In addition, the presence of a satellite peak at 718.4 eV also indicate that the magnetic NPs are not completely a Fe3O4 phase;19 a complete Fe3O4 stoichiometry produces no satellite peak. From the structural analysis, the magnetic NPs have the combination of Fe3O4 and γ-Fe2O3 phase. The integrated intensity ratio of Fe3+/Fe2+ may examined relatively ratio between γ-Fe2O3 and Fe3O4 phase, in which γ-Fe2O3 is the majority. The elemental composition of NPs is also revealed by using EDX analysis for comparison as presented in Fig. S1(a) and (b) ESI.† The O/Fe ratio is approximately 1.7 which indicates that the iron oxide NPs are not including single phase of Fe3O4 or Fe2O3. Furthermore, the FT-IR spectrum of iron oxide nanoparticles was also deconvoluted into three peaks in the range of 400–800 cm−1 (see Fig. S1(c)†). The absorption peak at 564 and 620, 703 cm−1 were attributed to the Fe3O4 and γ-Fe2O3 phase,19 in which, the γ-Fe2O3 phase was also a dominant component.
Fig. 2(e) and (f) show TEM and HRTEM images of NPs which are mostly spherical/spheroidal in shape and the diameter is estimated to be 10–15 nm, matching the calculated size from XRD data. The clear atomic lattice fringes can be observed in Fig. 2(f), and an interplanar spacing of the crystallographic planes is about 0.25 nm, which is close to the (311) lattice planes of crystal. The other crystalline direction may be referred to (220) plane. The corresponding surface morphology of the FTO substrate and nanocomposite thin film were investigated, as shown in Fig. S2(a) and (b) ESI,† respectively.
3.2 Current–voltage characteristics
Fig. 3(a) shows the typical I–V curve of the device in a bipolar RS characteristics. When a positive voltage sweep (0–3 V) applied to a bottom electrode, the low current from the initial state increased rapidly at VS ∼ 2 V and reached the current compliance, IC = 10−3 A. As a result, the device switched from an HRS to an LRS. The LRS remained during backward voltage from 3 V to 0 V. When the voltage was swept to −3 V and backward to zero in the negative direction, the current decreased at VRS ∼ −0.7 V and the device changed back to an HRS. This I–V characteristic was followed by bipolar bi-stable RS behavior. An endurance test of 100 cycles and the cumulative probability of HRS and LRS are shown detail in Fig. 3(b) and (c), respectively. The resistance of LRS (0.8 × 10⁻² A) is more stable than that of HRS (0.7 × 10⁻³/10−3 A). The operating voltages range from 0.5 to 2 V for set process and from −1.7 to −0.7 V for reset process, as seen in Fig. 3(d).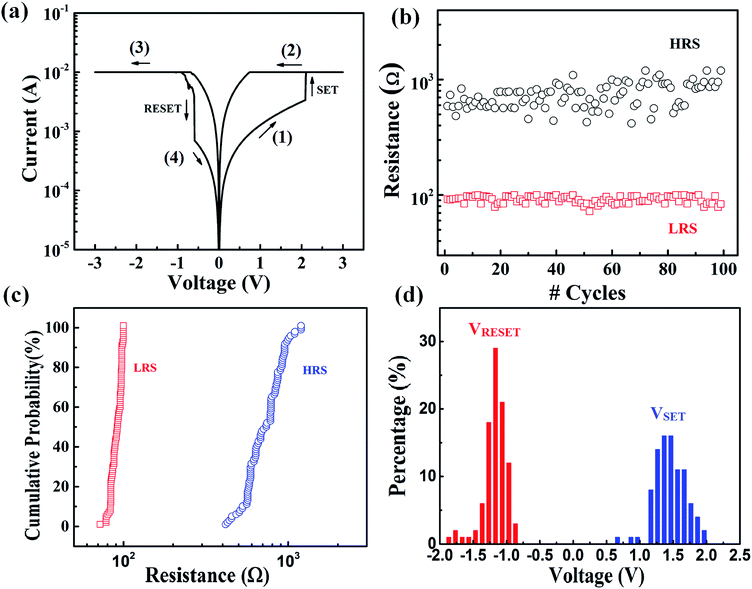 | ||
| Fig. 3 The bipolar resistive switching of memory devices: (a) current–voltage (I–V) characteristics, (b) endurance, (c) cumulative probability of LRS and HRS and (d) percentage of operation voltage. | ||
3.3 Photoluminescence spectrum
The PL spectrum were determined to clarify the energy-band structure and defect states in the NPs. Fig. 4(a) shows the PL results with seven major peaks near 425, 555, 641, 708, 740, 777, and 846 nm, when the excitation wavelength is 325 nm. Interband defect states and/or quantum confinements play important roles in NPs. The many peaks in Fig. 3(a) demonstrate the existence of some energy levels of defects in NPs. The corresponding electronic band structures of NPs are shown in Fig. 4(b). The PL peaks at 425 nm (2.92 eV) and 641 nm (1.93 eV) can be attributed to the radiative recombination of trapped electrons from octahedral sites to O 2p. The peak at 555 nm (2.23 eV) refers to the transition of electrons from eg to t2g at an octahedral site. The low peak at 708 (1.75 eV) and high peak at 740 nm (1.67 eV) are related to the recombination of electrons from t2 to O 2p at a tetrahedral site. The two PL peaks at 777 nm (1.59 eV) and 846 nm (1.46 eV) can be attributed to the transition of electrons, which may be trapped at oxygen vacancies, to O 2p at a tetrahedral site.20,21 In the previous report, Boxall et al. also showed that colloidal Fe3O4 nanoparticles exhibit three distinct mobility changes at 1.8, 2.2, and 3.1 eV, which are consistent with the electronic band structures of Fe3O4.22 Based on the small changes in these three peaks and additional peaks in our results, we propose that the electronic band structures of NPs are primarily similar to those of NPs. However, more defect states may be included in the energy-band structure of our NPs.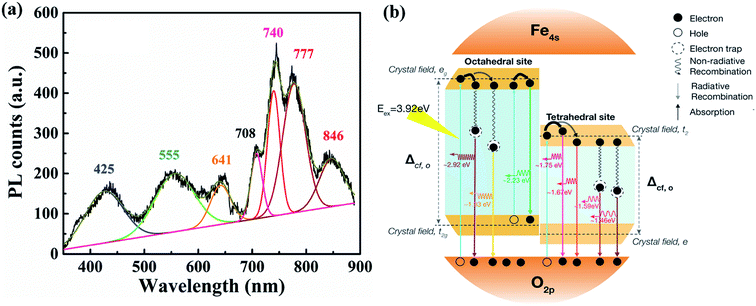 | ||
| Fig. 4 Photoluminescence spectrum of the iron metal oxide NPs (a) and schematic of the energy-band structure of the NP systems (b). | ||
3.4 Magnetic properties
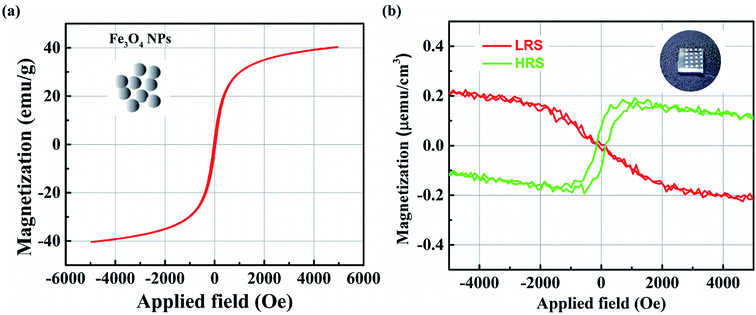
In this study, the magnetic properties of the device have also been investigated. According to the simple ferrimagnetic picture, Fe3O4 exhibits a magnetic moment of +4μB per formula unit solely because of the Feoct2+ cations since, Fetet3+ (−5μB) and Feoct3+ (+5μB) cations cancel each other.23 Otherwise, the ferromagnetism of the oxide thin film may be induced by donor defects, such as oxygen vacancies or metal impurities.24,25 Fig. 5(a) shows the magnetization curve of the NPs. The coercive force was approximately negligible, suggesting superparamagnetic behavior. The curve also shows that the saturation magnetization (Ms) was 40 emu g−1. It is reported that the diameter of the primary particles can influence the Ms value. The smaller the particles' size, the smaller the particle volume that contributes to the effective magnetic volume, and the saturation magnetization decreases because of surface effects.26The magnetic field's (H) dependence on the room-temperature magnetization (M) after diamagnetic correction for the hybrid nanocomposite film corresponding to the LRS and HRS is shown in Fig. 5(b). The magnetic curves at the LRS show no hysteresis, and the direction follows diamagnetic properties, similarly to that of the substrate. A magnetic-hysteresis loop in the nanocomposite film at an HRS can be observed, showing ferromagnetism at room temperature. The Ms value is ∼0.2 μemu cm−3 at the field H of ∼1100 Oe. Ms is particularly low because of the extremely low concentration of NPs in the nanocomposite films. The other reason for the low Ms value is believed to be the existence of a PVA matrix in the magnetic film, which simply limits magnetic effects from the magnetite NPs.
In our device, the observed ferromagnetism behavior at HRS may be explained based on some points as follows: (1) it is well-known that Fe3O4 phase is more conductive due to its stable in the reducing medium compared to the α-, β-, γ-Fe2O3 (noted as Fe2O3) phases; (2) in the oxidation medium, Fe3O4 phase will be Fe2O3 phases; (3) the Fe3O4 and Fe2O3 nanoparticles can be ferromagnetism or superparamagnetism behavior depending on their sizes. It is noted from the Fig. 6(b) that the magnetic behavior of LRS is not observed (the observed diamagnetic behavior is originated from the FTO bottom electrode). It might that the ion oxides nanoparticles are primarily in Fe3O4 phase due to the LRS (point 1 above). Fortunately, the observed magnetic behavior from the HRS is ferromagnetism. The low conductivity (HRS) informs that the iron oxide nanoparticles now seem to be common in Fe2O3 phases (point 1 above). It is well-known that the ferromagnetism behavior is observed in large size iron oxide nanoparticles. Therefore, the transition from the Fe3O4 (LRS) to Fe2O3 (HRS) can occur through the migration of oxygen ions/oxygen vacancies under electric field (point 2 above). The large clusters of Fe2O3 nanoparticles also can be formed through the oxygen ions bridging (point 3 above) leading to observed ferromagnetism behavior.
3.5 Resistive switching mechanism of memory devices
From the discussion of microstructure and magnetic properties of hybrid nanocomposites, the switching mechanism can be proposed as the redistribution of oxygen vacancies/ions under the external electric field leading the change of main stoichiometry in magnetic NPs constituent as in Fig. 6. According to XPS and FTIR discussion in Section 3.1, the γ-Fe2O3 is the majority of iron metal oxides at pristine state. Under positive bias (the FTO is positive), the oxygen ions in the hybrid layer near the FTO are pulled out to the FTO electrode (as the oxygen reservoir layer). This process makes the deficiency of oxygen in the magnetic NPs, or removes the oxygen bridges in γ-Fe2O3 phase to form disconnecting Fe3O4 clusters. The resistance of device switchs from HRS to LRS. Numerous attempts have been conducted to understand and model the conduction mechanisms in Fe3O4 material, including the hopping of electrons on the Feoct sublattice (ionic model), band conduction, and/or small-polaron hopping (metallic conduction). In our iron oxide NPs, the interband defect states of the energy band in the octahedral and tetrahedral sites, as shown in Fig. 4(b), may have assisted the hopping of electrons through the nanocomposite layer. In the another explanation, the electrons can hop through the oxygen vacancy sites – binding bridges of Fe2O3 clusters. Whenever the voltage is reversed to the negative direction (FTO with negative voltage), the oxygen ions are pushed into the interface region of the FTO/insulator. The oxygen vacancies could be annihilated and rupture the electron hopping paths. The device switchs back to the HRS, corresponding to the alternation of main phase from Fe3O4 into Fe2O3 phase.4. Conclusions
In summary, the bipolar RS is observed in iron oxide NPs embedded into PVA matrix under the external electric field. Simultaneously, the magnetic properties of the nanocomposites alter from the superparamagnetism at LRS to ferromagnetism at HRS corresponding to the majority phase from γ-Fe2O3 and Fe3O4 phases The switching mechanisms are elucidated through the pushing in/pulling out of oxygen ions at the FTO/nancomposite interface under the external electric fields. Recently, the development of such memory device with the data storage applications both in electric and magnetic properties, which has begun to attract considerable attention. Therefore, our memory can be expected to provide more opportunities in multi-dimension memories.Conflicts of interest
There are no conflicts of interest to declare.Acknowledgements
This work was supported by the Center for Innovative Materials and Architectures (INOMAR) Vietnam National University, Ho Chi Minh City, Vietnam under grant number: INOMAR-CS2018-01.References
- D. Ielmini, Resistive switching memories based on metal oxides: Mechanisms, reliability and scaling, Semicond. Sci. Technol., 2016, 31, 1–25 CrossRef.
- S. S. M. Mikolajick, Nanoscale resistive switching memory devices: a review, Nanotechnology, 2019, 30, 25 Search PubMed.
- S. Gao, X. Yi, J. Shang, G. Liu and R. W. Li, Organic and hybrid resistive switching materials and devices, Chem. Soc. Rev., 2019, 48, 1531–1565 RSC.
- A. Tsurumaki-Fukuchi, R. Nakagawa, M. Arita and Y. Takahashi, Smooth Interfacial Scavenging for Resistive Switching Oxide via the Formation of Highly Uniform Layers of Amorphous TaOx, ACS Appl. Mater. Interfaces, 2018, 10, 5609–5617 CrossRef CAS PubMed.
- X. Guan, et al., Light-Responsive Ion-Redistribution-Induced Resistive Switching in Hybrid Perovskite Schottky Junctions, Adv. Funct. Mater., 2018, 28, 1–11 Search PubMed.
- V. Viswanath, S. S. Nair, G. Subodh and C. I. Muneera, Zinc oxide encapsulated poly (vinyl alcohol) nanocomposite films as an efficient third-order nonlinear optical material: structure, microstructure, emission and intense low threshold optical limiting properties, Mater. Res. Bull., 2019, 112, 281–291 CrossRef CAS.
- M. Aslam, M. A. Kalyar and Z. A. Raza, Polyvinyl alcohol: a review of research status and use of polyvinyl alcohol based nanocomposites, Polym. Eng. Sci., 2018, 58, 2119–2132 CrossRef CAS.
- S. S. Mousavi, B. Sajad and M. H. Majlesara, Fast response ZnO/PVA nanocomposite-based photodiodes modified by graphene quantum dots, Mater. Des., 2019, 162, 249–255 CrossRef CAS.
- T. Kim, D.-K. Kim, J. Kim and J. J. P. Resistive, Switching Behavior of Multi-Stacked PVA/Graphene Oxide + PVA Composite/PVA Insulating Layer-Based RRAM Devices, Semicond. Sci. Technol., 2019, 34, 065006 CrossRef CAS.
- J. J. L. Hmar, Flexible resistive switching bistable memory devices using ZnO nanoparticles embedded in polyvinyl alcohol (PVA) matrix and poly(3,4-ethylenedioxythiophene) polystyrene sulfonate (PEDOT:PSS), RSC Adv., 2018, 8, 20423–20433 RSC.
- M. M. Rehman, et al., Resistive Switching in All-Printed, Flexible and Hybrid MoS2-PVA Nanocomposite based Memristive Device Fabricated by Reverse Offset, Sci. Rep., 2016, 6, 36195 CrossRef CAS PubMed.
- N. K. Pham, et al., Comprehensive resistive switching behavior of hybrid polyvinyl alcohol and TiO2 nanotube nanocomposites identified by combining experimental and density functional theory studies, J. Mater. Chem. C, 2018, 6, 1971–1979 RSC.
- A. Odagawa, et al., Electroforming and resistance-switching mechanism in a magnetite thin film, Appl. Phys. Lett., 2007, 91, 1–4 CrossRef.
- T. H. Kim, et al., Nanoparticle Assemblies as Memristors, Nano Lett., 2009, 9, 2229–2233 CrossRef CAS.
- Y. Lin, et al., Transferable and flexible resistive switching memory devices based on PMMA films with embedded Fe3O4 nanoparticles, Appl. Phys. Lett., 2017, 110, 193503 CrossRef.
- W. Chen, et al., Electric field induced simultaneous change of resistance and magnetization in an Ag/Ti/Fe3O4/Pt device, J. Mater. Chem. C, 2013, 1, 7879–7882 RSC.
- T. K. H. Ta, et al., Synthesis and surface functionalization of Fe3O4-SiO2 core-shell nanoparticles with 3-glycidoxypropyltrimethoxysilane and 1,1′-carbonyldiimidazole for bio-applications, Colloids Surf., A, 2016, 504, 376–383 CrossRef CAS.
- C. Fu, G. Zhao, H. Zhang and S. Li, A facile route to controllable synthesis of Fe3O4/graphene composites and their application in lithium-ion batteries, Int. J. Electrochem. Sci., 2014, 9, 46–60 Search PubMed.
- M. Stefan, et al., Synthesis and characterization of Fe3O4 @ZnS and Fe3O4 @Au@ZnS core-shell nanoparticles, Appl. Surf. Sci., 2014, 288, 180–192 CrossRef CAS.
- D. Shi, M. E. Sadat, W. Dunn and D. B. Mast, oxide nanoparticles for biomedical applications, Nanoscale, 2015, 14, 16–18 Search PubMed.
- M. E. Sadat, et al., Photoluminescence and photothermal effect of Fe3O4 nanoparticles for medical imaging and therapy, Appl. Phys. Lett., 2014, 105, 091903 CrossRef.
- Z. Zhang, C. Boxall and G. H. Kelsall, Photoelectrophoresis of colloidal iron oxides, Colloids Surf., A, 1996, 92, 791–802 Search PubMed.
- G. S. Parkinson, Iron oxide surfaces, Surf. Sci. Rep., 2016, 71, 272–365 CrossRef CAS.
- X. Zhang, et al., Defects Induced Room Temperature Ferromagnetism in ZnO Thin Films, Adv. Condens. Matter Phys., 2014, 2014, 1–6 Search PubMed.
- K. Rainey, et al., Defect induced ferromagnetism in undoped ZnO nanoparticles, J. Appl. Phys., 2014, 115, 2012–2015 CrossRef.
- A. Taufiq, et al., Small-Angle X-Ray Scattering Study on PVA/Fe3O4 Magnetic Hydrogels, Nano, 2016, 11, 1650027 CrossRef.
Footnote |
| † Electronic supplementary information (ESI) available. See DOI: 10.1039/c9ra10101b |
| This journal is © The Royal Society of Chemistry 2020 |

