DOI:
10.1039/C9RA09809G
(Paper)
RSC Adv., 2020,
10, 8460-8469
Mechanism and activity of the oxygen reduction reaction on WTe2 transition metal dichalcogenide with Te vacancy†
Received
23rd November 2019
, Accepted 16th February 2020
First published on 27th February 2020
Abstract
WTe2 transition metal dichalcogenide is a promising candidate for the cathode of proton-exchange membrane fuel cells. In this paper, we investigated the mechanism and activity of the oxygen reduction reaction on the monolayer of the WTe2 transition metal dichalcogenide with Te vacancy denoted as WTed2. By using density functional theory calculations, we studied the reaction intermediates on the surface of WTed2. The Gibbs free energy was calculated to clarify the thermodynamic properties of the reaction. We discovered that the ORR mechanisms are more favorable outside than inside the vacancy. The ORR activity was found to be comparable to that of the well-known transition metal electro-catalysts.
1. Introduction
In recent years, fuel cell technology has gradually shifted from basic research to practical application.1 Proton exchange membrane fuel cells (PEMFCs) are one of the most promising candidates for renewable and sustainable energy conversion devices.2 PEMFCs play a vital role in future energy systems for different purposes such as transportation, residential power generation, and portable computers.3,4 However, the efficiency of PEMFCs is significantly influenced by slow kinetics of oxygen reduction reaction (ORR) at the cathode due to the difficulty to break the double bond of the oxygen molecules.5,6 Researchers have studied various catalytic materials for the ORR to solve this problem.7–9 Pt-based10–16 and Pd-based alloys17–20 have been extensively studied to replace the expensive Pt electro-catalyst. In many cases, ones found that the alloys improved not only the efficiency but also the durability of the cathode of the fuel cells.
Transition metal dichalcogenides (TMDs) have attracted our attention because they have been found in various applications,21–26 in which TMDs are the promising catalysts for the oxygen reduction reaction.26 The literature showed that the edge defects can enhance the rate of the ORR and enable the four-electron transfer mechanism on the defective MoS2 in the acidic medium.27 The Mo atoms at the edge of the MoS2 nanosheets became the reactive sites for the adsorption of the O atoms, which improved the performance of the MoS2 electrocatalyst toward the ORR.28 The doping of MoS2 by heteroatoms such as P, N, and O29–31 was found to improve the adsorption strength of oxygen molecules and enhanced the ORR. Also, the Cu-doped MoS2 exhibits moderate binding energy with the ORR intermediates and offers a better ORR activity than the other-metal doping.32 The Vulcan XC-72R modified WS2 nanocomposite (WS2/C) was expected to be a promising ORR catalyst for fuel cells.33 The number of transferring electrons in the ORR is close to the four-electron process and the WS2/C nanocomposite exhibited superior electrochemical stability. The ORR catalytic activity of MoS2/Fe-phthalocyanine hybrid nanostructures was also found to be excellent compared to that of the commercial Pt/C catalyst in pH 13 electrolyte, with a more positive half-wave potential (0.89 vs. 0.84 V), a smaller Tafel slope (35 vs. 87 mV dec−1), and a much better durability (9.3% vs. 40% degradation after 20 h).34 Furthermore, the heterostructures of (MoS2, MoSe2, WSe2)/graphene and carbon nanosheet were demonstrated to facilitate the ORR with the more positive onset potentials and higher kinetic current densities.35–37 Recently, Liu et al. reported the influence of oxidation on the structure and electronic properties of monolayer TMD.38 They showed that the perfect monolayer TMDs are almost inert to O2 molecules while the defective monolayer TMDs can adsorb O2 with the adsorption energy of about−1.8 to −3.9 eV. Interestingly, after the adsorption, the dissociation of O2 on the monolayer WTed2 does not require activation energy. Based on these properties, we expect that the monolayer WTed2 can be a suitable catalytic material for the ORR.
In this work, we reported on the mechanism and activity of the ORR on the Te defective WTe2 structure, which has never studied previously, by using the density functional theory calculations in combination with a thermodynamic model. We explored the possible ORR intermediates in different surface regions of WTed2. The ORR mechanisms were proposed and then the Gibbs free energy diagrams were built. The results pointed out that the best performance of the ORR was obtained on the perfect region and the boundary with the defect region on the surface of WTed2.
2. The computational methods
The calculations were carried out with the Vienna ab initio simulation package in the framework of density functional theory (DFT).39 We used the plane-wave basis set with the kinetic energy cut-off of 600 eV. The general gradient approximation of Perdew–Burke–Ernzerhof was used for exchange-correlation functional.40,41 The core-valence interaction was simulated by the projector augmented wave method.42–44 The Brillouin zone integration was done with the sampling technique of Monkhorst and Pack,45 in which the k-point mesh of 3 × 3 × 1 was selected. In this work, we used the dipole corrections for periodic supercells. To support the convergence of the calculations, we used the Methfessel-Paxton smearing of order 1 with the sigma value of 0.1 for the atomic position optimization and the linear tetrahedron method with Blöchl corrections for the total energy. The unit cell of WTed2 (see Fig. 1a) was constructed by removing one Te atom from the surface of the perfect WTe2 unit cell. The unit cell has a hexagonal structure with the dimensions: a = b = 17.61 Å, c = 16.00 Å, the lattice parameter of 3.52 Å, and the vacuum space of about 13 Å. The unit cell size is large enough so that the creation of the vacancy of 1/25 ML from the perfect structure does not cause strain effect on the WTed2. The atomic positions of WTed2 were fully relaxed during performing geometric optimization. We ignored the solvent effects in this study. Also, the reaction intermediates were investigated at a specific coverage. The effects of surface coverages will be considered in future studies.
 |
| | Fig. 1 The unit cell of the defective monolayer WTe2. The blue and orange spheres represent the W and Te atoms, respectively. The black-solid point marks the position of the Te vacancy. | |
The interactions between the ORR intermediates and WTed2 were quantified through the adsorption energy,
| | |
Eads = Etotal − (Esub + Eint),
| (1) |
where
Etotal,
Esub, and
Eint are the total energy of the following systems: WTe
d2 + ORR intermediate, the isolated WTe
d2, and the isolated ORR intermediate, respectively.
We used the nudged elastic band (NEB) and climbing image NEB (CI-NEB) methods46–48 to investigate the minimum energy pathway (MEP) of the O2 dissociation process on the surface of the defective monolayer WTe2.
The Gibbs free energy was calculated to understand the thermodynamic properties of the ORR intermediate steps,49
| | |
ΔG = ΔE + ΔZPE − TΔS,
| (2) |
where Δ
E, ΔZPE, and Δ
S are the intermediate reaction energy, the vibrational energy difference, and the entropy change for gas-phase molecules, respectively. Δ
E and ΔZPE were estimated from the results of the DFT calculations, and Δ
S was taken from
ref. 49. In the present work, we considered the free energy at the equilibrium potential of 1.23 V, the standard atmospheric pressure of 1 bar, the room temperature of 300 K, and the pH is zero. The Gibbs free energy at pH = 0 with electrode potential corrections is:
3. Results and discussion
We searched for the ORR intermediates by (i) loading the molecular and atomic oxygen on the defective WTe2 monolayer, (ii) then successively loading the hydrogen atoms over the molecular and atomic oxygen and the previously formed intermediates, and (iii) finally optimizing the obtained structures in steps (i) and then (ii). The stable ORR intermediates are those with negative adsorption energy, which was calculated by using eqn (1).
Atomic oxygen adsorption (O*)
The asterisk denotes the adsorption state of the atomic oxygen on the surface of the substrate. The adsorption was investigated on three regions of the WTed2 substrate, see Fig. 1b, which are:
• Above the defect (region I);
• Inside the defect (region II); and
• Outside the defect or on the perfect region (region III).
We found three favorable adsorption sites of the atomic oxygen as presented in Fig. 2. The atomic oxygen adsorbs in the boundary of regions II and III denoted as the boundary II–III (Fig. 2a), region II (Fig. 2b), and region III (Fig. 2c). Interestingly, the adsorption energy of −0.59 eV and the distance between the O atom and the nearest Te atom is 1.85 Å in the boundary II–III are the same as those in region III. In region II, the atomic oxygen adsorbs strongly with the adsorption energy of −4.93 eV. The position of the O atom is at the center of the defect (see Fig. 2b), where the distance from the O atom to the nearest Te and W atoms is 3.51 Å and 2.08 Å, respectively.
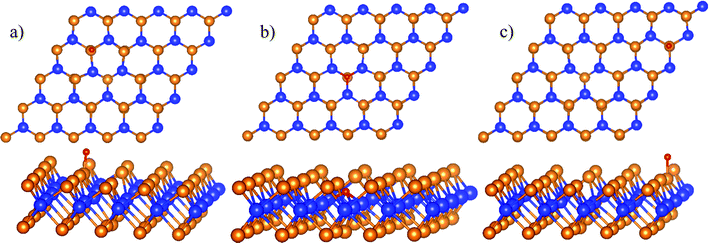 |
| | Fig. 2 The most stable structures of the atomic oxygen in each surface region of WTed2: boundary II–III (a), region II (b), and region III (c). The spheres are W (blue), Te (orange), and O (red). The upper and lower panels are the top and side views, respectively. | |
HO* adsorption
The total energy of the isolated HO is −7.761 eV, which was used for the calculation of HO* adsorption energy. The favorable adsorption configurations are shown in Fig. 3.
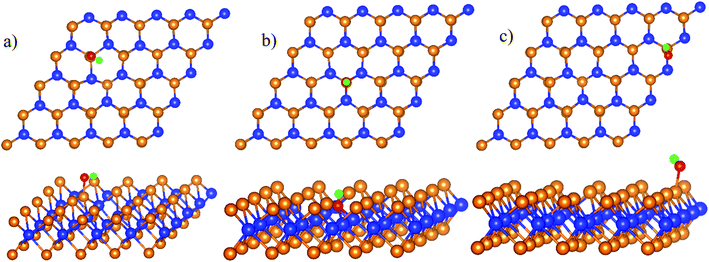 |
| | Fig. 3 The most stable structures of HO* in each region of WTed2: boundary II–III (a), region II (b), and region III (c). The spheres are W (blue), Te (orange), O (red), and H (green). The upper and lower panels are the top and side views, respectively. | |
Table 1 shows that the adsorption strength of HO* follows the order: region II > boundary II–III > region III. The distance from the O* atom to the nearest Te and W atoms is 2.0 and 4.0 Å for the boundary and region III; and is 3.4 Å and 2 Å for region II, respectively.
Table 1 The adsorption energy (eV) of O* and HO* on the WTed2 substrate
| Intermediate |
Boundary II–III |
Region II |
Region III |
| O* |
0.59 |
−4.93 |
−0.59 |
| HO* |
−1.82 |
−4.24 |
−1.68 |
Molecular oxygen adsorption 
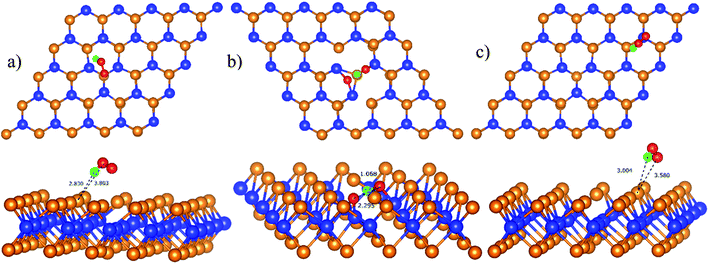
Initially, the oxygen molecule was arranged in different configurations, i.e., the bond of two oxygen atoms is perpendicular to, parallel to, and tilted with the surface of WTed2. After performing the structure optimization of the initial configurations in each surface region of the unit cell, we calculated the adsorption energy of  which is listed in Table 2. For the isolated oxygen molecule, the total energy was obtained to be −9.871 eV and the bond distance of two oxygen atoms is 1.23 Å. The favorable adsorption configurations are D1, D2, and P1 as presented in Fig. 4; and the less favorable configurations are D3, D4, P2, and P3 as shown in Fig. S1 in ESI.† Where, the name of each configuration enclosed with the letters D and P for the defect and perfect regions, respectively.
Table 2 The adsorption energy of  on the WTed2 substrate and the distances between two oxygen atoms (dO–O), from the nearest oxygen atom to the nearest tellurium atom (dO–Te), and the nearest oxygen atom to the nearest tungsten atom (dO–W)
| |
Structure |
Adsorption energy (eV) |
dO–O (Å) |
dO–Te (Å) |
dO–W (Å) |
| Region I |
D1 |
−0.63 |
1.24 |
3.40 |
4.72 |
| D3 |
−0.25 |
1.24 |
4.25 |
4.93 |
| Region II |
D2 |
−3.25 |
1.52 |
2.90 |
2.04 |
| D4 |
−2.62 |
1.46 |
3.46 |
2.16 |
| Region III |
P1 |
−0.60 |
1.24 |
3.35 |
3.54 |
| P2 |
−0.58 |
1.26 |
3.60 |
5.21 |
| P3 |
−0.56 |
1.24 |
3.23 |
4.62 |
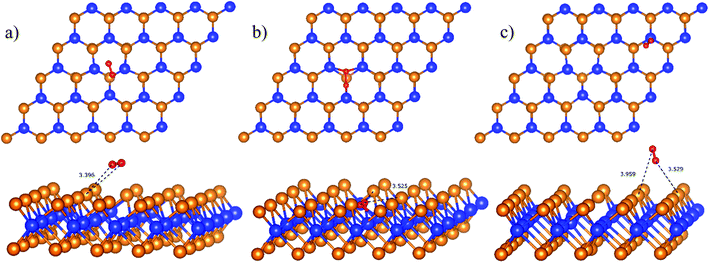 |
| | Fig. 4 The most favorable adsorption sites of the molecular oxygen on WTed2: D1 in region I (a), D2 in region II (b), and P1 in region III (c). The spheres are W (blue), Te (orange), and O (red). The upper and lower panels are the top and side views, respectively. | |
Because of the more negative adsorption energy, the most favorable adsorption of  for the regions I, II, and III were found to be D1, D2, and P1, respectively. Table 2 also shows that the adsorption energy of
  in the regions I and II is approximately the same, but greatly different compared to that of region II, because
  is in the molecular and atomic state for the former and latter, respectively. We can understand the differences in the states of
  and the structures of D1, D2, and P1 by analyzing their structural parameters, which are listed in Table 2. We find that the bond length between two oxygen atoms is the same for
  in the regions I and III; however, the bond length is significantly longer by 0.28 Å as
  in region II. The configuration with the longer dO–O bond length has the shorter dO–W and dO–Te distances. This result implies that when the oxygen molecule comes closer to the surface, the adsorption becomes stronger and therefore the distance of the two oxygen atoms becomes elongated; and hence, the oxygen atoms gradually moves far from one another. The distance between two oxygen atoms in the region II longer by 0.28 Å compared to that in the region I and III were also found to be in good agreement with the result in the literature.38
MEP and CI-NEB results
The transition from D1 to D2 is possible. We have to use the NEB and CI-NEB techniques to search for the MEP and understand the transition. The configuration D1 and D2 are considered as the initial state (IS) and final state (FS) of the transition process, respectively.
Fig. 5 shows the minimum energy reaction path, where the saddle point (TS) is higher than the IS point by 0.28 eV, which implies that the transition from the initial to the final state requires the activation energy of 0.28 eV. This result is different compared to the case found in ref. 38, where the transition takes place automatically. This difference may be due to the influence of van der Waals interaction, which has been included in the previous work.38 The final state is rather stable due to its lower energy. The energy difference between the saddle point and the FS point is 2.26 eV, which is rather large; and therefore, the transition from D1 and D2 is almost irreversible without providing a reasonable amount of energy.
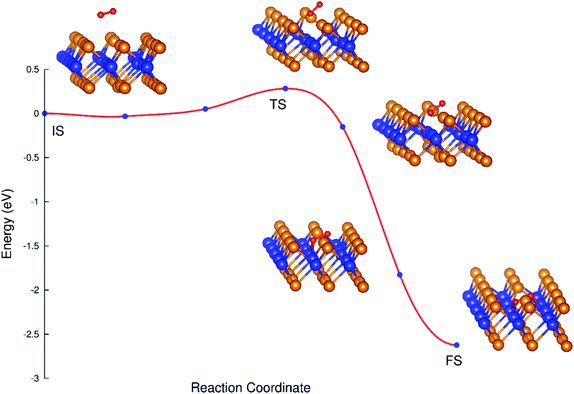 |
| | Fig. 5 The MEP from the initial to final state. | |
Table 3 shows the varying tendency of the bond distances from the IS to FS. The bond length of the oxygen atoms increases, while the distances from the nearest oxygen atom to the tellurium and tungsten atoms decrease.
Table 3 The bond distances between the atoms in the NEB images from the IS to FS
| |
IS |
01 |
02 |
FS |
04 |
05 |
FS |
| d(O–O) (Å) |
1.24 |
1.24 |
1.25 |
1.28 |
1.40 |
1.48 |
1.52 |
| d(O–W) (Å) |
4.72 |
4.26 |
3.59 |
2.76 |
2.25 |
2.15 |
2.04 |
| d(O–Te) (Å) |
3.40 |
3.53 |
3.30 |
2.98 |
2.90 |
2.90 |
2.90 |
The charge density difference of the  system in the initial and final states in Fig. 6 shows that the oxygen atoms are the centers of charge gain. The charge-gain cloud covers both oxygen atoms in the initial state, while it is well separated to each oxygen atom in the final state. This result indicates that the oxygen atoms are in the molecular and atomic states for the initial and final states, respectively. The charge increase of the oxygen atoms as compared to that of the neutral ones is 0.075, 0.44, and 1.703 e− for the IS, TS, and FS, respectively.
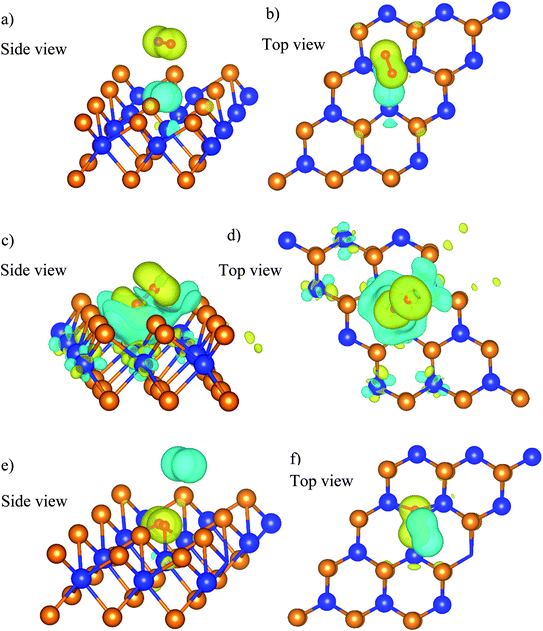 |
| | Fig. 6 The charge density difference of the  system in the initial (a and b), transition (c and d), and final (e and f) states. The yellow and cyan clouds indicate the charge gain and loss, respectively. system in the initial (a and b), transition (c and d), and final (e and f) states. The yellow and cyan clouds indicate the charge gain and loss, respectively. | |
First proton transfer process
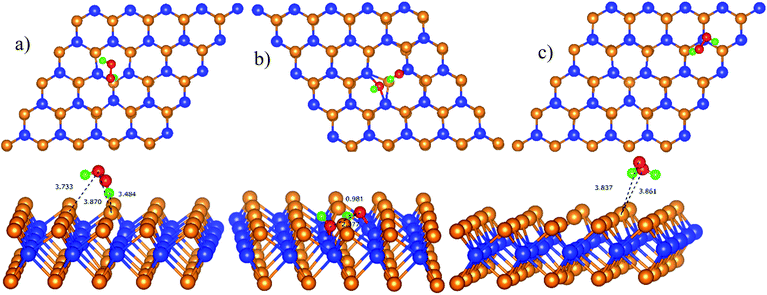
We performed the first proton transfer process by loading a hydrogen atom over the adsorbed oxygen atoms in the configurations D1, D2, and P1. We obtained the optimized structure of HOO* and HO* + O* intermediates on the substrate surface. The structure of HO* + O* was obtained by loading and optimizing a hydrogen atom on the top and around the O* + O* intermediate in the structure D2. The isolated HOO has a total energy of −13.263 eV and the distance between the atoms is dH–O = 0.99 Å and dO–O = 1.35 Å. The isolated HO and O have the total energy of EHO = −7.76 eV and EO = −4.94 eV, respectively. The adsorption energy of HOO* and HO* + O* are listed in Table 4 and the optimization structures D11, D21, and P11 are presented in Fig. 7.
Table 4 The adsorption energy (eV) of HOO*/HO* + O* and HOOH*/HO* + HO* on WTed2
| Intermediate |
Region I |
Region II |
Region III |
| HOO*. HO* + O*. HOOH*. HO* + HO*. |
| HOO*/HO* + O* |
−0.75 (D11)a |
−5.19 (D21)b |
−0.75 (P11)a |
| HOOH*/HO* + HO* |
−0.72 (D112)c |
−5.77 (D212)d |
−0.69 (P112)c |
 |
| | Fig. 7 The most stable configuration of HOO* is D11 (a) and P11 (c); and that of HO* + O* is D21 (b). The spheres are W (blue), Te (orange), O (red), and H (green). The upper and lower panels are the top and side views, respectively. | |
The configuration D21 is different compared to D11 and P11, see Fig. 7. Here, the reaction intermediate in D21 is HO* + O* with dO–O = 2.30 Å. While the intermediate in D11 and P11 is HOO* with the distance dO–O = 1.36 Å. The bond distances of the oxygen atoms are also found to be longer as compared with that of  Besides, the adsorption energy for the D21 configuration is much lower than that of D11 and P11, see Table 4. The second proton transfer process will be carried out by using the D11, D21, and P11 configurations as the initial structures.
Second proton transfer process
Similar to the case of the first proton transfer process, we found the most favorable intermediates based on the calculated adsorption energy (Table 4), where the total energy of the isolated HOOH is −18.15 eV. Fig. 8 shows that the intermediates of the second proton transfer process are HOOH* and HO* + HO*. The bond distance of the oxygen atoms slightly increases by around 0.1 Å compared to that of the corresponding previous intermediates of the first proton transfer process.
 |
| | Fig. 8 The most stable structure of HOOH* is D112 (a) and P112 (c); and that of HO* + HO* is D212 (b). The spheres are W (blue), Te (orange), O (red), and H (green). The upper and lower panels are the top and side views, respectively. | |
Reaction mechanism
There are two possible mechanisms for the oxygen reduction reaction. The dissociative one occurs as follows:| |
 | (4) |
| | |
HO* + H+ + e− → H2O + *.
| (6) |
The associative mechanism proceeds by:
| |
 | (7) |
| |
 | (8) |
| | |
HOO* + (H+ + e−) → HOOH*,
| (10) |
| | |
HO* + O* + (H+ + e−) → H2O + O*,
| (11) |
| | |
HO* + O* + (H+ + e−) → HO* + HO*,
| (12) |
| | |
HOOH* + (H+ + e−) → HO* + H2O,
| (13) |
| | |
HO* + H+ + e− → H2O.
| (15) |
where * represents for the adsorption state of the intermediates on WTe
d2. The
eqn (14) and
(15) are the same as
(5) and
(6).
Gibbs free energy
We can understand the thermodynamics of the ORR mechanism through the study of Gibbs free energy diagrams. We first performed the zero-point energy (ZPE) calculations. Table 5 shows the results of the ZPE of the intermediates for each region of the substrate surface.
Table 5 The zero-point energy (eV) of the ORR intermediates
| Intermediate |
Boundary II–III |
Region II |
Region III |
| O* |
0.058 |
0.086 |
0.061 |
| HO* |
0.333 |
0.364 |
0.312 |
| O2*/2O* |
0.105 (region I) |
0.147 |
0.098 |
| HOO*/HO* + O* |
0.409 (region I) |
0.421 |
0.389 |
| 2HO*/HOOH* |
0.715 (region I) |
0.766 |
0.718 |
The expressions for the Gibbs free energy of each mechanism are presented in the following part.49–52 For the dissociative mechanism:
| | |
ΔG0(U) = GH2O(U) − GO*+H2(U) = ΔG0(0) + eU,
| (16) |
| |
 | (17) |
| |
 | (18) |
For the associative mechanism.
| |
 | (19) |
| |
 | (20) |
| |
 | (21) |
| |
 | (22) |
| | |
ΔG4(U) = G2H2O(U) − GHOOH*+H2(U) = ΔG4(0) + eU
| (23) |
| | |
ΔG5(U) = G2H2O(U) − GHO*+HO*+H2(U) = ΔG5(0) + eU,
| (24) |
| | |
ΔG6(U) = G2H2O(U) − GO*+H2O+H2(U) = ΔG6(0) + eU.
| (25) |
The results of Gibbs free energy are listed in Table 6 and 7; and the Gibbs free energy diagrams for the dissociative and associative mechanisms are presented in Fig. 9, 10 and 11, respectively.
Table 6 Gibbs free energy for the intermediate reaction steps in the dissociative mechanism
| Active sites |
Gibbs free energy (eV) at U = 1.23 V |
| ΔG0(U) |
ΔG1(U) |
ΔG2(U) |
| Boundary II–III |
0.494 |
0.883 |
−0.389 |
| Region II |
4.806 |
2.811 |
1.995 |
| Region III |
0.492 |
0.998 |
−0.506 |
Table 7 Gibbs free energy for the intermediate reaction steps in the associative mechanism
| Active sites |
Gibbs free energy (eV) at U = 1.23 V |
| ΔG0(U) |
ΔG1(U) |
ΔG2(U) |
ΔG3(U) |
ΔG4(U) |
ΔG5(U) |
ΔG6(U) |
| Region I |
0.442 |
−1.451 |
−1.009 |
— |
−1.124 |
— |
|
| Region II |
3.023 |
— |
— |
2.850 |
|
1.255 |
2.019 |
| Region III |
0.424 |
−1.411 |
−0.987 |
— |
−0.830 |
— |
|
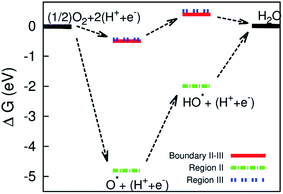 |
| | Fig. 9 Gibbs free energy diagram for the dissociative mechanism on the surface of the defective WTe2. | |
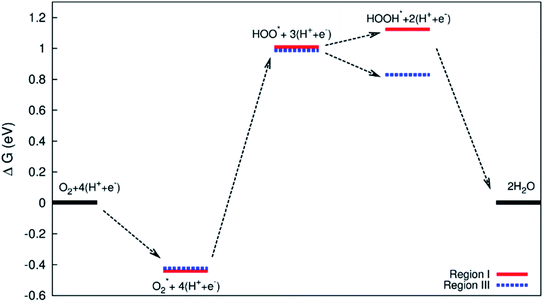 |
| | Fig. 10 Gibbs free energy diagram for the associative mechanism in regions I and III. | |
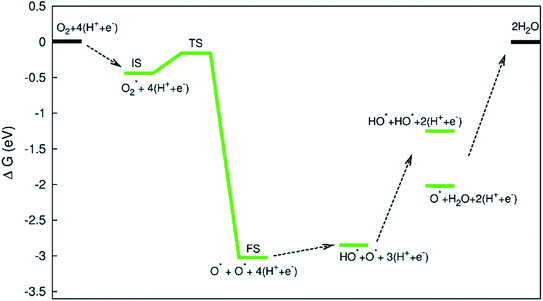 |
| | Fig. 11 Gibbs free energy diagram for the associative mechanism in region II. | |
Three intermediate steps involved in the dissociative mechanism for the conversion from  to H2O, which includes the adsorption of atomic oxygen and two hydrogenation steps. Fig. 9 shows that after O* absorbed on the substrate, the first and second hydrogenation steps occur to convert O* to HO*, and HO* to H2O, respectively. Noticeably, the adsorption of O* is downhill, and hence O* easily form on the surface of the substrate; however, the first hydrogenation step has to overcome an energy barrier of 2.81 eV for region II and about 0.95 eV for the boundary II–III and region III. Furthermore, for region II, the energy level of the HO* formation step is below that of H2O, which causes the reverse reaction of forming HO* from H2O automatically. Whilst, there are no reverse reactions in the boundary II–III and region III. The reverse reaction makes the ORR more difficult to maintain the byproduct H2O and hence lower the efficiency of the fuel cells. We found that the formation of H2O requires significantly smaller activation energy, i.e., 0.95 eV in the boundary II–III and region III compared to 4.81 eV in region II. The characteristics of the Gibbs free energy diagram for the dissociative mechanism on the defective WTe2 were found to be similar to that on the transition alloys.50
Fig. 10 and 11 show the Gibbs free energy diagrams for the associative mechanism. For regions I and III, the adsorption of  occurs automatically. However, the formation of HOO* and HOOH* requires the activation energy of 1.41 and 1.52 eV counted from the energy level of
  respectively. The rate-limiting step is the first hydrogenation process for region III and the second hydrogenation process forming HOOH* for region I. We find that the ORR proceeds to form H2O more easily on region III than on region I. The reverse ORR does not automatically happen on these surface regions of the substrate.
The diagram in Fig. 11 is different compared to that in Fig. 10. This diagram was constructed from the combination between the NEB result and Gibbs free energy. The energy for the IS, TS, and FS structures of the  dissociation process was calculated with the inclusion of the electrode potential, ZPE, and entropy. The O2 molecule adsorbs in region I to form
  then overcome the energy barrier of 0.28 eV to create 2O* + 4 (H+ + e−). The first hydrogenation step converts this intermediate to HO* + O* + 3(H+ + e−). The second hydrogenation step transforms HO* + O* + 3 (H+ + e−) into HO* + HO* + 2 (H+ + e−) and O* + H2O + 2 (H+ + e−). The hydrogenation steps are uphill; therefore, absorb energy to proceed with the reaction. The energy consumption is about 3 eV to completely transform the intermediates into the final product of 2H2O. Noticeably, the reverse reaction perhaps occurs in this case. Therefore, one can not maintain the final product without continuously supplying the energy for the reaction. We can see that the Gibbs free energy in eqn (2) includes the reaction energy ΔE, ΔE = E(after reaction) − E(before reaction). The NEB energy barrier ΔENEB is similar to ΔE, ΔENEB = E(saddle point) − E(before reaction). Therefore, we can apply the same expressions for the Gibbs free energy to the saddle point by substituting ΔENEB for ΔE. Whilst the other parameters in eqn (2) can be calculated in the same manner as those for the intermediate reactions. Therefore, the combination of Gibbs and NEB calculations can display a more complete picture of the reaction including also the transition point.
From the above results, we realize that the Te defective monolayer WTe2 can provide excellent active sites for the oxygen reduction reaction except for the region inside the defect. The obtained results showed that the energy barrier for two ORR mechanisms is the same order as that found for the well-known transition metal alloys.50–52 Therefore, the reaction rate of the ORR on WTed2 is comparable to that on the transition metal alloys, which can be estimated by the Arrhenius formula ∼exp(−Ae/kT), where Ae is the activation energy barrier of the reaction. There is no experimental data available for the ORR on the defective WTe2. However, by the computational study, we showed that the WTe2 with the vacancy is a promising electro-catalyst. Therefore, we expect that the obtained results should be confirmed by experiments.
4. Conclusion
In this study, we used density functional theory calculations to search for the intermediates of oxygen reduction reaction and explore their adsorption sites on the Te vacancy WTe2 substrate. We found that the atomic and molecular oxygen-containing intermediates occur inside and outside the Te vacancy region, respectively. Particularly, the oxygen molecule can make the transition to two oxygen atoms by overcoming an energy barrier of 0.28 eV when changing the adsorption site from above to inside the defect. Besides, the dissociative and associative mechanisms have also been examined. The mechanisms were found to proceed in a controllable manner with a moderate energy barrier of about 0.95 and 1.52 eV at the boundary and exterior of the Te defect region, respectively. However, at the interior of the vacancy, the reverse process perhaps happens and hence hinders the oxygen reduction reaction, which is due to the strong adsorption of the atomic oxygen-containing intermediates. From the obtained results, we found that the Te defect WTe2 provides not only reactive sites but also excellent performance for the oxygen reduction reaction.
Conflicts of interest
There are no conflicts of interest to declare.
Acknowledgements
This research is funded by Ho Chi Minh City University of Technology (HCMUT), VNU-HCM, under grant number BK-SDH-2020-1770248.
References
- A. Brouzgou, A. Podias and P. Tsiakaras, J. Appl. Electrochem., 2013, 43, 119–136 CrossRef CAS.
- E. H. Majlan, D. Rohendi, W. R. W. Daud, T. Husaini and M. A. Haque, Renewable Sustainable Energy Rev., 2018, 89, 117–134 CrossRef CAS.
- S. J. Peighambardoust, S. Rowshanzamir and M. Amjadi, Int. J. Hydrogen Energy, 2010, 35, 9349–9384 CrossRef CAS.
- J.-H. Wee, Renewable Sustainable Energy Rev., 2007, 11, 1720–1738 CrossRef CAS.
- S. Walch, A. Dhanda, M. Aryanpour and H. Pitsch, J. Phys. Chem. C, 2008, 112, 8464–8475 CrossRef CAS.
- E. Watanabe, H. Ushiyama and K. Yamashita, Catal. Sci. Technol., 2015, 5, 2769–2776 RSC.
- X. Yang, A. Banerjee, Z. Xu, Z. Wang and R. Ahuja, J. Mater. Chem. A, 2019, 7, 27441–27449 RSC.
- R. Ma, G. Lin, Y. Zhou, Q. Liu, T. Zhang, G. Shan, M. Yang and J. Wang, npj Comput. Mater., 2019, 5, 78 CrossRef.
- A. Sarapuu, E. Kibena-Põldsepp, M. Borghei and K. Tammeveski, J. Mater. Chem. A, 2018, 6, 776–804 RSC.
- Z. R. Ismagilov, M. A. Kerzhentsev, N. V. Shikina, A. S. Lisitsyn, L. B. Okhlopkova, Ch. N. Barnakov, M. Sakashita, T. Iijima and K. Tadokoro, Catal. Today, 2005, 102–103, 58–66 CrossRef CAS.
- H. A. Gasteiger, S. S. Kacha, B. Sompalli and F. T. Wagner, Appl. Catal., B, 2005, 56, 9–35 CrossRef CAS.
- X. Zhou, Y. Gan, J. Du, D. Tian, R. Zhang, C. Yang and Z. Dai, J. Power Sources, 2013, 232, 310–322 CrossRef CAS.
- N. M. Markovic, T. J. Schmidt, V. Stamenkovic and P. N. Ross, Fuel cells, 2001, 1, 105–116 CrossRef CAS.
- A. Qaseem, F. Chen, X. Wu and R. L. Johnston, Catal. Sci. Technol., 2016, 6, 3317–3340 RSC.
- Y. Nie, L. Li and Z. Wei, Chem. Soc. Rev., 2015, 44, 2168–2201 RSC.
- A. M. G. Marín, R. Rizo and J. M. Feliu, Catal. Sci. Technol., 2014, 4, 1685–1698 RSC.
- W. Li, Z. Chen, L. Xu and Y. Yan, J. Power Sources, 2010, 195, 2534–2540 CrossRef CAS.
- T. Toda, H. Igarashi, H. Uchida and M. Watanabe, J. Electrochem. Soc., 1999, 146, 3750–3756 CrossRef CAS.
- J. Liu, X. Fan, C. Sun and W. Zhu, Materials, 2018, 11, 33 CrossRef PubMed.
- Z. Yin, L. Lin and D. Ma, Catal. Sci. Technol., 2014, 4, 4116–4128 RSC.
- D. Jariwala, V. K. Sangwan, L. J. Lauhon, T. J. Marks and M. C. Hersam, ACS Nano, 2014, 8, 1102–1120 CrossRef CAS PubMed.
- Y. Li, Y.-L. Li, B. Sa and R. Ahuja, Catal. Sci. Technol., 2017, 7, 545–559 RSC.
- X. Yang, A. Banerjee and R. Ahuja, Catal. Sci. Technol., 2019, 9, 4981–4989 RSC.
- A. Eftekhari, J. Mater. Chem. A, 2017, 5, 18299–18325 RSC.
- B. Balasubramaniam, N. Singh, P. Kar, A. Tyagi, J. Prakash and R. K. Gupta, Mol. Syst. Des. Eng., 2019, 4, 804–827 RSC.
- H. Tao, Q. Fan, T. Ma, S. Liu, H. Gysling, J. Texter, F. Guo and Z. Sun, Prog. Mater. Sci., 2020 DOI:10.1016/j.pmatsci.2020.100637.
- S. J. Rowley-Neale, J. M. Fearn, D. A. C. Brownson, G. C. Smith, X. B. Ji and C. E. Banks, Nanoscale, 2016, 8, 14767–14777 RSC.
- S. Jayabal, G. Saranya, J. Wu, Y. Q. Liu, D. S. Geng and X. B. Meng, J. Mater. Chem. A, 2017, 5, 24540–24563 RSC.
- H. Huang, X. Feng, C. C. Du and W. B. Song, Chem. Commun., 2015, 51, 7903–7906 RSC.
- Y. Singh, S. Back and Y. Jung, ChemElectroChem, 2018, 5, 4029–4035 CrossRef CAS.
- H. Huang, X. Feng, C. C. Du, S. Y. Wu and W. B. Song, J. Mater. Chem. A, 2015, 3, 16050–16056 RSC.
- Z. X. Wang, J. X. Zhao, Q. H. Cai and F. Y. Li, J. Mater. Chem. A, 2017, 5, 9842–9851 RSC.
- H. Huang, X. Zhang, Y. Zhang, B. Huang, J. Cai and S. Lin, Int. J. Hydrogen Energy, 2018, 43, 8290–8297 CrossRef CAS.
- I. S. Kwon, I. H. Kwak, J. Y. Kim, H. G. Abbas, T. T. Debela, J. Seo, M. K. Cho, J.-P. Ahn, J. Park and H. S. Kang, Nanoscale, 2019, 11, 14266–14275 RSC.
- K. Yuan, X. D. Zhuang, H. Y. Fu, G. Brunklaus, M. Forster and Y. W. Chen, et al., Angew. Chem., Int. Ed., 2016, 128, 6972–6977 CrossRef.
- J. H. Guo, Y. T. Shi, X. G. Bai, X. C. Wang and T. L. Ma, J. Mater. Chem. A, 2015, 3, 24397–24404 RSC.
- K. Zhao, W. Gu, L. Y. Zhao, C. L. Zhang, W. D. Peng and Y. Z. Xian, Electrochim. Acta, 2015, 169, 142–149 CrossRef CAS.
- H. Liu, N. Han and J. Zhao, RSC Adv., 2015, 5, 17572–17581 RSC.
- G. Kresse and J. Furthmüller, Phys. Rev. B: Condens. Matter Mater. Phys., 1996, 11169 CrossRef CAS PubMed.
- J. P. Perdew, J. A. Chevary, S. H. Vosko, K. A. Jackson, M. R. Pederson, D. J. Singh and C. Fiolhais, Phys. Rev. B: Condens. Matter Mater. Phys., 1992, 46, 6671–6687 CrossRef CAS PubMed.
- J. P. Perdew, K. Burke and M. Ernzerhof, Phys. Rev. Lett., 1996, 77, 3865–3868 CrossRef CAS PubMed.
- P. E. Blöchl, Phys. Rev. B: Condens. Matter Mater. Phys., 1994, 50, 17953–17979 CrossRef PubMed.
- G. Kresse and D. Joubert, Phys. Rev. B: Condens. Matter Mater. Phys., 1999, 59, 1758–1775 CrossRef CAS.
- P. E. Blöchl, C. J. Först and J. Schimpl, Bull. Mater. Sci., 2003, 26, 33–41 CrossRef.
- H. J. Monkhorst and J. D. Pack, Phys. Rev. B: Condens. Matter Mater. Phys., 1976, 13, 5188–5192 CrossRef.
- H. Jónsson, G. Mills and K. W. Jacobsen, in Classical and quantum dynamics in condensed phase simulation, World Scientific, Singapore, 1998, pp. 385–404 Search PubMed.
- G. Henkelman, B. P. Uberuaga and H. Jónsson, J. Chem. Phys., 2000, 113, 9901–9904 CrossRef CAS.
- G. Henkelman and H. Jónsson, J. Chem. Phys., 2000, 113, 9978–9985 CrossRef CAS.
- J. K. Nørskov, J. Rossmeisl, A. Logadottir, L. Lindqvist, J. R. Kitchin, T. Bligaard and H. Jonsson, J. Phys. Chem. B, 2004, 108, 17886–17892 CrossRef.
- D. N. Son and K. Takahashi, J. Phys. Chem. C, 2012, 116, 6200–6207 CrossRef CAS.
- D. N. Son, O. K. Le, V. Chihaia and K. Takahashi, J. Phys. Chem. C, 2015, 119, 24364–24372 CrossRef CAS.
- D. N. Son, P. N. Thanh, N. D. Quang, K. Takahashi and M. P. Pham-Ho, J. Appl. Electrochem., 2017, 47, 747–754 CrossRef CAS.
Footnote |
| † Electronic supplementary information (ESI) available. See DOI: 10.1039/c9ra09809g |
|
| This journal is © The Royal Society of Chemistry 2020 |
Click here to see how this site uses Cookies. View our privacy policy here.  Open Access Article
 ab,
Nguyen Thi Xuan Huynhabc,
Pham Tan Thiab,
Viorel Chihaia
 d and
Do Ngoc Son
 *ab
*ab


 which is listed in Table 2. For the isolated oxygen molecule, the total energy was obtained to be −9.871 eV and the bond distance of two oxygen atoms is 1.23 Å. The favorable adsorption configurations are D1, D2, and P1 as presented in Fig. 4; and the less favorable configurations are D3, D4, P2, and P3 as shown in Fig. S1 in ESI.† Where, the name of each configuration enclosed with the letters D and P for the defect and perfect regions, respectively.
 on the WTed2 substrate and the distances between two oxygen atoms (dO–O), from the nearest oxygen atom to the nearest tellurium atom (dO–Te), and the nearest oxygen atom to the nearest tungsten atom (dO–W)
 for the regions I, II, and III were found to be D1, D2, and P1, respectively. Table 2 also shows that the adsorption energy of
  in the regions I and II is approximately the same, but greatly different compared to that of region II, because
  is in the molecular and atomic state for the former and latter, respectively. We can understand the differences in the states of
  and the structures of D1, D2, and P1 by analyzing their structural parameters, which are listed in Table 2. We find that the bond length between two oxygen atoms is the same for
  in the regions I and III; however, the bond length is significantly longer by 0.28 Å as
  in region II. The configuration with the longer dO–O bond length has the shorter dO–W and dO–Te distances. This result implies that when the oxygen molecule comes closer to the surface, the adsorption becomes stronger and therefore the distance of the two oxygen atoms becomes elongated; and hence, the oxygen atoms gradually moves far from one another. The distance between two oxygen atoms in the region II longer by 0.28 Å compared to that in the region I and III were also found to be in good agreement with the result in the literature.38
 system in the initial and final states in Fig. 6 shows that the oxygen atoms are the centers of charge gain. The charge-gain cloud covers both oxygen atoms in the initial state, while it is well separated to each oxygen atom in the final state. This result indicates that the oxygen atoms are in the molecular and atomic states for the initial and final states, respectively. The charge increase of the oxygen atoms as compared to that of the neutral ones is 0.075, 0.44, and 1.703 e− for the IS, TS, and FS, respectively.
 Besides, the adsorption energy for the D21 configuration is much lower than that of D11 and P11, see Table 4. The second proton transfer process will be carried out by using the D11, D21, and P11 configurations as the initial structures.


 to H2O, which includes the adsorption of atomic oxygen and two hydrogenation steps. Fig. 9 shows that after O* absorbed on the substrate, the first and second hydrogenation steps occur to convert O* to HO*, and HO* to H2O, respectively. Noticeably, the adsorption of O* is downhill, and hence O* easily form on the surface of the substrate; however, the first hydrogenation step has to overcome an energy barrier of 2.81 eV for region II and about 0.95 eV for the boundary II–III and region III. Furthermore, for region II, the energy level of the HO* formation step is below that of H2O, which causes the reverse reaction of forming HO* from H2O automatically. Whilst, there are no reverse reactions in the boundary II–III and region III. The reverse reaction makes the ORR more difficult to maintain the byproduct H2O and hence lower the efficiency of the fuel cells. We found that the formation of H2O requires significantly smaller activation energy, i.e., 0.95 eV in the boundary II–III and region III compared to 4.81 eV in region II. The characteristics of the Gibbs free energy diagram for the dissociative mechanism on the defective WTe2 were found to be similar to that on the transition alloys.50
 occurs automatically. However, the formation of HOO* and HOOH* requires the activation energy of 1.41 and 1.52 eV counted from the energy level of
  respectively. The rate-limiting step is the first hydrogenation process for region III and the second hydrogenation process forming HOOH* for region I. We find that the ORR proceeds to form H2O more easily on region III than on region I. The reverse ORR does not automatically happen on these surface regions of the substrate.
 dissociation process was calculated with the inclusion of the electrode potential, ZPE, and entropy. The O2 molecule adsorbs in region I to form
  then overcome the energy barrier of 0.28 eV to create 2O* + 4 (H+ + e−). The first hydrogenation step converts this intermediate to HO* + O* + 3(H+ + e−). The second hydrogenation step transforms HO* + O* + 3 (H+ + e−) into HO* + HO* + 2 (H+ + e−) and O* + H2O + 2 (H+ + e−). The hydrogenation steps are uphill; therefore, absorb energy to proceed with the reaction. The energy consumption is about 3 eV to completely transform the intermediates into the final product of 2H2O. Noticeably, the reverse reaction perhaps occurs in this case. Therefore, one can not maintain the final product without continuously supplying the energy for the reaction. We can see that the Gibbs free energy in eqn (2) includes the reaction energy ΔE, ΔE = E(after reaction) − E(before reaction). The NEB energy barrier ΔENEB is similar to ΔE, ΔENEB = E(saddle point) − E(before reaction). Therefore, we can apply the same expressions for the Gibbs free energy to the saddle point by substituting ΔENEB for ΔE. Whilst the other parameters in eqn (2) can be calculated in the same manner as those for the intermediate reactions. Therefore, the combination of Gibbs and NEB calculations can display a more complete picture of the reaction including also the transition point.


