 Open Access Article
Unravelling the role of temperature in a redox supercapacitor composed of multifarious nanoporous carbon@hydroquinone†
Aditi Barua and
Amit Paul *
*
Department of Chemistry, Indian Institute of Science Education and Research (IISER), Bhopal, MP 462066, India. E-mail: apaul@iiserb.ac.in
First published on 8th January 2020
Abstract
The intermittency of renewable energy sources has led to the invention of supercapacitors. The variation of temperature impacts their working capability particularly in the regions which are too hot or too cold. Herein, the effect of temperature on the double layer formation and the redox mechanism of hydroquinone adsorbed on multifarious nanoporous carbon (MNC) have been reported. The studies have been carried out in 2 M H2SO4 electrolyte solution within a temperature range of −10 to 50 °C. The maximum specific capacitance of the composite material drops from 319 F g−1 at 50 °C to 213 F g−1 at −10 °C. An equivalent circuit model has been chosen to fit the EIS spectra at the double layer potential and formal potential. Subsequently, an Arrhenius type plot has been constructed to calculate the activation energy of the system which revealed 8.69 and 7.77 kJ mol−1 activation energy at the formal potential and double layer potential respectively. The composite also shows excellent cyclability even at enhanced temperatures, which is a major requirement for the application of these supercapacitors in vehicles and other electrical equipment.
Introduction
It is a truth universally acknowledged that the ever growing population has accelerated the rate of consumption of fossil fuels due to the increasing exigency for energy. Focus has been placed on alternate sources of energy such as geothermal, sunlight, wind etc. However, the diurnal nature and seasonality of solar and wind power, along with the constraint of varying geography lead to intermittency of such renewable energy sources. Hence, to cope with the increasing demand for storing energy, research on electrochemical energy storage devices has gained momentum in the current era. As early as 1957, engineers at General Electric first began conducting experiments with activated charcoal for charge storage. Next, researchers at Standard Oil of Ohio (SOHIO) in 1966 accidentally came across the phenomenon of double layer capacitor while working on fuel cells. Yet it was not commercialized by them, and was instead licensed to NEC Corp. of Tokyo, who finally marketed this device as a ‘supercapacitor’ to be used in memory back-up power.1 Commercial supercapacitors are mainly of the electrical double layer type, called as electrical double layer capacitors (EDLCs) which employ the phenomenon of double layer formation at the electrode/electrolyte interface.2–4 Combined with this, pseudocapacitors can boost the charge storage ability by incorporating redox reactions.5,6 Mostly, these devices find utility in emergency shut-down support, ultrabatteries, voltage stabilizer, medical defibrillators, aeronautics, military equipments, hybrid electric vehicles, portable electronic devices to name a few.1,7–11 The key difference between batteries and supercapacitors lies in the fact that supercapacitors have a higher power density than that of batteries even though their energy density is much lower as compared to the same.12,13 The performance of supercapacitors is also influenced by the type of electrolyte used in the device.14,15 Ionic liquids and organic electrolytes are generally implemented because of their wider potential stability windows. Nonetheless, it has already been conceded that aqueous electrolytes have certain benefits in terms of their environmental friendliness, economic values, higher electrical conductivity etc.14 Ergo, understanding the role of the electrolyte and its impact on the electrode kinetics are of utmost significance. Since these devices majorly find use in electrical equipments, their performance in a high temperature environment caused by heating up of the equipment needs evaluation. Besides, due to varying weather conditions pertaining to different regions, the broad temperature effects of supercapacitors need further research. It is widely known that temperature plays a pivotal role in determining the stability of electrolytes, and working of the supercapacitors in general. Consequently, it is important to assess their functionality under harsh temperature conditions.The versatility of carbon based materials has rendered them a noteworthy status in the field of science and technology. Starting from batteries, supercapacitors, H2 storage to inks and paints, pencil tips, metal smelting etc., the usage of carbon is prodigious.16–20 In supercapacitor technology particularly, carbon based materials are prominent as their high surface area leads to substantial charge storage properties in the form of a double layer.21–23 Their performance can be further augmented by activation with oxidants such as NaOH, KOH, H3PO4 etc.24–26 KOH activation of a non-porous carbon led to a whopping 250 times increase in the specific capacitance as reported by Singh et al.26 The next obvious step of research on carbon based materials as supercapacitors would be the impact of temperature variation on their working principle. Literature reports are aplenty on the thermal characteristics of materials such as activated carbon,27–30 onion-like carbons,31 carbon nanotubes,30–32 graphene,33–37 and metal oxides like hydrous RuO2,38 MnO2,39–43 α-Fe2O3,44 La2O3 nanosheet decorated reduced graphene oxide45 etc. Masarapu et al. reported the effect of temperature on the kinetics and diffusion mechanism of SWCNTs in an organic electrolyte and showed outstanding stability of the material after repeated heating and cooling followed by an additional 224![[thin space (1/6-em)]](https://www.rsc.org/images/entities/char_2009.gif) 000 charge–discharge cycles.32 Iwama et al. investigated the characterizations of a Batscap SC for low temperature applications. Electrochemical impedance spectroscopic (EIS) studies in the above cases also revealed the change in various electrode processes upon systematic increase or decrease in temperature. Typically, such EIS studies are mostly carried out for double layer formation, and literature reports on the effect of temperature on the redox properties of the active material are limited.30,32,46 Additionally, since temperature dependence investigations are mostly performed in organic electrolytes and ILs, detailed reports on the workings of a supercapacitor in aqueous electrolytes under temperature variations are minimal.29,40
000 charge–discharge cycles.32 Iwama et al. investigated the characterizations of a Batscap SC for low temperature applications. Electrochemical impedance spectroscopic (EIS) studies in the above cases also revealed the change in various electrode processes upon systematic increase or decrease in temperature. Typically, such EIS studies are mostly carried out for double layer formation, and literature reports on the effect of temperature on the redox properties of the active material are limited.30,32,46 Additionally, since temperature dependence investigations are mostly performed in organic electrolytes and ILs, detailed reports on the workings of a supercapacitor in aqueous electrolytes under temperature variations are minimal.29,40
Further increase in the charge storage properties of supercapacitors can be brought about by the inclusion of redox active materials. Meyer and co-workers emphasized the effect of oxide sites on a glassy carbon working electrode to transform the irreversibility of catechol into reversibility.47 Singh et al. reported a maximum specific capacitance of 200 F g−1 in activated charcoal with hydroquinone physisorbed on its surface.48 In this work, we have examined the consequences of temperature alteration on a multifarious nanoporous carbon (MNC) with surface-adsorbed hydroquinone (H2Q) acting as the redox probe wherein H2SO4 has been used as electrolyte. The ease of synthesis of the composite MNC-H2Q along with the relatively economical nature of the starting materials and their ecologically green genre make them appealing for future commercialization. Cyclic voltammetry (CV), electrochemical impedance spectroscopy (EIS), galvanostatic charge/discharge (GCD) experiments were employed extensively to analyse the performance of the supercapacitor at various temperatures. Particularly, EIS studies have been performed at both the double layer and at the formal potential to account for their differing responses under temperature fluctuations.
Experimental section
Chemicals
Micro/mesoporous carbon (100 mesh, MMC), potassium hydroxide (KOH), hydroquinone (H2Q), N-methyl pyrrolidone (NMP), poly(vinylidene fluoride) (PVDF) have been purchased from Sigma-Aldrich. Concentrated sulphuric acid has been purchased from Merck Emplura. Acetylene black, platinum (Pt) foil and Pt wire electrodes were purchased from Alfa Aesar. A saturated calomel electrode (SCE) was purchased from CH instruments.KOH activation of MMC
Following a previous report,26 micro/mesoporous carbon (MMC) was activated using KOH as the oxidant. 1 g of MMC and 5 g of KOH were ground together using a mortar and pestle and then transferred to an alumina crucible. The crucible was then inserted into a temperature controlled tube furnace, followed by carbonization under continuous N2 flow (Fig. 1). The sample was heated to a temperature of 750 °C at a ramp rate of 5 °C min−1 and subsequently held at the same temperature for 1 h. It was allowed to cool naturally under N2 flow and then washed thoroughly with 5 N HCl to eliminate different mineral contents, followed by water, which in turn eliminated the chloride ions. The KOH activated MMC will henceforth be termed as MNC (Multifarious Nanoporous Carbon) in the rest of the discussion.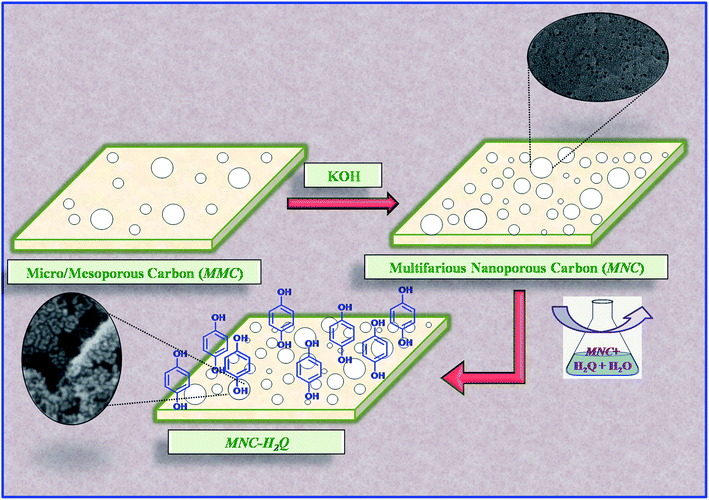 | ||
| Fig. 1 Schematic representation of the preparation of MNC from micro/mesoporous carbon (MMC) and subsequent formation of MNC-H2Q from MNC. | ||
Preparation of active material (MNC-H2Q)
Previous literature report from our group has been followed to prepare the active material.48 Briefly, 500 mg of MNC and 275 mg of hydroquinone (H2Q) were shaken in 50 mL distilled water in a conical flask at a temperature of 50 °C for 24 h at a rate of 90 rpm (Fig. 1). It was then filtered and dried in a hot air oven at 60 °C for 24 h. This active material has been termed as MNC-H2Q and the explanation behind the nomenclature has been provided in results and discussion.Characterizations
Electrochemical measurements
Electrochemical experiments were conducted using a BioLogic potentiostat (SP-240). Temperature dependent studies were performed in an ESPEC SH-222 temperature and humidity chamber. Electrochemical experiments were performed at −10, 0, 10, 20, 30, 40 and 50 °C. For the three electrode supercapacitor studies, a saturated calomel electrode (SCE), active material coated Pt foil electrode, and Pt wire were used as reference electrode, working electrode, and counter electrode respectively. The active material, acetylene black and PVDF were taken in a ratio of 10![[thin space (1/6-em)]](https://www.rsc.org/images/entities/char_2009.gif) :
:![[thin space (1/6-em)]](https://www.rsc.org/images/entities/char_2009.gif) 2
2![[thin space (1/6-em)]](https://www.rsc.org/images/entities/char_2009.gif) :
:![[thin space (1/6-em)]](https://www.rsc.org/images/entities/char_2009.gif) 2 and then added to 1 mL NMP solution. It was then stirred for 6 h to ensure proper homogenization. 100 μL of this solution was then drop-casted onto cleaned Pt foil working electrodes, covering 1 cm2 area, and subsequently dried in a hot air oven at 100 °C for 14 h. Mass of material deposited on each electrode was 1.2 mg cm−2. Cyclic voltammetry (CV) studies were carried out in a potential range of −0.15 to +0.75 V vs. SCE at scan rates of 1, 5, 10, 20, 50 and 100 mV s−1 in 2 M H2SO4. Galvanostatic charge/discharge (GCD) studies were performed in the same potential window at current densities of 1, 1.5, 2, 5 and 10 A g−1. Electrochemical impedance spectroscopy (EIS) experiments were performed at 0 V vs. SCE and at the formal potentials determined at different temperatures over a frequency range of 10−2 to 105 Hz. The specific capacitance (Csp) values from CVs were calculated from eqn (1) and that from GCD were determined from eqn (2),
2 and then added to 1 mL NMP solution. It was then stirred for 6 h to ensure proper homogenization. 100 μL of this solution was then drop-casted onto cleaned Pt foil working electrodes, covering 1 cm2 area, and subsequently dried in a hot air oven at 100 °C for 14 h. Mass of material deposited on each electrode was 1.2 mg cm−2. Cyclic voltammetry (CV) studies were carried out in a potential range of −0.15 to +0.75 V vs. SCE at scan rates of 1, 5, 10, 20, 50 and 100 mV s−1 in 2 M H2SO4. Galvanostatic charge/discharge (GCD) studies were performed in the same potential window at current densities of 1, 1.5, 2, 5 and 10 A g−1. Electrochemical impedance spectroscopy (EIS) experiments were performed at 0 V vs. SCE and at the formal potentials determined at different temperatures over a frequency range of 10−2 to 105 Hz. The specific capacitance (Csp) values from CVs were calculated from eqn (1) and that from GCD were determined from eqn (2),
 | (1) |
 | (2) |
 | (3) |
Results and discussions
Powder X-ray diffraction (PXRD) was performed for MNC and MNC-H2Q. Peaks at ∼24° and 44° were observed for both the samples, characteristic of (002) and (100) diffractions of graphitic carbon (Fig. S1, ESI†).19 Brunauer–Emmett–Teller (BET) N2 adsorption/desorption analysis of MNC-H2Q has been depicted in Fig. 2a. The BET of MNC-H2Q exhibited mixed Type-I and Type-IV isotherm profile with a hysteresis loop of H4 type according to IUPAC classification. The surface area of MNC is 3090 m2 g−1 having pores centred at 0.56, 1.3, 2.6, 3.5 and 5.2 nm and with a total pore volume of 2.3 cm3 g−1 (Fig. S2, ESI†).26 Since, the material had a range of nanopores, hence it has been termed as multifarious nanoporous carbon (MNC) in this work. After adsorption of H2Q, the surface area of the resultant MNC-H2Q declined to 610 m2 g−1 (Fig. 2a) and it has pores centred at 0.62, 1.4, 2.6, 3.8 and 7.4 nm respectively which was determined using non-local density functional theory (NLDFT) (Fig. 2b). This reduction in surface area is due to incorporation of H2Q inside the pores of MNC, which is further supported by a reduction in the total pore volume to 0.58 cm3 g−1 (Fig. 2c). The amount of H2Q adsorbed on MNC-H2Q was determined from thermo-gravimetric analysis (TGA) which revealed a 12% weight loss in the temperature range of 130 to 250 °C (Fig. S3, ESI†). Since, the melting point of H2Q is 172 °C, the 12% weight loss can be attributed to the desorption of H2Q from MNC-H2Q. The weight loss between 50 and 130 °C is presumably due to the evaporation of water molecules present inside the pores, which has been previously observed also.48 It is discernible from BET analysis that the pores in MNC-H2Q have expanded slightly in accordance with the structural adjustment that the system had to undergo in order to make the hydroquinone adsorption process entropically favourable, thereby gaining thermodynamic feasibility according to previous literature report from our group (vide infra).48 This is also evident from the SEM images in Fig. 3a and b wherein it can be clearly noticed that the adsorption of H2Q in MNC-H2Q resulted in morphological expansion compared to the precursor material (MNC). Differential scanning calorimetry (DSC) reveals that H2Q desorbed from MNC-H2Q at a temperature of 211 °C (Fig. S4, ESI†). Due to strong H-bonds between H2Q and MNC and presence of ultramicropores/micropores, the desorption temperature for H2Q rose from 172 to 211 °C. The enthalpy change (ΔH) for this melting process was (−)7.53 kJ mol−1 which implies exothermicity of the process. Therefore, the process of adsorption must be endothermic in nature. Hence, for the spontaneity of the adsorption process, i.e. to achieve a negative Gibbs free energy (ΔG), the change in entropy (ΔS) must be positive. The morphological changes after the adsorption of H2Q can be directly related to this increase in entropy, which was caused by the enhanced randomness at the adsorbent/adsorbate interface.50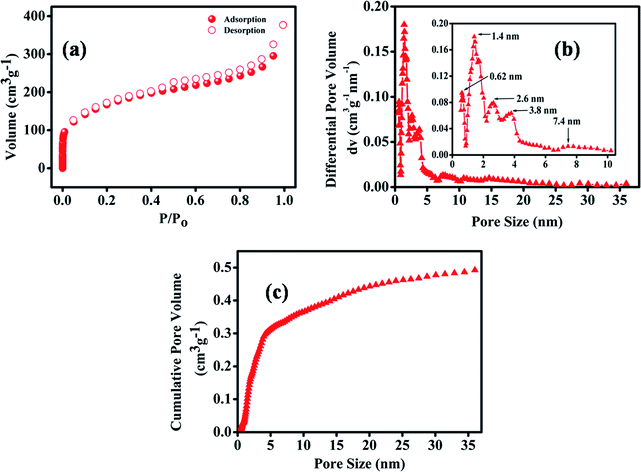 | ||
| Fig. 2 Characterizations of MNC-H2Q using BET. (a) N2 adsorption/desorption isotherms, (b) pore size distribution and (c) cumulative pore volume. | ||
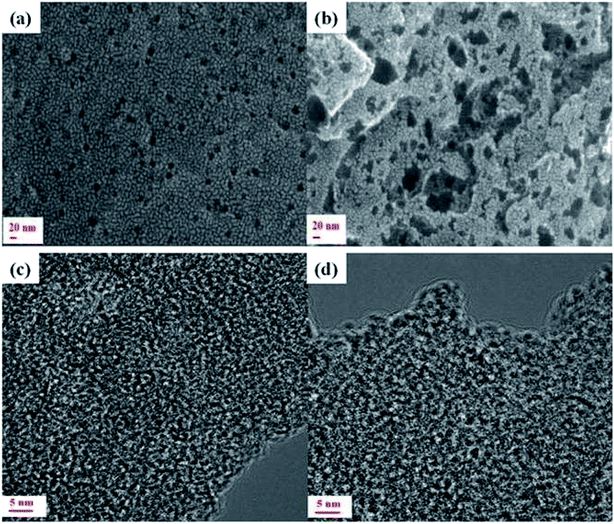 | ||
| Fig. 3 Morphological characterizations of MNC and MNC-H2Q. SEM and HR-TEM images of MNC are shown in (a and c) and of MNC-H2Q in (b and d) respectively. | ||
Fig. 3c and d compare the high resolution transmission electron microscopy (HR-TEM) micrographs of MNC before and after physisorption of H2Q respectively. Fig. 3c reveals the highly amorphous texture and disordered nature of MNC with a porous morphology that is consistent with the results from BET. The porosity of the successor material was maintained after the adsorption of H2Q (Fig. 3d) and it is apparent that the pores in MNC-H2Q are somewhat larger than that of MNC which contributed to the decrease in surface area of MNC after inclusion of H2Q which is again consonant with the BET results.
Electrochemical results of MNC-H2Q
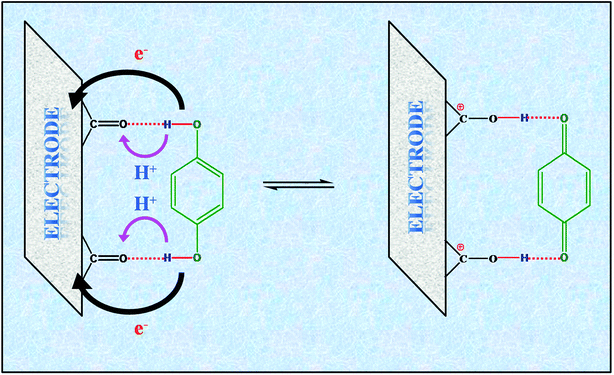
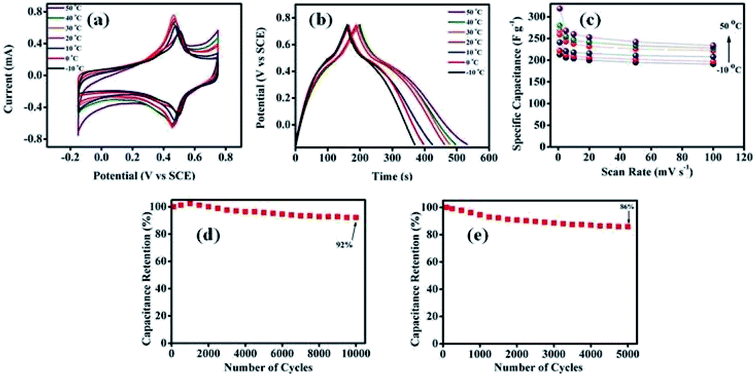
All the electrochemical experiments were carried out in 2 M H2SO4 electrolyte solution. The cyclic voltammograms (CVs) of MNC-H2Q were rectangular in shape with a sharp redox peak at ∼0.46 V vs. SCE which is ascribed to the redox reaction between benzoquinone (BQ) and hydroquinone (H2Q) at all temperatures (Fig. 5a). We have previously reported that H-bonds formation takes place between the oxide sites of nanoporous carbon and H2Q (Fig. 4).48 The H-bond between the oxide groups of MNC and H2Q leads to a proton shuttling mechanism wherein the H+ moves between the –OH functionalities of H2Q and the carbonyl oxygen of MNC and simultaneously two electron transfers occur between the electrode and MNC-H2Q (Fig. 4).This H-bonding, in turn, also imparts stability to the H2Q/BQ system (vide infra). The specific capacitance of the composite material at 1 mV s−1 was determined to be 259 F g−1 at 20 °C (Table 1). This value nearly remains unaltered even after incorporation of H2Q in the system, (Fig. S5 and Table S1, ESI†) since H2Q blocks a large number of pores of MNC which presumably reduces double layer charging. Nevertheless, because of the inclusion of pseudocapacitance which resulted in a sharp peak in the CV, it was possible to probe the temperature dependence of redox reactions which is the main objective of this study.
| Scan rate (mV s−1) | Specific capacitance (F g−1) | ||||||
|---|---|---|---|---|---|---|---|
| −10 °C | 0 °C | 10 °C | 20 °C | 30 °C | 40 °C | 50 °C | |
| 100 | 191 | 197 | 208 | 222 | 226 | 229 | 234 |
| 50 | 195 | 202 | 211 | 226 | 233 | 234 | 242 |
| 20 | 200 | 206 | 216 | 232 | 240 | 242 | 253 |
| 10 | 204 | 209 | 218 | 238 | 244 | 247 | 260 |
| 5 | 206 | 212 | 221 | 243 | 250 | 255 | 268 |
| 1 | 213 | 222 | 241 | 259 | 269 | 280 | 319 |
The influence of temperature on the performance of the supercapacitor was examined within a range of −10 to 50 °C. From the CV curves collected at 1 mV s−1 scan rate in Fig. 5a, the increase in the integral area with increasing temperature is apparent. Table 1 reveals that the specific capacitances of MNC-H2Q increases with increasing temperature at all scan rates since the ionic mobility of the electrolyte ions increases with rise in temperature, resulting in faster movement of ions towards the electrode surface for the formation of the electrical double layer. Indeed, the highest specific capacitance at 1 mV s−1 at 50 °C was 319 F g−1 which decreased to 213 F g−1 at −10 °C (Table 1). Thus, there was a 33% drop in the specific capacitance at the lowest scan rate with decreasing operational temperature (Fig. 5c and Table 1). However, the specific capacitance drop at a higher scan rate of 100 mV s−1 was only 18% (Fig. 5c, Table 1 and Fig. S6h, ESI†). This is due to the fact that at a faster time scale, only a limited number of ions will be able to contribute to the formation of double layer and subsequent faradaic reaction and hence the temperature variation will affect the kinetics to a much smaller extent at a faster scan rate as compared to that at a slower scan rate.
Galvanostatic charge/discharge curves at 1 A g−1 for MNC-H2Q have been shown in Fig. 5b and it also reveals that specific capacitance increases with increasing temperature. The discharging time of the supercapacitor was longer than the charging time at low current density (1 A g−1), i.e. coulombic efficiency (C.E.) was greater than one, which was presumably due to slight onset of hydrogen evolution reaction (HER) occurred at the lowest potential window (between −0.1 to −0.15 V vs. SCE). In our experimental set-up, part of the Pt working electrode was exposed in the electrolyte solution and it is well known that Pt catalyses HER. The long term stability of the active material was evaluated by performing several CV cycles. It showed remarkable specific capacitance retention of 92% after 10![[thin space (1/6-em)]](https://www.rsc.org/images/entities/char_2009.gif) 000 cycles at 20 °C (Fig. 5d). It must also be noted that even at a high temperature of 50 °C, 86% retention was observed after 5000 cycles (Fig. 5e). The decrease in cyclic stability of a supercapacitor at higher temperatures has been observed previously.41,51 The decrease in cyclic stability at higher temperature can be attributed to the enhancement of decomposition of H2Q moieties during electrochemical cycling. Fig. S6, ESI† revealed that at room temperature, the CVs remained similar after 1000 cycles, however at 50 °C, a significant decay in the redox peak was observed and thus suggesting degradation of H2Q moieties during electrochemical cycling.
000 cycles at 20 °C (Fig. 5d). It must also be noted that even at a high temperature of 50 °C, 86% retention was observed after 5000 cycles (Fig. 5e). The decrease in cyclic stability of a supercapacitor at higher temperatures has been observed previously.41,51 The decrease in cyclic stability at higher temperature can be attributed to the enhancement of decomposition of H2Q moieties during electrochemical cycling. Fig. S6, ESI† revealed that at room temperature, the CVs remained similar after 1000 cycles, however at 50 °C, a significant decay in the redox peak was observed and thus suggesting degradation of H2Q moieties during electrochemical cycling.
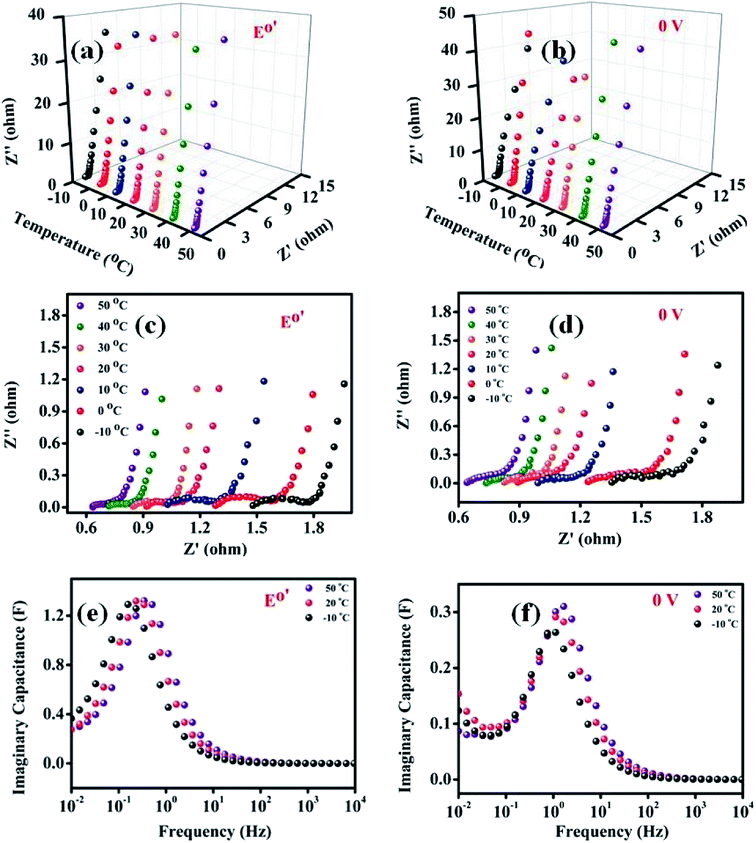
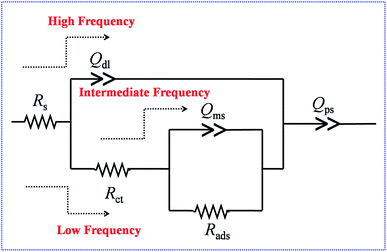
The role of temperature in influencing the various electrochemical processes at the electrode/electrolyte interface has been analysed further by electrochemical impedance spectroscopy (EIS). These EIS studies were carried out at a double layer potential, i.e., 0 V vs. SCE and at the formal potential (E0′) of the H2Q/BQ couple at different temperatures (Fig. 6a–d). The equivalent circuit chosen to analyse the EIS data has been provided in Fig. 7.52 In this circuit, Rs denotes the solution resistance or the equivalent series resistance and the current has to pass through this part of the circuit at all frequencies. The double layer capacitance just at the electrode/electrolyte interface at a very fast time scale has been represented by a constant phase element (CPE, Qdl) because of surface inhomogeneity of the electrode.52,53 Cdl values can be calculated from Qdl utilizing eqn (4) wherein ω and “a1” represent frequency corresponding to the maxima on the imaginary component of the impedance in the high frequency region and exponent of Qdl respectively.
| Cdl = Qdl ×(ω)a1−1 | (4) |
CPE behaves as a pure capacitor when its exponent, “a” equals to 1, and behaves like a pure resistor when “a” is 0. An exponent value of 0.5 signifies the Warburg element, characterized by diffusion limitation and all other values correspond to intermediate behaviour.54 At higher frequencies, the current will pass through Qdl. However, as the frequency decreases, impedance due to Qdl increases rapidly and hence does the current flow through Rct, i.e., the charge transfer resistance at the electrode/electrolyte interface and Qms, i.e. the diffusion capacitance arising from mass transport of electrolyte ions inside the nanopores of the nanomaterial. Rads represents the resistance due the adsorption of the electrolyte ions inside the pores of the active material. As the frequency further decreases, impedance through Qms increases and hence the current passes through Rads, and finally through Qps, the pseudocapacitive charging originating from the movement of electrons inside the material.
In the high frequency region, the first intersection on the real axis is the solution resistance Rs (Fig. 6c and d). The Rs values are nearly same at double layer potential and formal potential since solution resistance is not dependent on electrode potential (Tables 2 and 3). Cdl is the double layer capacitance just at the electrode/electrolyte interface at a very fast time scale and it is interesting to note that a comparison of Cdl values at the double layer potential and formal potential revealed a higher value at the double layer potential since the amount of H2Q adsorbed, the source of pseudocapacitance, is only 12% (Tables 2 and 3).On the other hand, Rct values at the double layer potential is higher than that of formal potential presumably due to the fact that with increasing electrode potential, the corresponding electric field created in the electrolyte solution will be stronger and thereby lessening the driving force for the charge/electron transfer process taking place at the electrode/electrolyte interface (Tables 2 and 3). Interestingly, Rads values follow a reverse trend compared to Rct since at 0 V potential, the population of the electrolyte ions in proximity to the electrode will be less at double layer potential than that at formal potential (Tables 2 and 3). Diffusion capacitance (Qms) revealed a higher capacitive behaviour at the double layer potential; a conclusion reached by comparing “a2” values in Tables 2 and 3 which could be due to significant electron transfer contribution at the formal potential. The Qps values are also significantly higher at the formal potentials in comparison to that at the double layer potential (Tables 2 and 3) due to the same concept described for Qms. The plot of imaginary capacitance vs. frequency shows a maximum, and the inverse of this frequency is known as the dielectric relaxation constant (τ0), which is the time required for the supercapacitor device to deliver 50% of its power49 (Fig. 6e and f). At both the double layer potential and the formal potential, the τ0 values have been determined and summarized in Tables 2 and 3. The τ0 values were 4–5 times higher at formal potential compared to double layer potential since electron transfer processes require longer time scales than that of double layer formation due to electrostatic interaction. Furthermore, herein the electron transfer process also involves H+ transfer between H2Q and MNC during redox reactions which may further increase time constants.
| Temperature (°C) | Rs (Ω) | Cdl (mF) | Rct (Ω) | Rads (Ω) | Qms (F s(a2−1)) | a2 | Qps (F s(a3−1)) | a3 | τ0 (s) |
|---|---|---|---|---|---|---|---|---|---|
| −10 | 1.33 | 3.17 | 0.476 | 0.132 | 2.885 | 0.456 | 0.085 | 0.970 | 1.2 |
| 0 | 1.23 | 3.33 | 0.386 | 0.123 | 1.770 | 0.501 | 0.109 | 0.972 | 1.1 |
| 10 | 0.995 | 3.57 | 0.258 | 0.115 | 1.435 | 0.554 | 0.889 | 0.968 | 0.82 |
| 20 | 0.884 | 3.91 | 0.228 | 0.106 | 0.901 | 0.582 | 0.100 | 0.956 | 0.80 |
| 30 | 0.815 | 4.07 | 0.211 | 0.093 | 0.875 | 0.675 | 0.092 | 0.969 | 0.76 |
| 40 | 0.735 | 4.44 | 0.179 | 0.088 | 0.695 | 0.702 | 0.107 | 0.962 | 0.70 |
| 50 | 0.631 | 5.05 | 0.170 | 0.082 | 0.162 | 0.753 | 0.108 | 0.955 | 0.60 |
| Temperature (°C) | Rs (Ω) | Cdl (mF) | Rct (Ω) | Rads (Ω) | Qms (F s(a2−1)) | a2 | Qps (F s(a3−1)) | a3 | τ0 (s) |
|---|---|---|---|---|---|---|---|---|---|
| −10 | 1.47 | 0.70 | 0.262 | 0.381 | 2.57 | 0.308 | 0.414 | 0.958 | 5.8 |
| 0 | 1.27 | 1.11 | 0.254 | 0.372 | 1.66 | 0.315 | 0.309 | 0.957 | 4.1 |
| 10 | 1.01 | 1.32 | 0.219 | 0.331 | 1.43 | 0.345 | 0.414 | 0.959 | 4.0 |
| 20 | 0.916 | 1.42 | 0.131 | 0.237 | 1.41 | 0.364 | 0.425 | 0.957 | 3.8 |
| 30 | 0.845 | 1.46 | 0.121 | 0.175 | 1.07 | 0.387 | 0.417 | 0.960 | 3.3 |
| 40 | 0.713 | 1.62 | 0.071 | 0.166 | 0.860 | 0.465 | 0.452 | 0.961 | 3.0 |
| 50 | 0.631 | 1.81 | 0.062 | 0.158 | 0.680 | 0.534 | 0.423 | 0.953 | 2.5 |
The role of temperature in capacitance behaviour
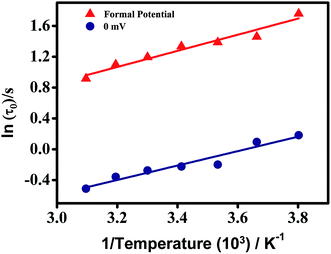
The temperature effect on the EIS at the two potentials was also investigated and the equivalent circuit parameters are mentioned in Tables 2 and 3 which showed considerable variations. The Rs values decreased with increasing temperature at both double layer potential and formation potential (Tables 2 and 3) since ionic mobility increases with increasing temperature. Similarly, Rct and Rads decreased with increasing temperature (Tables 2 and 3) since enhanced ionic mobility assist ion penetration inside the nanopores in the mid-frequency region which helps the charge/electron transfer process at the electrode/electrolyte interface (Rct) and adsorption of ions inside nanopores (Rads). In this context, these phenomena can be alternatively explained that with increasing temperature, viscosity decreases which helps the ions to move faster and thus lowering the resistances. Diffusion of ions inside the pores of the material is also assessed by observing the linear rise of imaginary component of impedance in the mid frequency range of Nyquist plots. The exponent factor “a2” associated with Qms decreases with decreasing temperature suggesting a higher resistive nature with decreasing temperature or an enhanced capacitive nature with increasing temperature (Tables 2 and 3). This observation was also due to increase of ionic mobility with increasing temperature. Furthermore, the dielectric relaxation constants (τ0) at both the potentials decreased with increasing temperature due to faster kinetics (Fig. 6e, f, Tables 2 and 3).The “τ0” is the supercapacitor factor of merit which provides the time required for delivering 50% of power and hence it captures different types of molecular or ionic interactions required to charge a supercapacitor. Undoubtedly, the most time consuming process or in other words kinetically most hindered process primarily dictates τ0 values. Since, time constant is inversely proportional to the rate constants, an Arrhenius type equation presented in eqn (5) can be considered.
 | (5) |
In eqn (5), A, Ea, R, and T represent pre-exponential factor, activation energy, universal gas constant and absolute temperature respectively. ln![[thin space (1/6-em)]](https://www.rsc.org/images/entities/char_2009.gif) τ0 vs. 1/T curves have been plotted at both double layer potential and formal potential in Fig. 8 and good linear fittings have been obtained. The activation barriers (Ea) were found to be 8.69 and 7.77 kJ mol−1 at formal potential and double layer potential respectively. These energy values are close to that of enthalpy changes related to weak H-bonds, and it can be speculated that at the double layer potential, there will be H-bond formation between the solvated ions as well which leads to 7.77 kJ mol−1 activation barrier. At the formal potential, there will be additional repeated breaking and formation of H-bonds between H2Q and the oxide groups of MNC and that contributes mainly to the activation barrier. These activation barrier values are close to that of previously reported for ion-hopping or proton hopping, i.e. Grotthuss mechanism.33,37,55 It is important to emphasize that even though the two activation energies obtained at two potentials are close to each other, still marginally higher activation energy at the formal potential presumably is a reflection of the potential-driven redox reaction wherein the repeated shuttling of the H+ between the –OH group of the H2Q units and the oxide sites of MNC increases the energy barrier.
τ0 vs. 1/T curves have been plotted at both double layer potential and formal potential in Fig. 8 and good linear fittings have been obtained. The activation barriers (Ea) were found to be 8.69 and 7.77 kJ mol−1 at formal potential and double layer potential respectively. These energy values are close to that of enthalpy changes related to weak H-bonds, and it can be speculated that at the double layer potential, there will be H-bond formation between the solvated ions as well which leads to 7.77 kJ mol−1 activation barrier. At the formal potential, there will be additional repeated breaking and formation of H-bonds between H2Q and the oxide groups of MNC and that contributes mainly to the activation barrier. These activation barrier values are close to that of previously reported for ion-hopping or proton hopping, i.e. Grotthuss mechanism.33,37,55 It is important to emphasize that even though the two activation energies obtained at two potentials are close to each other, still marginally higher activation energy at the formal potential presumably is a reflection of the potential-driven redox reaction wherein the repeated shuttling of the H+ between the –OH group of the H2Q units and the oxide sites of MNC increases the energy barrier.
Conclusion
In conclusion, the temperature dependence of a supercapacitor and its effect on electrode kinetics at double layer potential and formal potential has been investigated for a MNC-H2Q system. At a high temperature of 50 °C, a highest specific capacitance of 319 F g−1 has been exhibited by this system, which decreases to 213 F g−1 at a temperature of −10 °C. Electrochemical impedance spectroscopy reveals improved charge transfer and double layer capacitance upon increasing temperature at both the potentials. Moreover, the dielectric relaxation time constants (τ0) at different temperatures at the two potentials have also been determined and it unfolds an increase in their values upon lowering of temperature. The kinetic behaviour of the supercapacitor has been determined from Arrhenius type plots where ln![[thin space (1/6-em)]](https://www.rsc.org/images/entities/char_2009.gif) τ0 has been plotted vs. 1/T and from the slope, the activation energies have been determined and they were 8.69 and 7.77 kJ mol−1 at formal potential and double layer potential respectively. The higher activation energy at the formal potential was due to site to site electron hopping within the nanomaterial. The cyclic stability at room temperature and at an elevated temperature of 50 °C were 92% after 10
τ0 has been plotted vs. 1/T and from the slope, the activation energies have been determined and they were 8.69 and 7.77 kJ mol−1 at formal potential and double layer potential respectively. The higher activation energy at the formal potential was due to site to site electron hopping within the nanomaterial. The cyclic stability at room temperature and at an elevated temperature of 50 °C were 92% after 10![[thin space (1/6-em)]](https://www.rsc.org/images/entities/char_2009.gif) 000 cycles and 86% after 5000 cycles respectively, and thus revealing superior stability of the system. Finally, we speculate that the insights into the electrode processes at different potentials achieved herein utilizing electrochemical impedance spectroscopy may lead to opening up new pathways to optimize the working principle of supercapacitor devices.
000 cycles and 86% after 5000 cycles respectively, and thus revealing superior stability of the system. Finally, we speculate that the insights into the electrode processes at different potentials achieved herein utilizing electrochemical impedance spectroscopy may lead to opening up new pathways to optimize the working principle of supercapacitor devices.
Conflicts of interest
There are no conflicts to declare.Acknowledgements
A. P. acknowledges financial support from DST SERB New Delhi, (EMR/2016/005999), infrastructural support from IISER Bhopal, and the FIST supported TEM facility to the Dept. of Chemistry, IISER Bhopal. A. B. acknowledges CSIR, New Delhi for fellowship.References
- B. E. Conway, Electrochemical Supercapacitors: Scientific Fundamentals and Technological Applications, Springer, New York, 1999 Search PubMed.
- C. Liu, F. Li, L.-P. Ma and H.-M. Cheng, Advanced Materials for Energy Storage, Adv. Mater., 2010, 22, E28–E62 CrossRef CAS PubMed.
- G. Wang, L. Zhang and J. Zhang, A review of electrode materials for electrochemical supercapacitors, Chem. Soc. Rev., 2012, 41, 797–828 RSC.
- P. Simon and Y. Gogotsi, Materials for electrochemical capacitors, Nat. Mater., 2008, 7, 845 CrossRef CAS PubMed.
- V. Augustyn, P. Simon and B. Dunn, Pseudocapacitive oxide materials for high-rate electrochemical energy storage, Energy Environ. Sci., 2014, 7, 1597–1614 RSC.
- C. Costentin, T. R. Porter and J.-M. Savéant, How Do Pseudocapacitors Store Energy? Theoretical Analysis and Experimental Illustration, ACS Appl. Mater. Interfaces, 2017, 9, 8649–8658 CrossRef CAS PubMed.
- R. Kotz and M. Carlen, Principles and applications of electrochemical capacitors, Electrochim. Acta, 2000, 45, 2483–2498 CrossRef CAS.
- A. Burke, Ultracapacitors: why, how, and where is the technology, J. Power Sources, 2000, 91, 37–50 CrossRef CAS.
- R. A. Huggins, Supercapacitors and electrochemical pulse sources, Solid State Ionics, 2000, 134, 179–195 CrossRef CAS.
- L. T. Lam and R. Louey, Development of ultra-battery for hybrid-electric vehicle applications, J. Power Sources, 2006, 158, 1140–1148 CrossRef CAS.
- Y. J. Kim, C. M. Yang, K. C. Park, K. Kaneko, Y. A. Kim, M. Noguchi, T. Fujino, S. Oyama and M. Endo, Edge-Enriched, Porous Carbon-Based, High Energy Density Supercapacitors for Hybrid Electric Vehicles, ChemSusChem, 2012, 5, 535–541 CrossRef CAS PubMed.
- B. E. Conway, Transition from “Supercapacitor” to “Battery” Behavior in Electrochemical Energy Storage, J. Electrochem. Soc., 1991, 138, 1539–1548 CrossRef CAS.
- M. Winter and R. J. Brodd, What are batteries, fuel cells, and supercapacitors?, Chem. Rev., 2004, 104, 4245–4269 CrossRef CAS PubMed.
- C. Zhong, Y. D. Deng, W. B. Hu, J. L. Qiao, L. Zhang and J. J. Zhang, A review of electrolyte materials and compositions for electrochemical supercapacitors, Chem. Soc. Rev., 2015, 44, 7484–7539 RSC.
- K. L. Van Aken, M. Beidaghi and Y. Gogotsi, Formulation of Ionic-Liquid Electrolyte to Expand the Voltage Window of Supercapacitors, Angew. Chem., Int. Ed., 2015, 54, 4806–4809 CrossRef CAS PubMed.
- Y. D. Xia, Z. X. Yang and Y. Q. Zhu, Porous carbon-based materials for hydrogen storage: advancement and challenges, J. Mater. Chem. A, 2013, 1, 9365–9381 RSC.
- Z. B. Yang, J. Ren, Z. T. Zhang, X. L. Chen, G. Z. Guan, L. B. Qin, Y. Zhang and H. S. Peng, Recent Advancement of Nanostructured Carbon for Energy Applications, Chem. Rev., 2015, 115, 5159–5223 CrossRef CAS PubMed.
- D. Roy Chowdhury, C. Singh and A. Paul, Role of graphite precursor and sodium nitrate in graphite oxide synthesis, RSC Adv., 2014, 4, 15138–15145 RSC.
- C. Singh, A. K. Mishra and A. Paul, Highly conducting reduced graphene synthesis via low temperature chemically assisted exfoliation and energy storage application, J. Mater. Chem. A, 2015, 3, 18557–18563 RSC.
- C. Singh, S. Nikhil, A. Jana, A. K. Mishra and A. Paul, Proton conduction through oxygen functionalized few-layer graphene, Chem. Commun., 2016, 52, 12661–12664 RSC.
- Y. Zhai, Y. Dou, D. Zhao, P. F. Fulvio, R. T. Mayes and S. Dai, Carbon Materials for Chemical Capacitive Energy Storage, Adv. Mater., 2011, 23, 4828–4850 CrossRef CAS PubMed.
- M. Biswal, A. Banerjee, M. Deo and S. Ogale, From dead leaves to high energy density supercapacitors, Energy Environ. Sci., 2013, 6, 1249–1259 RSC.
- J. Pokrzywinski, J. K. Keum, R. E. Ruther, E. C. Self, M. F. Chi, H. Meyer, K. C. Littrell, D. Aulakh, S. Marble, J. Ding, M. Wriedt, J. Nanda and D. Mitlin, Unrivaled combination of surface area and pore volume in micelle-templated carbon for supercapacitor energy storage, J. Mater. Chem. A, 2017, 5, 13511–13525 RSC.
- J. C. Wang and S. Kaskel, KOH activation of carbon-based materials for energy storage, J. Mater. Chem., 2012, 22, 23710–23725 RSC.
- M. A. Lillo-Rodenas, J. Juan-Juan, D. Cazorla-Amoros and A. Linares-Solano, About reactions occurring during chemical activation with hydroxides, Carbon, 2004, 42, 1371–1375 CrossRef CAS.
- C. Singh and A. Paul, Immense Microporous Carbon@Hydroquinone Metamorphosed from Nonporous Carbon as a Supercapacitor with Remarkable Energy Density and Cyclic Stability, ACS Sustainable Chem. Eng., 2018, 6, 11367–11379 CrossRef CAS.
- P. Liu, M. Verbrugge and S. Soukiazian, Influence of temperature and electrolyte on the performance of activated-carbon supercapacitors, J. Power Sources, 2006, 156, 712–718 CrossRef CAS.
- K. S. Hung, C. Masarapu, T. H. Ko and B. Q. Wei, Wide-temperature range operation supercapacitors from nanostructured activated carbon fabric, J. Power Sources, 2009, 193, 944–949 CrossRef CAS.
- J. Kang, S. H. Jayaram, J. Rawlins and J. Wen, Characterization of thermal behaviors of electrochemical double layer capacitors (EDLCs) with aqueous and organic electrolytes, Electrochim. Acta, 2014, 144, 200–210 CrossRef CAS.
- J. Kang, S. Atashin, S. H. Jayaram and J. Z. Wen, Frequency and temperature dependent electrochemical characteristics of carbon-based electrodes made of commercialized activated carbon, graphene and single-walled carbon nanotube, Carbon, 2017, 111, 338–349 CrossRef CAS.
- R. Y. Lin, P. L. Taberna, S. Fantini, V. Presser, C. R. Perez, F. Malbosc, N. L. Rupesinghe, K. B. K. Teo, Y. Gogotsi and P. Simon, Capacitive Energy Storage from -50 to 100 degrees C Using an Ionic Liquid Electrolyte, J. Phys. Chem. Lett., 2011, 2, 2396–2401 CrossRef CAS.
- C. Masarapu, H. F. Zeng, K. H. Hung and B. Q. Wei, Effect of Temperature on the Capacitance of Carbon Nanotube Supercapacitors, ACS Nano, 2009, 3, 2199–2206 CrossRef CAS PubMed.
- C. G. Liu, Z. N. Yu, D. Neff, A. Zhamu and B. Z. Jang, Graphene-Based Supercapacitor with an Ultrahigh Energy Density, Nano Lett., 2010, 10, 4863–4868 CrossRef CAS PubMed.
- W. W. Liu, X. B. Yan, J. W. Lang and Q. J. Xue, Effects of concentration and temperature of EMIMBF4/acetonitrile electrolyte on the supercapacitive behavior of graphene nanosheets, J. Mater. Chem., 2012, 22, 8853–8861 RSC.
- W. Y. Tsai, R. Y. Lin, S. Murali, L. L. Zhang, J. K. McDonough, R. S. Ruoff, P. L. Taberna, Y. Gogotsi and P. Simon, Outstanding performance of activated graphene based supercapacitors in ionic liquid electrolyte from -50 to 80 °C, Nano Energy, 2013, 2, 403–411 CrossRef CAS.
- R. Vellacheri, A. Al-Haddad, H. P. Zhao, W. X. Wang, C. L. Wang and Y. Lei, High performance supercapacitor for efficient energy storage under extreme environmental temperatures, Nano Energy, 2014, 8, 231–237 CrossRef CAS.
- S. K. Kim, H. J. Kim, J. C. Lee, P. V. Braun and H. S. Park, Extremely Durable, Flexible Supercapacitors with Greatly Improved Performance at High Temperatures, ACS Nano, 2015, 9, 8569–8577 CrossRef CAS PubMed.
- X. R. Liu and P. G. Pickup, Performance and low temperature behaviour of hydrous ruthenium oxide supercapacitors with improved power densities, Energy Environ. Sci., 2008, 1, 494–500 CAS.
- J. A. Yan, E. Khoo, A. Sumboja and P. S. Lee, Facile Coating of Manganese Oxide on Tin Oxide Nanowires with High-Performance Capacitive Behavior, ACS Nano, 2010, 4, 4247–4255 CrossRef CAS PubMed.
- A. J. Roberts, A. F. D. de Namor and R. C. T. Slade, Low temperature water based electrolytes for MnO2/carbon supercapacitors, Phys. Chem. Chem. Phys., 2013, 15, 3518–3526 RSC.
- J. G. Wang, Y. Yang, Z. H. Huang and F. Y. Kang, Effect of temperature on the pseudo-capacitive behavior of freestanding MnO2@carbon nanofibers composites electrodes in mild electrolyte, J. Power Sources, 2013, 224, 86–92 CrossRef CAS.
- L. H. Su, L. Y. Gong, H. T. Lu and Q. Xu, Enhanced low-temperature capacitance of MnO2 nanorods in a redox-active electrolyte, J. Power Sources, 2014, 248, 212–217 CrossRef CAS.
- W. Y. Li, K. B. Xu, L. An, F. R. Jiang, X. Y. Zhou, J. M. Yang, Z. G. Chen, R. J. Zou and J. Q. Hu, Effect of temperature on the performance of ultrafine MnO2 nanobelt supercapacitors, J. Mater. Chem. A, 2014, 2, 1443–1447 RSC.
- X. Zheng, X. Q. Yan, Y. H. Sun, Y. S. Yu, G. J. Zhang, Y. W. Shen, Q. J. Liang, Q. L. Liao and Y. Zhang, Temperature-dependent electrochemical capacitive performance of the alpha-Fe2O3 hollow nanoshuttles as supercapacitor electrodes, J. Colloid Interface Sci., 2016, 466, 291–296 CrossRef CAS PubMed.
- M. Miah, S. Bhattacharya, D. Dinda and S. K. Saha, Temperature dependent supercapacitive performance in La2O3 nano sheet decorated reduce graphene oxide, Electrochim. Acta, 2018, 260, 449–458 CrossRef CAS.
- R. Kotz, M. Hahn and R. Gallay, Temperature behavior and impedance fundamentals of supercapacitors, J. Power Sources, 2006, 154, 550–555 CrossRef.
- G. E. Cabaniss, A. A. Diamantis, W. R. Murphy, R. W. Linton and T. J. Meyer, Electrocatalysis of Proton-Coupled Electron-Transfer Reactions at Glassy-Carbon Electrodes, J. Am. Chem. Soc., 1985, 107, 1845–1853 CrossRef CAS.
- C. Singh and A. Paul, Physisorbed Hydroquinone on Activated Charcoal as a Supercapacitor: An Application of Proton-Coupled Electron Transfer, J. Phys. Chem. C, 2015, 119, 11382–11390 CrossRef CAS.
- P. L. Taberna, P. Simon and J. F. Fauvarque, Electrochemical characteristics and impedance spectroscopy studies of carbon-carbon supercapacitors, J. Electrochem. Soc., 2003, 150, A292–A300 CrossRef CAS.
- S. Suresh, V. C. Srivastava and I. M. Mishra, Isotherm, Thermodynamics, Desorption, and Disposal Study for the Adsorption of Catechol and Resorcinol onto Granular Activated Carbon, J. Chem. Eng. Data, 2011, 56, 811–818 CrossRef CAS.
- J. Zhang, H. Gao, Q. Yang, X. T. Zhang, M. Y. Zhang and L. L. Xu, Effect of temperature on pseudocapacitance performance of carbon fiber@NiCo2O4@Ni(OH)2 core–shell nanowire array composite electrodes, Appl. Surf. Sci., 2015, 356, 167–172 CrossRef CAS.
- A. Muthusamy and A. Paul, Importance of Electrode Preparation Methodologies in Supercapacitor Applications, ACS Omega, 2017, 2, 8039–8050 CrossRef PubMed.
- P. Jash and A. Paul, Selective Synthesis of Single Layer Translucent Cobalt Hydroxide for efficient oxygen evolution reaction, Chem. Commun., 2019, 55, 3837 RSC.
- V. F. Lvovich, Impedance Spectroscopy: Applications to Electrochemical and Dielectric Phenomena, John Wiley & Sons, 2012 Search PubMed.
- S. F. Bureiko and G. S. Denisov, Dynamics of molecular hydrogen exchange in hydrogen-bonded systems, Pol. J. Chem., 2002, 76, 1177–1190 CAS.
Footnote |
| † Electronic supplementary information (ESI) available. See DOI: 10.1039/c9ra09768f |
| This journal is © The Royal Society of Chemistry 2020 |

