
 Open Access Article
 This Open Access Article is licensed under a
 Creative Commons Attribution 3.0 Unported Licence
Identification of blood-activating components from Xueshuan Xinmaining Tablet based on the spectrum–effect relationship and network pharmacology analysis
Jing Tana,
Junli Liua,
Han Wanga,
Ying Zhangac,
Hongqiang Lina,
Zhongyao Wanga,
Hanrui Sia,
Yutong Zhanga,
Jinping Liu *ab,
Pingya Li*ab and
Kai Sun*a
*ab,
Pingya Li*ab and
Kai Sun*a
aSchool of Pharmaceutical Sciences, Jilin University, Fujin Road 1266, Changchun 130021, Jilin, China. E-mail: liujp@jlu.edu.cn; lipy@jlu.edu.cn; thomassk@jlu.edu.cn; Tel: +86-431-85619803
bResearch Center of Natural Drug, Jilin University, Changchun 130021, China
cThe First Hospital of Jilin University, Changchun 130021, Jilin, China
First published on 10th March 2020
Abstract
With the aim of identifying the active components of Xueshuan Xinmaining Tablet (XXT) and discussing the potential mechanism involved, the relationship between HPLC fingerprints and its blood-activating effect were established by multivariate statistical analysis, including gray relational analysis (GRA) and partial least squares regression analysis (PLSR). Network pharmacology was used to predict the potential mechanism based on the identified active components. GRA and PLSR analysis showed close correlation between the HPLC fingerprints and blood-activating activity, and peaks P1, P3, P11, P15, P22, P34, P36, P38 and P39 might be potential anti-blood stasis components of XXT. The pharmacological verification showed that salvianic acid A (P1), rutin (P3), ginsenoside Rg1 (P11) and Rb1 (P22), cinobufagin (P36), and tanshinone I (P38) and IIA (P39) had significant blood-activating effects. Based on these seven active compounds, network pharmacology analysis indicated that the anti-blood stasis effect of XXT might be closely related to TNF, PI3K-Akt and NF-κB signaling pathways. The spectrum–effect relationship of XXT was successfully established in this study. The blood-activating components and the anti-blood stasis mechanism were revealed and predicted. These findings could also be beneficial for an exploration of the active components of TCM.
1 Introduction
Xueshuan Xinmaining Tablet (XXT), a Chinese traditional compound medicine composed of ten herbs, possesses the activities of promoting blood circulation and removing blood stasis.1 It is recorded in the Chinese Pharmacopoeia (2015 edition) and has been clinically applied for the treatment of cerebral thrombosis and coronary heart disease for at least fifteen years.2,3 In our previous studies, we have reported that XXT could treat blood stasis through regulating related genes and proteins or endogenous metabolite pathways.1,4,5 The multi-target mechanism is closely related to the variation in the chemical components contained. We have reported the comprehensive component screening of XXT based on UPLC/Q-TOF-MS. The results showed that XXT was rich in chemical constituents of different structural types.6 Additionally, the contents of salvianolic acid B, rutin, ferulic acid, and ginsenoside Re and Rg1 were determined in the national standard of XXT. However, whether these ingredients are the blood-activating substances is not quite certain.Fingerprints are widely recognized as a quality control method worldwide.7,8 The World Health Organization (WHO, 2007) has approved the use of fingerprints to evaluate the quality of natural drugs or traditional Chinese medicine (TCM). Fingerprints, with the advantages of convenience and a large amount of information, could systematically mark the chemical composition of TCM.9 The UPLC-PDA fingerprint of XXT, marked with 28 common peaks in 280 nm, has been established to assess the quality consistency of XXT.10 However, the fingerprints only focused on the chemical characteristics, but gave little information about the components' therapeutic effects. The components in XXT related to the anti-blood stasis effect have not been identified.
The spectrum–effect relationship was established by linking the peaks in the fingerprints of TCM with specific bioactivity to screen the active components in TCM.11 Multivariate statistical methods, including partial least squares regression analysis (PLSR) and gray relational analysis (GRA), have been commonly applied to analyze the regression coefficients, variable importance in projection (VIP) contribution, and their correlation.12–14 As a result, the active compounds closely related to a specific effect could be effectively screened for further pharmacological activity evaluation in vitro or in vivo.
With the development of bioinformatics, network pharmacology, as a more comprehensive approach for integrating compound–target–pathway interactions from a molecular to a systematic level, is evolving as a Frontier research field in drug discovery and development. The boom in network pharmacology has prompted more researchers to elucidate the possible mechanisms of natural products in recent years.15,16
In this study, the blood-activating components in XXT were predicted by analysis of the spectrum–effect relationship for the chemical characteristic peaks and the anti-blood stasis effect. In view of the uniqueness of the manufacturer, and the good similarity and stability of chemical components in the XXT fingerprint,10 ten different polar solvent extracts of XXT were used to establish HPLC fingerprints. Then, a pharmacological test in vitro was performed to verify the predicted results. Finally, the possible targets and signaling pathways of the blood-activating components were predicted by network pharmacology. This study identified the anti-blood stasis components in XXT, which could be beneficial for the quality control of XXT and the exploration of blood-activating components.
2 Experiments
2.1 Instruments, materials, and animals
2.2 HPLC fingerprints
2.2.2.1 Reference standard solutions. Certain amounts of salvianolic acid B, salvianic acid A, rutin, quercetin, ginsenoside Rg1, -Re, -Rf, -Rb1, -Rg3, -Rh1, -Rc, -Rg2, -F1, -Rb2, -Rb3, -Rd, -F2, cholic acid, cinobufagin, resibufogenin, tanshinone I and tanshinone IIA were dissolved in methanol to obtain the mixed reference standards solutions (the concentration of each reference standard was 0.1 mg mL−1).
2.2.2.2 Sample solutions. The pulverized XXT sample was sieved (Chinese National Standard Sieve No. 3, R40/3 series) to obtain a homogeneous powder. Then each fine powder was accurately weighed (50 g). Each powder was extracted respectively with different polarity solvents {S1: n-butanol; S2: methanol; S3: methanol–dichloro (1
![[thin space (1/6-em)]](https://www.rsc.org/images/entities/char_2009.gif) :1); S4: 70% methanol; S5: ethanol–acetone (1:1); S6: ethyl acetate; S7: ethanol–ethyl acetate (1:1); S8: ethanol; S9: methanol–acetone (1:1); S10: 50% acetone} in an ultrasonic bath at 40 °C three times (1 h each time). After being filtered, the extraction solutions were combined, concentrated, and evaporated to dryness. The desiccated extracts were then respectively dissolved in methanol to obtain the solutions (each was 20 mg mL−1), mixed well, and filtered (0.45 μm).
:1); S4: 70% methanol; S5: ethanol–acetone (1:1); S6: ethyl acetate; S7: ethanol–ethyl acetate (1:1); S8: ethanol; S9: methanol–acetone (1:1); S10: 50% acetone} in an ultrasonic bath at 40 °C three times (1 h each time). After being filtered, the extraction solutions were combined, concentrated, and evaporated to dryness. The desiccated extracts were then respectively dissolved in methanol to obtain the solutions (each was 20 mg mL−1), mixed well, and filtered (0.45 μm).
2.2.4.1 SA. Each sample solution (S1–S10) and the reference standard solutions were injected into the HPLC. Chromatograms showing the retention time (tR) and the peak area (PA) were obtained. According to the Similarity Evaluation System for Chromatographic Fingerprint of TCM (version 2012A; Beijing, China), the fingerprints were automatically matched and established.17 Chromatograms of S1–S10 samples, including PA and tR, were put into the Analytical Instrument Association (AIA) form (*.cdf). Subsequently, a reference fingerprint was automatically generated by comparing S1–S10 samples based on the median method, and the similarity (SA) between the chromatogram of the reference fingerprint and each sample chromatogram was calculated with the software.
2.2.4.2 HCA. Hierarchical cluster analysis (HCA), a multivariate statistical analysis technique to measure dissimilarity or similarity, is commonly used to sort samples into clusters.18 The common PAs of the samples were used as features, and the HCA of the S1–S10 samples was established from the squared Euclidean distance (metric) and the between-groups linkage method (the amalgamation rule) with SPSS statistics software (SPSS 19.0, SPSS Inc., Chicago, IL, USA).19
2.3 Blood-activating experiments
On the night of day 7, all the rats were fasted for 12 h, but water was allowed. On day 8, 30 min after administration, the rats were anesthetized by an intraperitoneal injection of 10% chloral hydrate (3 mL kg−1). Blood was drawn from the abdominal aorta and was kept in tubes containing heparin sodium (20 U mL−1). Some of the whole blood was used to measure the whole blood viscosity (WBV). The WBV was determined (at shear rates of 10, 60, and 120/s) at 37 °C. Plasma, used to determine PV, TT, PT, APTT, and FIB, was obtained from the remaining whole blood by centrifugation at 3000 rpm for 10 min. PV was measured at a shear rate of 120/s. TT, PT, APTT, and FIB were determined with an SC 40 (LG-PABER-I) coagulation analyzer with commercial kits, in accordance with the manufacturers' instructions. The calibration curves of PT (x) and solidification time (y), FIB (x) and solidification time (y) were established. TT was tested by incubating 100 μL of plasma at 37 °C for 3 min, followed by the addition of 100 μL of thrombin agent. PT was examined by incubating 50 μL of plasma for 3 min at 37 °C, followed by the addition of 100 μL of thromboplastin agent. APTT was evaluated by incubating 50 μL of plasma with 50 μL pf APTT-activating agents for 3 min at 37 °C, followed by the addition of 50 μL of CaCl2. FIB was assessed by incubating 10 μL of plasma with 90 μL of imidazole buffer at 37 °C for 3 min, followed by the addition of 50 μL of FIB agent. All hemorheological indexes and coagulation function indexes were determined within 3 h after blood collection.
2.4 Spectrum–effect relationship analysis
2.5 Pharmacological test
The predicted components related to the blood-activating activity of XXT were identified with reference standards. The anticoagulant activity of the predicted components of different concentrations (10, 20, and 40 μM) on normal rat plasma was determined by the method described in Section 2.3.3.33,34 The bioactive components were finally screened out with this in vitro test.2.6 Network pharmacology
Network pharmacology, an application of systems biology, is applied to predict the complex mechanism of action of TCM formulas.14,35 It could be used to construct an entire drug–target interaction network and to predict the core targets and pathways involved. It is more efficient to clarify how multiple components interact with core targets by intersecting with the disease target database. In this study, the aforementioned screened active components were used as “candidate compounds” for network pharmacological analysis. The interaction network between active components and a blood stasis related target was then presented, and the potential involved pathways were also predicted.2.6.1.1 The compound–target network. To collect the targets of the active components, some databases, such as TCMSP (http://lsp.nwsuaf.edu.cn/tcmsp.php), SymMap (http://www.symmap.org), TCM-MeSH (http://mesh.tcm.microbioinformatics.org/), ETCM (http://www.nrc.ac.cn:9090/ETCM/), and BATMAN–TCM (http://bionet.ncpsb.org/batman-tcm), were used. The active component–target interaction map was then generated with Cytoscape 3.6.0 software (http://www.cytoscape.org/).
2.6.1.2 The target–target network. Blood stasis-associated target proteins were collected by using “blood stasis”, “coagulation of blood”, “blood clotting”, “blood viscosity”, “blood rheology”, “blood thickening”, “thrombus”, “thrombosis”, “thrombophilia”, “thromboembolism”, “venous thrombosis”, “cerebral thrombosis”, and “thromboses” as the keywords for a search in the OMIM database (http://omim.org/), DisGeNET database (http://www.disgenet.org/), and the PharmGKB database (http://geneticassociationdb.nih.gov/). By intersecting with the targets of screened compounds, the core targets were then obtained. The protein–protein interaction (PPI) network was constructed with the STRING database (String, https://string-db.org/).
2.6.2.1 GO. We enriched the overexpressed GO (gene ontology) terms of the obtained target networks. The gene symbol IDs of the core targets were transformed to gene ensemble IDs by using the Ensembl database (https://asia.ensembl.org/). Gene ensemble ID files were then uploaded to the OmicShare database (https://www.omicshare.com/) for GO enrichment analysis.
2.6.2.2 KEGG. The target-enriched disease pathways were obtained by Kyoto Encyclopedia of Genes and Genomes (KEGG) pathway enrichment analysis of core targets using the DAVID database (https://david.ncifcrf.gov/). The OmicShare database (http://omicshare.com/) was used to visualize the result.
3 Results
3.1 Results of HPLC fingerprints
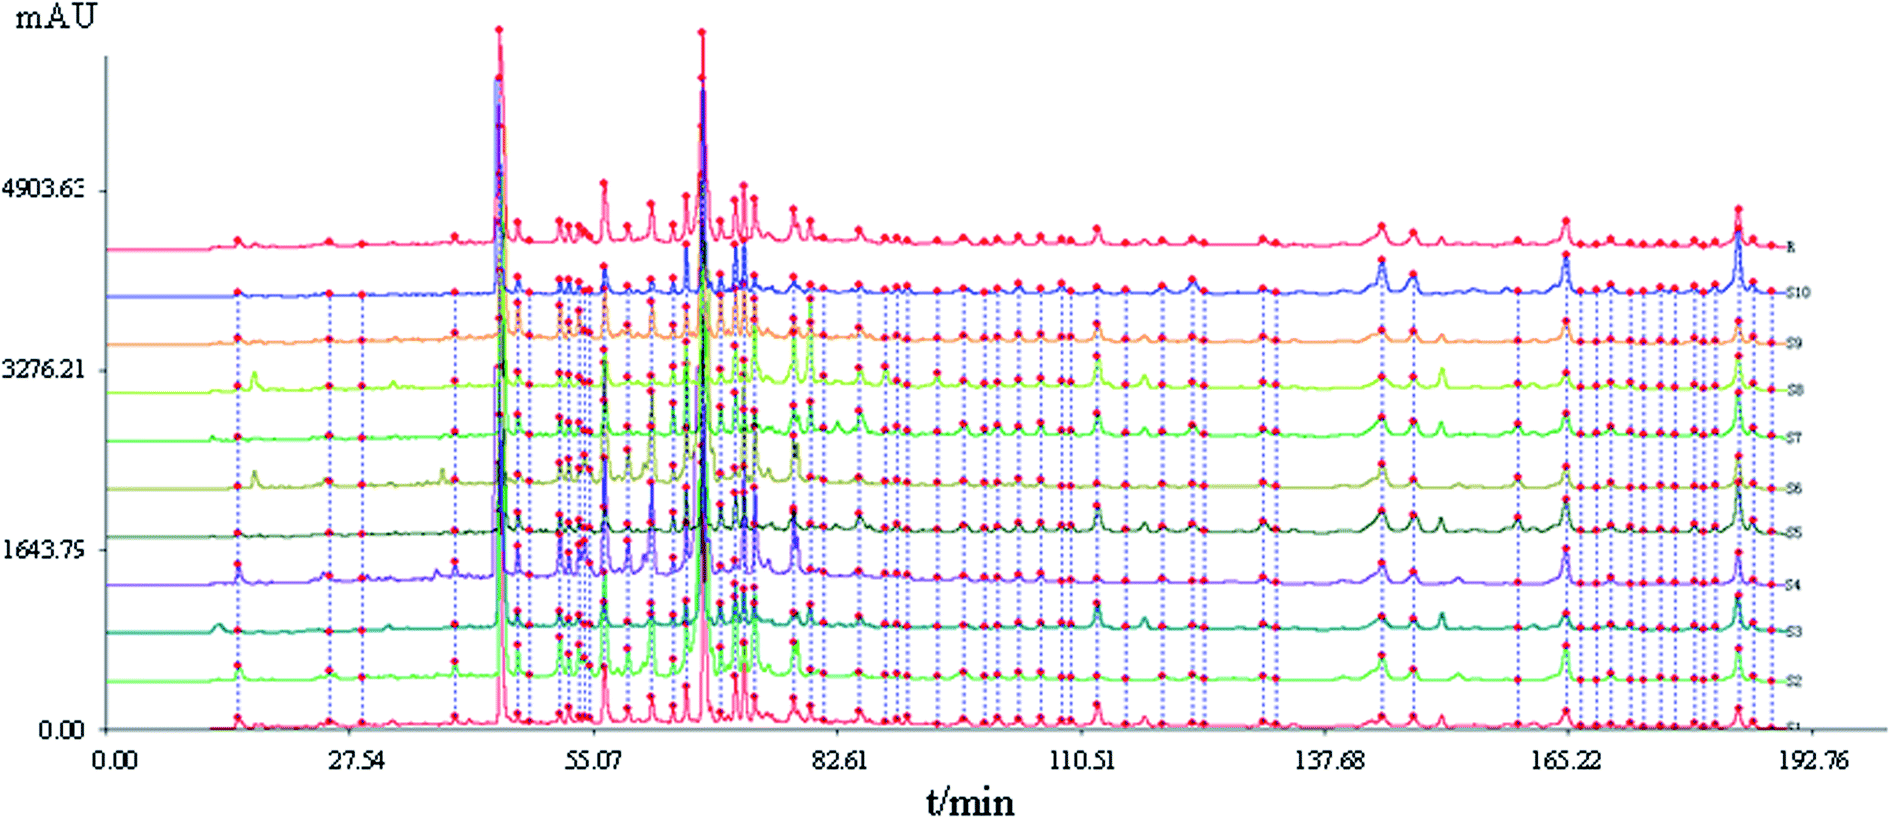 | ||
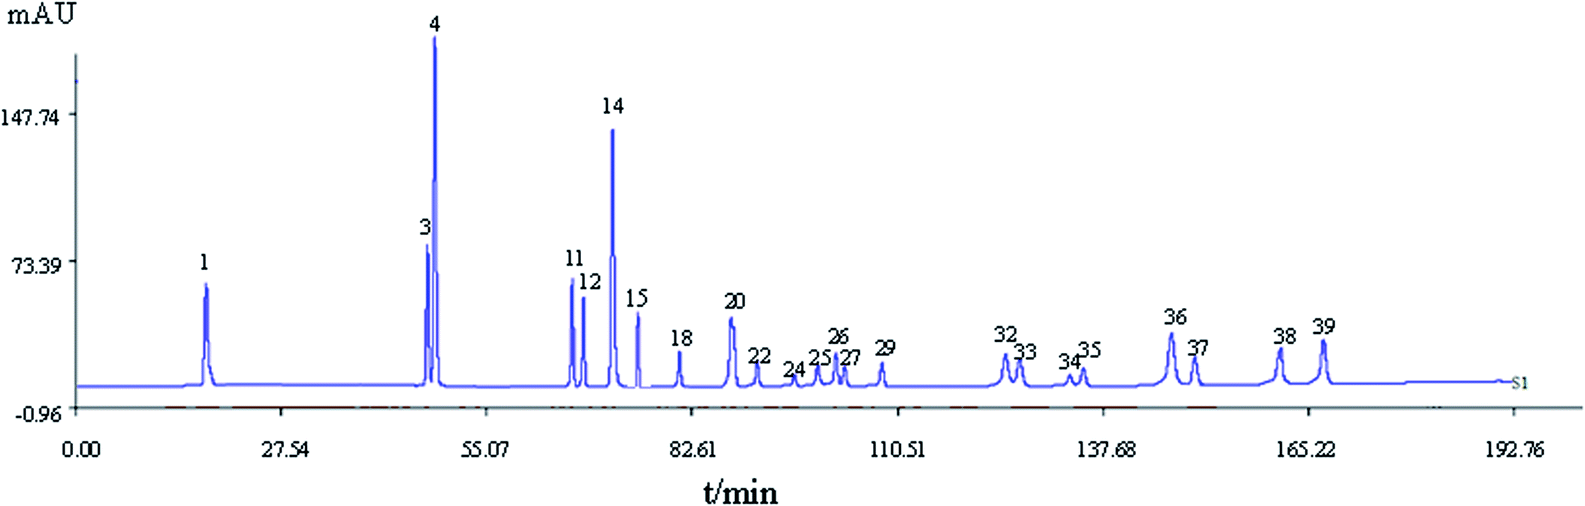
| Fig. 1 HPLC fingerprints of samples S1–S10 of Xueshuan Xinmaining Tablet (XXT). (S1–S10: 10 kinds of extract with different polar solvents; R: the reference fingerprint). | ||
 | ||
| Fig. 2 The reference fingerprint of XXT. | ||
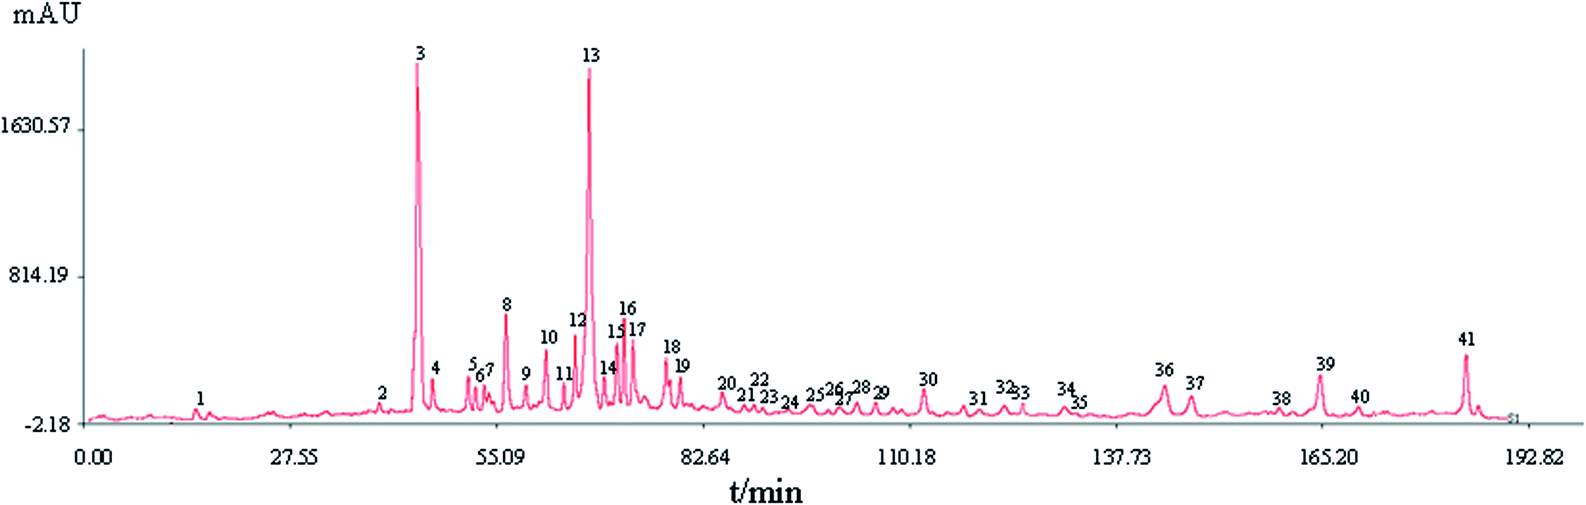
A total of 41 peaks with good segregation and PA greater than 1000000 were selected as the “common peaks” from consecutive peaks. Rutin (Peak 3), identified by comparison with reference standards with tR at 44.4 min, was selected as the reference peak to calculate the relative tR and relative PA of the other 40 common peaks. In accordance with the mixed reference standard HPLC spectrum shown in Fig. 3, 23 characteristic peaks, P1, P3, P4, P11, P12, P14, P18, P20, P22, P24, P25, P26, P27, P29, P32, P33, P15, P34, P35, P36, P37, P38, and P39, were identified as salvianic acid A, rutin, quercetin, ginsenoside Rg1, -Re, -Rf, -Rh1, -Rg2, -Rb1, -Rc, -Rb2, -Rb3, -Rd, -Rg3, -F2, -Rh2, salvianolic acid B, cholic acid, hyodeoxycholic acid, cinobufagin, resibufogenin, tanshinone I, and tanshinone IIA, respectively. The variance coefficients for almost all common peaks were greater than 35%. This is due to the diversity in the contents of constituents contained in different samples extracted with different polar solvents.
 | ||
| Fig. 3 The HPLC spectrum of a mixed standard reference. 1: salvianic aid A; 3: rutin; 4: quercetin; 11, 12, 14, 18, 20, 22, 24, 25, 26, 27, 29, 32, 33: ginsenoside Rg1, -Re, -Rf, -Rh1, -Rg2, -Rb1, -Rc, -Rb2, -Rb3, -Rd, -Rg3, -F2, -Rh2; 15: salvianolic acid B; 34: cholic acid; 35: hyodeoxycholic acid; 36: cinobufagin; 37: resibufogenin; 38: tanshinone I; 39: tanshinone IIA. | ||
3.1.2.1 SA. The similarity values between the entire chromatogram of the S1–S10 samples and the reference fingerprint were assessed, and their correlation coefficients were 0.948, 0.904, 0.986, 0.917, 0.974, 0.815, 0.986, 0.955, 0.987, and 0.963, respectively.
3.1.2.2 HCA. To further evaluate the results of the similarity analysis, HCA was performed. As shown in Fig. 4, the S1–S10 samples were obviously separated into two main clusters: S5, S7, S13, S9, and S8 in cluster I, and the other samples in cluster II. Cluster II was further separated into two subgroups: subgroup A (S6) and subgroup B (S2, S4, S1). The results demonstrated that the chemical components varied from S1 to S10, which was confirmed by the similarity analysis.
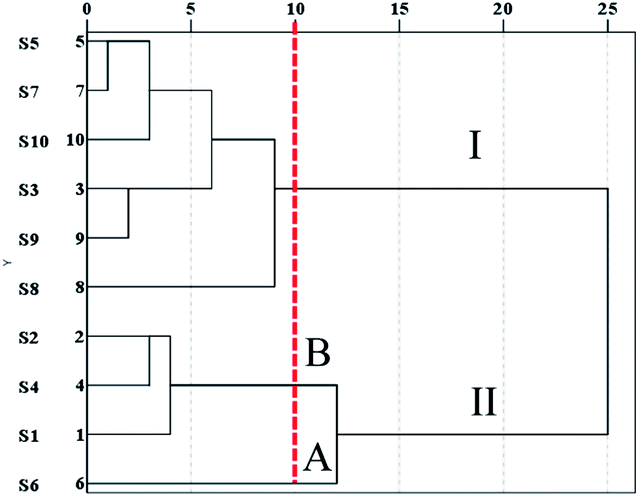 | ||
| Fig. 4 Hierarchical clustering analysis of XXT samples. | ||
3.2 Results of blood-activating activity
The effects of S1–S10 on WBV, PV, TT, APTT, PT, and FIB are shown in Table 1.| Group | WBV (mPa s; expressed at high, medium and low shear rates) | PV (mPa s; 120/s) | PT (INR) | TT (s) | APTT (s) | FIB (g L−1) | ||
|---|---|---|---|---|---|---|---|---|
| 10/s | 60/s | 120/s | ||||||
a Note: the data represent ![[x with combining macron]](https://www.rsc.org/images/entities/i_char_0078_0304.gif) ± s; compared with the M group, *p < 0.05; **p < 0.01. Compared with the N group, #p < 0.05; ##p < 0.01. ± s; compared with the M group, *p < 0.05; **p < 0.01. Compared with the N group, #p < 0.05; ##p < 0.01. |
||||||||
| N | 6.9 ± 0.9 | 5.6 ± 0.4 | 4.8 ± 0.4 | 1.27 ± 0.08 | 27 ± 2 | 41 ± 3 | 22 ± 2 | 1.7 ± 0.8 |
| M | 8.0 ± 0.5## | 6.1 ± 0.4# | 5.6 ± 0.4# | 1.8 ± 0.3## | 24.1 ± 0.7## | 35 ± 1## | 18.3 ± 1.0## | 3.7 ± 0.5## |
| BCN | 7.0 ± 0.4** | 5.4 ± 0.5** | 5.0 ± 0.4* | 1.4 ± 0.2** | 26.2 ± 0.7** | 40 ± 1** | 20 ± 2** | 2.4 ± 0.8* |
| S1 | 7.6 ± 0.4 | 5.6 ± 0.4* | 5.2 ± 0.4* | 1.51 ± 0.07* | 23.8 ± 0.8 | 36.2 ± 0.2 | 18.6 ± 0.3 | 2.2 ± 0.8** |
| S2 | 7.3 ± 0.8* | 5.6 ± 0.5* | 5.2 ± 0.5* | 1.4 ± 0.4* | 24.8 ± 0.7* | 38 ± 1** | 20.1 ± 0.6** | 2.1 ± 0.8** |
| S3 | 7.2 ± 0.5** | 5.7 ± 0.4 | 4.9 ± 0.5** | 1.4 ± 0.5* | 25.1 ± 0.8* | 38 ± 1** | 20 ± 2** | 2.9 ± 0.8* |
| S4 | 6.8 ± 0.4** | 5.4 ± 0.4** | 4.9 ± 0.4** | 1.3 ± 0.3** | 26.7 ± 0.7** | 41 ± 1** | 21 ± 1** | 2.0 ± 0.8** |
| S5 | 6.9 ± 0.4** | 5.5 ± 0.5* | 5.0 ± 0.4** | 1.4 ± 0.4* | 26.3 ± 0.7** | 40 ± 1** | 20 ± 2* | 2.0 ± 0.8** |
| S6 | 7.3 ± 0.6** | 5.7 ± 0.3 | 5.2 ± 0.2* | 1.5 ± 0.3* | 24.9 ± 0.7* | 38 ± 1** | 18.8 ± 0.6* | 2.1 ± 0.8** |
| S7 | 6.9 ± 0.5** | 5.4 ± 0.5** | 5.0 ± 0.5** | 1.3 ± 0.3** | 26.2 ± 0.6** | 40 ± 1** | 21.0 ± 0.6** | 2.0 ± 0.8** |
| S8 | 7.1 ± 0.3** | 5.7 ± 0.3* | 5.2 ± 0.3* | 1.4 ± 0.3** | 25.3 ± 0.8** | 39 ± 1** | 21 ± 2** | 2.1 ± 0.8** |
| S9 | 7.3 ± 0.6** | 5.7 ± 0.6 | 5.2 ± 0.5 | 1.4 ± 0.1** | 25.0 ± 0.7* | 38 ± 1** | 21 ± 1** | 2.1 ± 0.8** |
| S10 | 7.3 ± 0.5** | 5.7 ± 0.7 | 5.1 ± 0.5* | 1.4 ± 0.3* | 24.9 ± 0.7* | 38 ± 1** | 20 ± 2** | 2.1 ± 0.8** |
The levels of WBV (10, 60, and 120/s) and PV of the M group were significantly increased compared with the N group (p < 0.05, p < 0.01). While the levels of WBV and PV of the S1–S10 groups were notably lower than those of the M group (p < 0.05, p < 0.01). The S4 and S7 groups exhibited the best effect on both indexes (p < 0.01). The BCN group could significantly reduce PV and the low, medium and high share rates of WBV (p < 0.05, p < 0.01).
In the model rats, TT and APTT were significantly shortened (p < 0.01), the content of PT was prominently decreased (p < 0.01), and the level of FIB was significantly increased (p < 0.01). TT and APTT were remarkably prolonged, the content of PT was significantly increased, and the contents of FIB were considerably reduced in the S1–S10 groups as well as in the BCN group (p < 0.05, p < 0.01).
It was demonstrated that different batches of XXT samples exhibited a noticeable blood-activating effect on the acute blood stasis model rats. However, considerable differences in the levels of WBV (10/s) and APTT between different batches of XXT samples were found by the ANOVA analysis, which revealed that the contents of active components in each kind of XXT extract were different to some extent.
3.3 Spectrum–effect relationship analysis
| Peak no. | WBV (mPa s−1; 10/s) | APTT (s) | Peak no. | WBV (mPa s−1; 10/s) | APTT (s) | Peak no. | WBV (mPa s−1; 10/s) | APTT (s) |
|---|---|---|---|---|---|---|---|---|
| 1 | 0.82 | 0.84 | 15 | 0.81 | 0.82 | 29 | 0.78 | 0.80 |
| 2 | 0.70 | 0.69 | 16 | 0.73 | 0.72 | 30 | 0.68 | 0.68 |
| 3 | 0.80 | 0.81 | 17 | 0.67 | 0.67 | 31 | 0.78 | 0.79 |
| 4 | 0.76 | 0.77 | 18 | 0.78 | 0.77 | 32 | 0.69 | 0.70 |
| 5 | 0.76 | 0.76 | 19 | 0.72 | 0.74 | 33 | 0.77 | 0.77 |
| 6 | 0.80 | 0.78 | 20 | 0.75 | 0.75 | 34 | 0.83 | 0.84 |
| 7 | 0.71 | 0.71 | 21 | 0.72 | 0.72 | 35 | 0.72 | 0.74 |
| 8 | 0.68 | 0.69 | 22 | 0.81 | 0.81 | 36 | 0.80 | 0.82 |
| 9 | 0.72 | 0.70 | 23 | 0.74 | 0.73 | 37 | 0.79 | 0.79 |
| 10 | 0.62 | 0.62 | 24 | 0.68 | 0.68 | 38 | 0.82 | 0.84 |
| 11 | 0.81 | 0.80 | 25 | 0.74 | 0.74 | 39 | 0.79 | 0.80 |
| 12 | 0.79 | 0.80 | 26 | 0.72 | 0.74 | 40 | 0.78 | 0.79 |
| 13 | 0.74 | 0.74 | 27 | 0.82 | 0.81 | 41 | 0.80 | 0.81 |
| 14 | 0.78 | 0.79 | 28 | 0.81 | 0.84 |
The normalized regression coefficient maps of blood-activation were drawn with the regression equation coefficients (Fig. 5). Except for chromatographic peaks P2 and P6, the other 39 peaks were all negatively related to WBV, indicating that as the levels of compounds represented by these peaks increased, the WBV decreased. Except for peaks P6, P8, P10, P13, P16, and P23, all other peaks were positively related to APTT. In addition, the significance of the x-variables for the model could be reflected by the variable importance in projection (VIP) values (VIP > 1.0).36,37 Therefore, on one hand, the components corresponding to the peaks P38, P15, P1, P26, P34, P28, P36, P40, P22, P29, P18, P3, P25, P11, and P39 were considered to be closely related to reduced WBV (Fig. 5). On the other hand, the components represented by peaks P3, P38, P15, P1, P4, P40, P14, P25, P26, P36, P18, P19, P11, P35, P7, and P33 were considered to be closely related to prolonged APTT (Fig. 5).
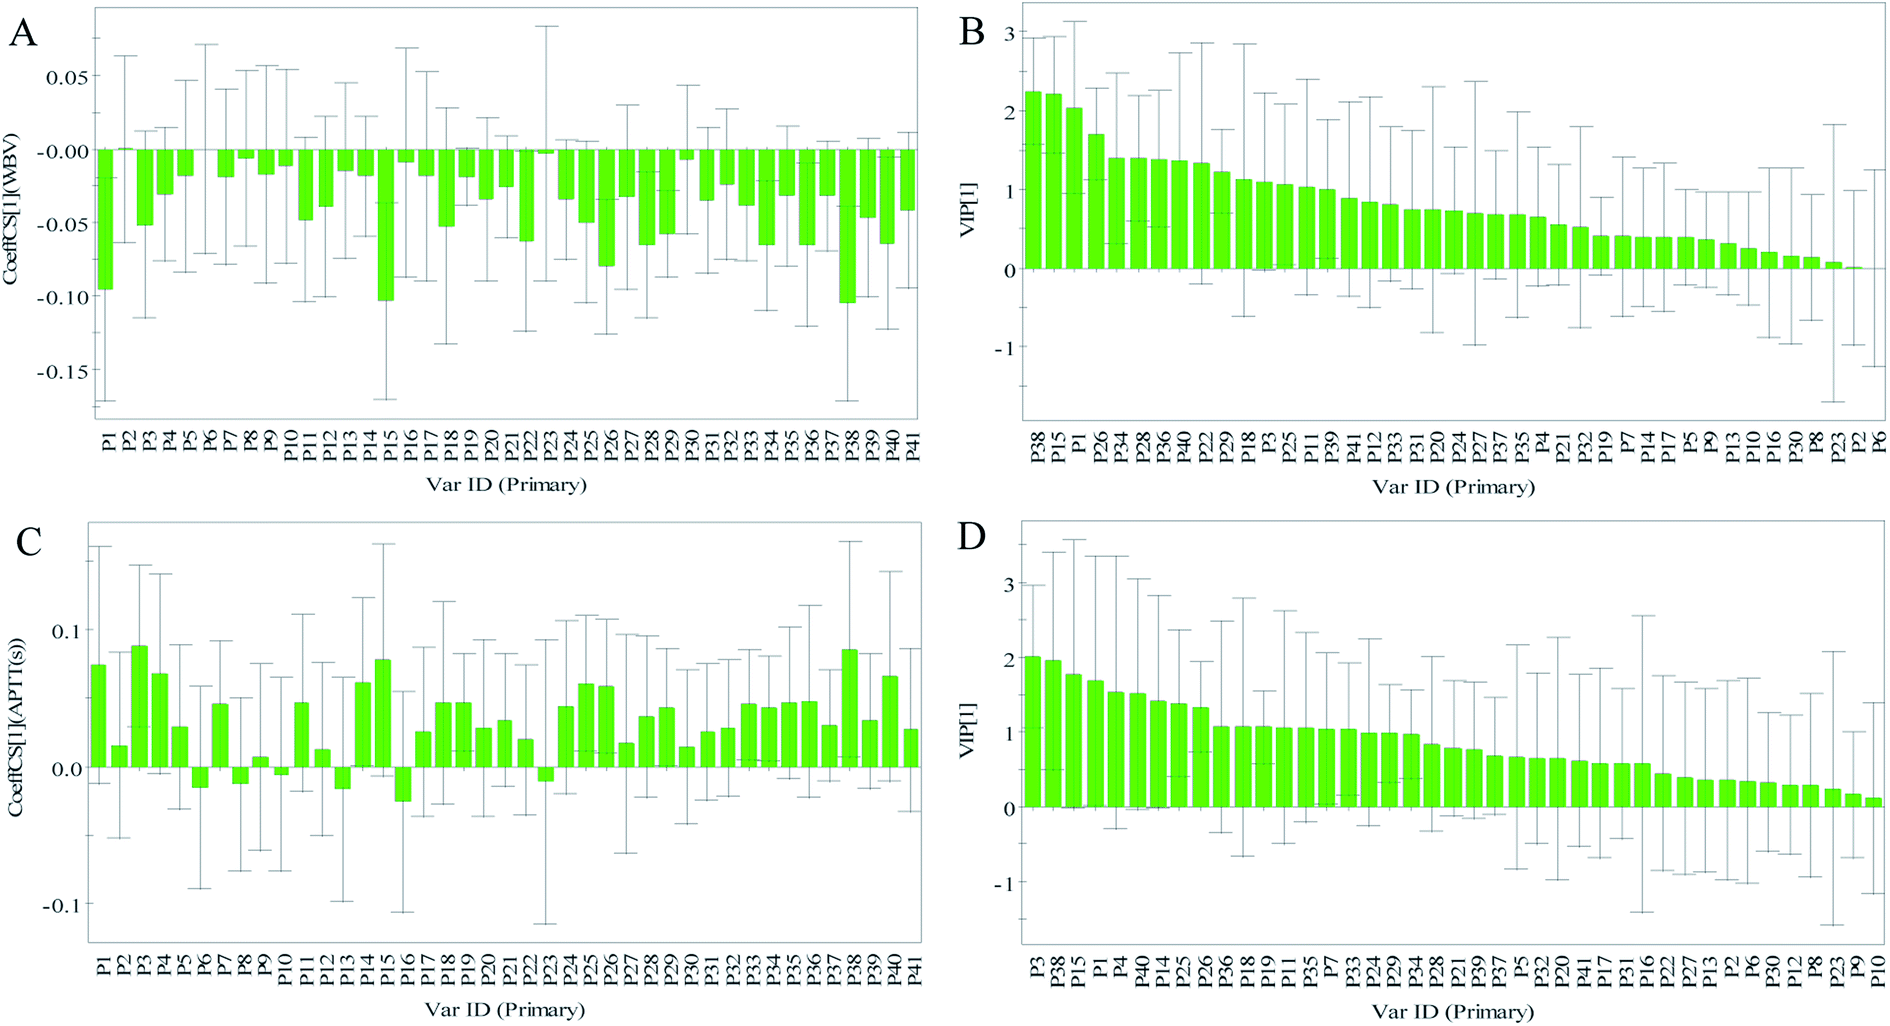 | ||
| Fig. 5 The results of profile–efficacy analysis by partial least squares regression analysis (PLSR). (A) Regression coefficients between 41 common peaks and WBV, (B) regression coefficients between 41 common peaks and APTT, (C) variable importance in projection (VIP) values of 41 common peaks to WBV, and (D) VIP values of 41 common peaks to APTT. | ||
According to the GRA and PLSR results, components represented by peaks P1, P3, P11, P15, P22, P34, P36, P38, and P39 were predicted to be blood-activating. By comparing the chromatograms of the samples with the mixture of reference substances (Fig. 3), peaks P1, P3, P11, P15, P22, P34, P36, P38, and P39 were identified to be salvianic acid A (P1), rutin (P3), ginsenoside Rg1 (P11), salvianolic acid B (P15), ginsenoside Rb1 (P22), cholic acid (P34), cinobufagin (P36), tanshinone I (P38), and tanshinone IIA (P39), respectively.
3.4 Results of verification experiment
The results of the spectrum–effect relationship demonstrated that P1, P3, P11, P15, P22, P34, P36, P38 and P39 might be the blood-activating components in XXT. To further confirm the reliability of the results and determine their dedication to the blood-activating effect of XXT, the anticoagulant effects on APTT, PT, TT, and FIB of normal rat plasma were then tested. As shown in Fig. 6, salvianic acid A (P1), rutin (P3), ginsenoside Rg1 (11), ginsenoside Rb1 (P22), cinobufagin (P36), tanshinone I (P38), and tanshinone IIA (P39) could increase PT, TT, and APTT and reduce FIB at 40 μM and 20 μM (p < 0.05, p < 0.01), respectively, but had no obvious effect on these indexes at 10 μM (p > 0.05). A certain dose dependence appeared. In addition, the positive control drug, aspirin,19 showed a remarkable effect on PT, TT, APTT, and FIB at 40 μM and 20 μM (p < 0.05, p < 0.01). However, cholic acid (P34) and salvianolic acid B (P15) had no sizeable effect on PT, TT, APTT, or FIB (p > 0.05). The results indicated that salvianic acid A, rutin, ginsenoside Rg1, ginsenoside Rb1, cinobufagin, tanshinone I, and tanshinone IIA showed a significant anticoagulant effect on the rat plasma. As a whole, these seven compounds might play vital roles in the blood-activating effect of XXT.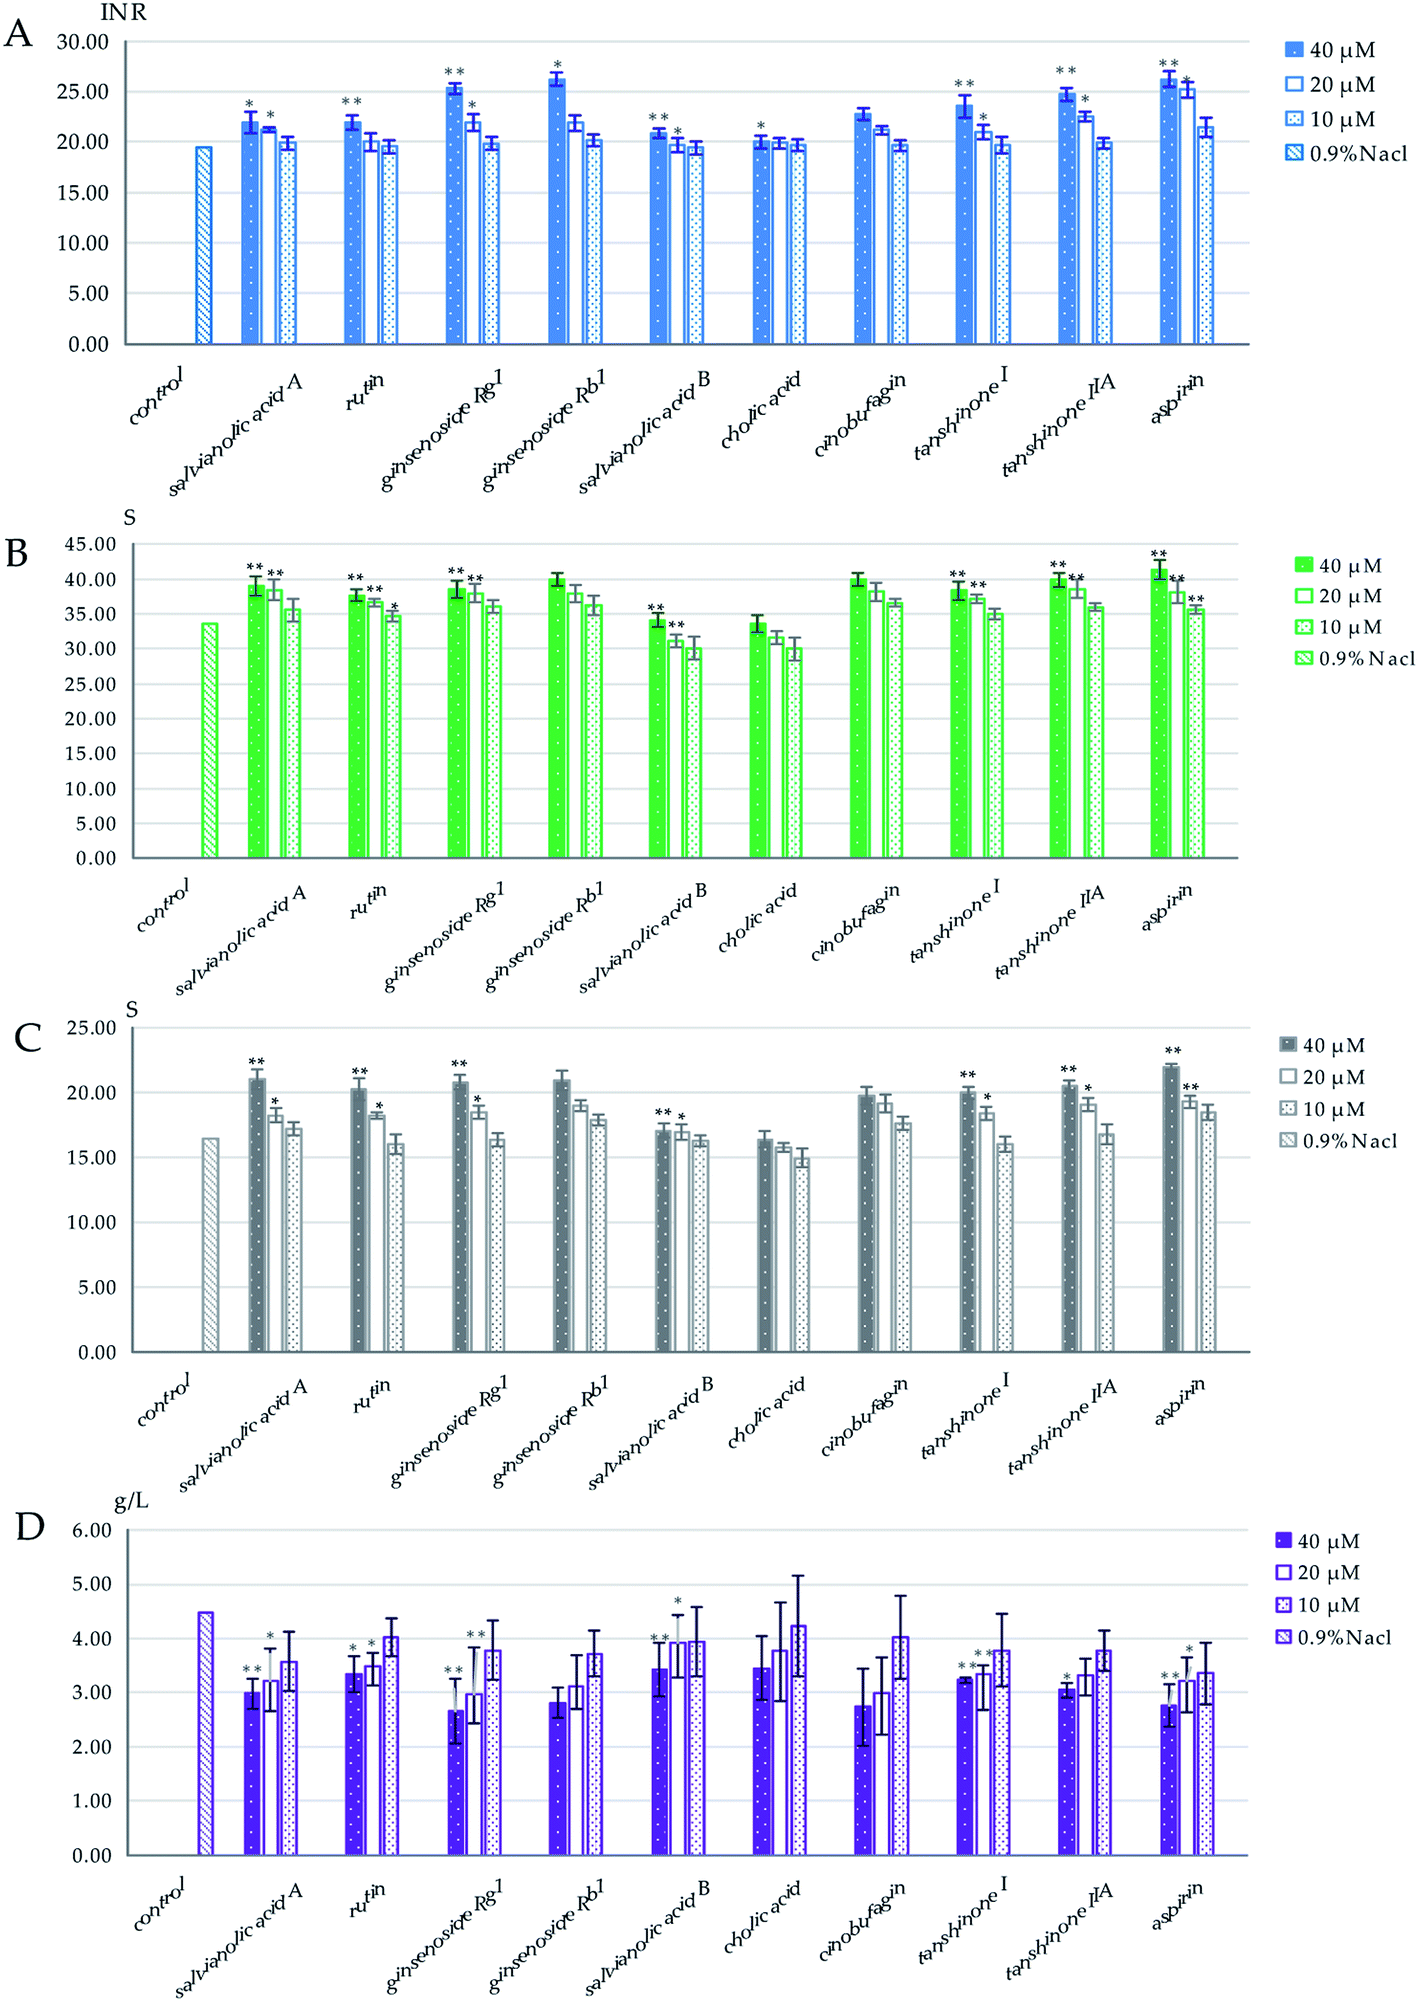 | ||
| Fig. 6 The effects on the coagulation parameters of predicted compounds: (A) PT, (B) TT, (C) APTT, and (D) FIB. Data are expressed as mean ± SD for three independent experiments. Data were analyzed by one-way ANOVA followed by a post hoc Dunnett's test. **p < 0.01, *p < 0.05 are significant compared to the control. | ||
3.5 Network pharmacology
In order to discuss the potential pharmacological mechanisms of XXT, network pharmacology was used based on the seven active components.3.5.1.1 The compound–target network. To understand the complex interactions between the seven active compounds and their corresponding targets at a system level, we constructed a network (Fig. 7) based on the active compounds of XXT and their potential targets. This network contained 97 nodes and 111 edges in total. In the network, each node size was proportional to its degree number. The blue parallelograms represent the seven active components, while the circled dots are the targets. Each link represents the interaction between the compound and the target. The targets of tanshinone IIA are greater than 40. The targets of the other four compounds are all greater than 10. The degree values of a node display the number of routes connected to the node. The degree was ranked as tanshinone IIA, salvianic acid A, rutin, tanshinone I, ginsenoside Rb1, ginsenoside Rg1 and cinobufagin. These targets are composed of eight cytokines, fifty-two enzymes, eleven G-protein-coupled receptors (GPCRs), two integrins, one ion channel, three kinases, six nuclear receptors, and seven transporters. This highlights the critical roles of enzymes, kinase, and transporter.
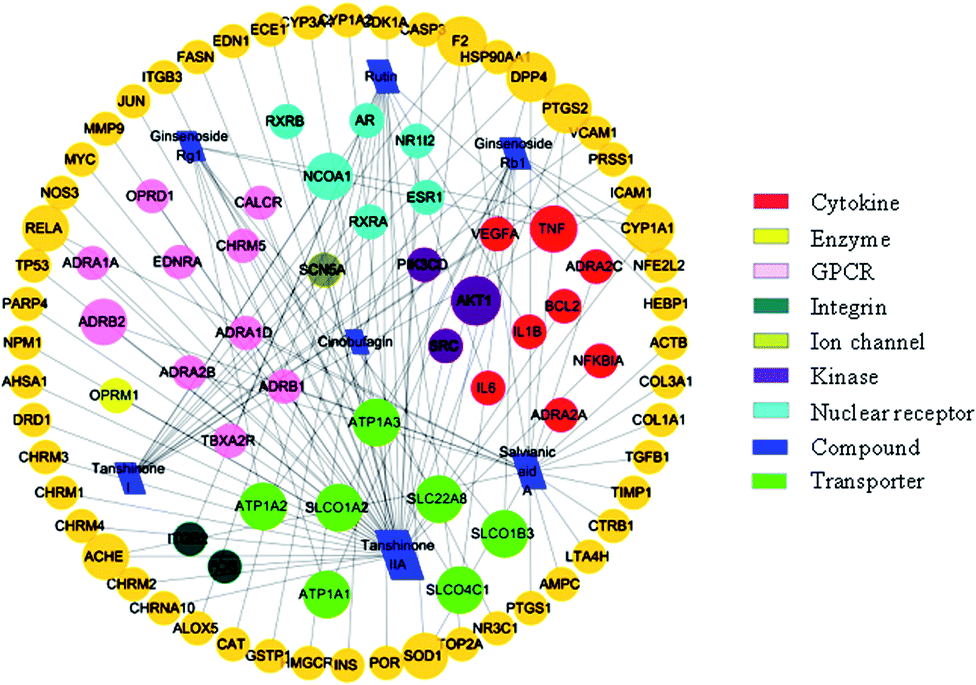 | ||
| Fig. 7 The active compound–target network. | ||
3.5.1.2 The target–target network. The blood stasis-associated target proteins were obtained by searching databases. A Venn diagram of 48 core targets was then obtained by blood stasis-associated target intersecting with the above targets of active compounds (Fig. 8). The target–target network was constructed (Fig. 9) from the STRING database by uploading 48 core targets. In the target–target network, each node represents a protein target. Two proteins are linked if they are targeted by the shared component. In the 48 targets, 46 have at least one link to other targets: that is, they share compounds with other targets. A large highly interconnected network, with 46 nodes and 214 edges, was formed by most targets. The top three targets according to degree were TNF, AKT1, and VEGFA. Combined with the betweenness centrality score, AKT1 was selected as a potential key target protein for the treatment of blood stasis.
 | ||
| Fig. 8 The Venn diagram of active ingredient targets (A) and blood stasis-associated targets (B). | ||
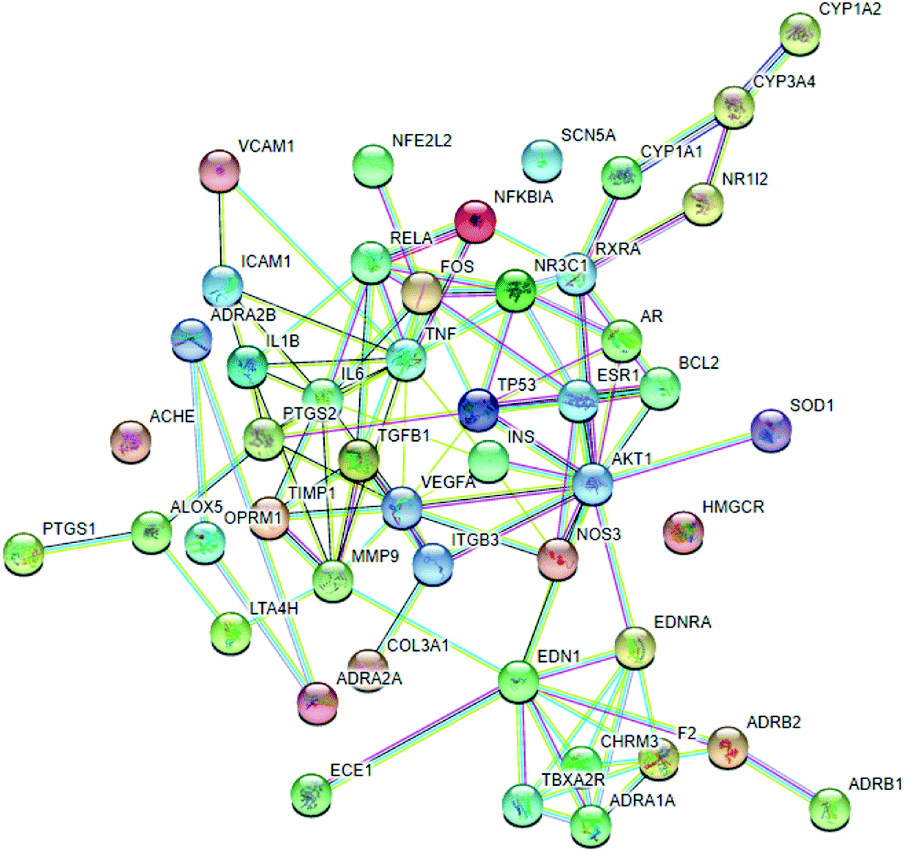 | ||
| Fig. 9 The target–target network from the STRING database. | ||
 | ||
| Fig. 10 A Gene ontology (GO) enrichment analysis histogram of the active components in XXT. | ||
The 48 core targets were uploaded to the DAVID database to obtain 14 pathways related to blood stasis (p < 0.05), which were then uploaded to the OmicShare database. A bubble map of the KEGG enrichment pathways of the core targets was obtained (Fig. 11). KEGG analysis demonstrated that multiple pathways were remarkably involved in the mechanism of XXT, including cAMP, TNF, HIF-1, NF-κB, PI3K-Akt, sphingolipid, MAPK, VEGF, platelet activation, apoptosis, arachidonic acid, hematopoietic cell lineage, and NOD-like receptor signaling pathway.
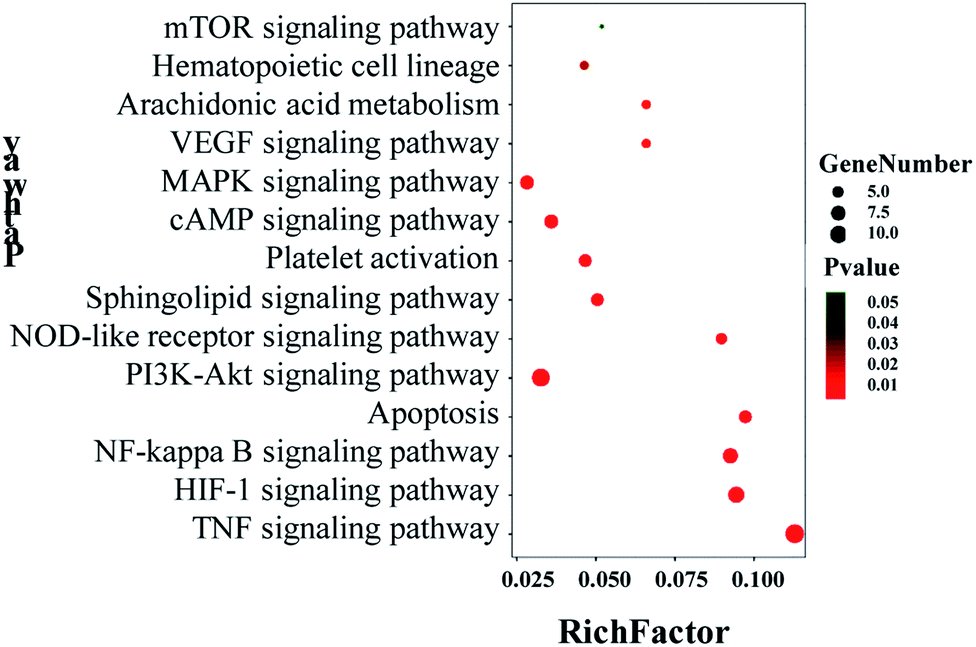 | ||
| Fig. 11 A KEGG enrichment pathway bubble map of the main active components in XXT. | ||
Information on pathways and corresponding targets is shown in Table 3. An active compound–target–pathway network map was constructed (Fig. 12).
| No. | Pathway | Count | Target name |
|---|---|---|---|
| hsa04024 | cAMP signaling pathway | 7 | EDNRA, AKT1, FOS, ADRB2, ADRB1, RELA, NFKBIA |
| hsa04668 | TNF signaling pathway | 12 | VCAM1, AKT1, ICAM1, FOS, IL6, TNF, PTGS2, RELA, MMP9, EDN1, NFKBIA, IL1B |
| hsa04066 | HIF-1 signaling pathway | 9 | AKT1, IL6, INS, RELA, BCL2, EDN1, VEGFA, NOS3, TIMP1 |
| hsa04064 | NF-kappa B signaling pathway | 8 | VCAM1, ICAM1, TNF, PTGS2, RELA, BCL2, NFKBIA, IL1B |
| hsa04151 | PI3K-Akt signaling pathway | 11 | AKT1, IL6, INS, RELA, RXRA, BCL2, COL3A1, VEGFA, TP53, NOS3, ITGB3 |
| hsa04071 | Sphingolipid signaling pathway | 6 | AKT1, TNF, RELA, BCL2, TP53, NOS3 |
| hsa04010 | MAPK signaling pathway | 7 | AKT1, FOS, TNF, RELA, TP53, IL1B, TGFB1 |
| hsa04370 | VEGF signaling pathway | 4 | AKT1, PTGS2, VEGFA, NOS3 |
| hsa04611 | Platelet activation | 6 | AKT1, COL3A1, PTGS1, TBXA2R, NOS3, ITGB3 |
| hsa04210 | Apoptosis | 6 | AKT1, TNF, RELA, BCL2, TP53, NFKBIA |
| hsa04150 | mTOR signaling pathway | 3 | AKT1, TNF, INS |
| hsa00590 | Arachidonic acid metabolism | 4 | PTGS2, PTGS1, LTA4H, ALOX5 |
| hsa04640 | Hematopoietic cell lineage | 4 | IL6, TNF, IL1B, ITGB3 |
| hsa04621 | NOD-like receptor signaling pathway | 5 | IL6, TNF, RELA, NFKBIA, IL1B |
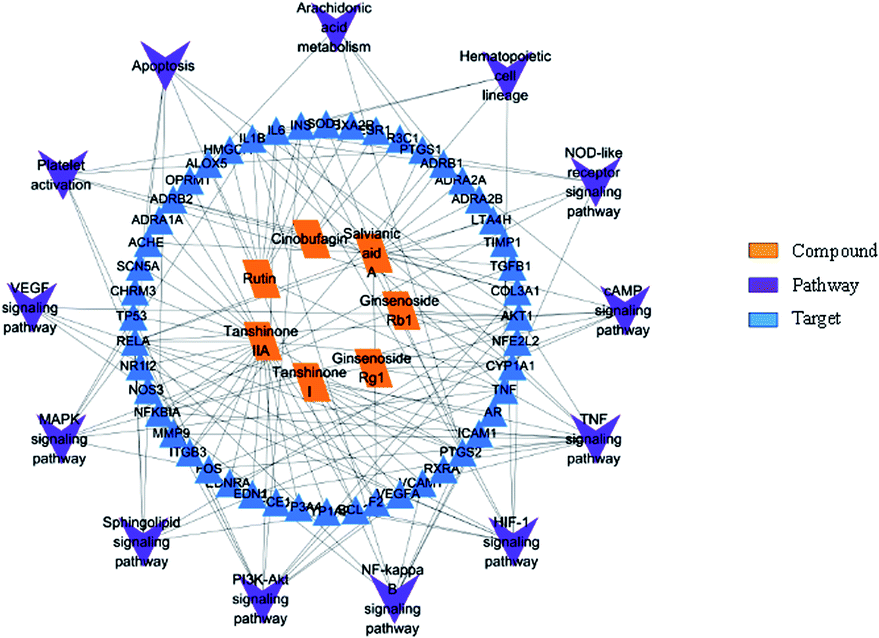 | ||
| Fig. 12 The active compound–target–pathway network map. | ||
4 Discussion
The present chemical study has established a valid and satisfactory HPLC method to analyze the fingerprints of 10 kinds of XXT extracts with different polarity solvents. The similarity of the fingerprints (correlation coefficients > 0.815) was acceptable for spectrum–effect relationship analysis, and the coefficients of variance of common peaks (>35%) clearly showed that there was diversity in the contents of the constituents of 10 kinds of XXT extracts. In the pharmacological experiment, hemorheology indexes (such as WBV and PV) and coagulation indicators (PT, TT, APTT, and FIB), the important evaluation indexes in estimating blood stasis,38,39 were selected for pharmacodynamic evaluation. Blood stasis plays a vital role in the information process of multiple disorders and diseases.40,41 While blood-activation is the essential strategy to ameliorate blood stasis. The results indicated that different batches of XXT exhibited a considerable blood-activating effect on the acute blood stasis model rats. However, significant differences in the levels of WBV (10/s) and APTT between different batches of XXT were found, which might be caused by the different contents of bioactive ingredients in each kind of XXT extract. Therefore, it is necessary to perform a spectrum–effect relationship analysis. Both GRA and PLSR, being widely applied for spectrum–effect relationship analysis of TCM, were used to predict the active components. As a result, nine components with potential strong blood-activating activity were analyzed. In the following pharmacological test, seven compounds, tanshinone I, tanshinone IIA, salvianic acid A, ginsenoside Rg1, ginsenoside Rb1, rutin, and cinobufagin, were then screened out by an in vitro test. Among them, tanshinone I, tanshinone IIA, and salvianic acid A come from Salvia miltiorrhiza; ginsenoside Rg1, and ginsenoside Rb1 come from the total ginsenosides found in ginseng stems and leaves; rutin comes from sophorae flos and cinobufagin comes from bufonis venenum. The pharmacological validation was almost the same as the expected results. In previous reports, the activities of tanshinone I, tanshinone IIA, and salvianic acid A mainly referred to anti-cardiac fibrosis,42 anti-tumor,43,44 anti-atherosclerosis,45 and anti-heart damage effects, and ameliorating endothelial dysfunction,46 suppressing excessive oxidation damage and cell apoptosis, anti-blood stasis, and reducing intracellular calcium ion overload,47 possessing anticoagulant,48 anti-inflammatory,49 reducing nerve cell apoptosis and protecting against ischemia/reperfusion injury50 and anti-carotid atherosclerosis plaques.51 The antiplatelet aggregation activity of ginsenoside Rg1 and Rb1 has been reported.52 In addition, they have activities in treating cardiovascular diseases53 and ischemic stroke,54 and have anti-inflammatory55 and neuroprotective effects against cerebral ischemia.56 Rutin had anti-oxidant,57 anti-carcinogenic,58 liver protection,59 anti-inflammatory,60 neuroprotective,61 and vasoprotective properties.62 Cinobufagin inhibited PC3 cell growth63 and had antifibrosis properties.64 The investigation in the present study showed that “spectrum–effect relationship analysis” is an effective method for looking for the active components in TCM.To make a further primary prediction of the multiple mechanisms of the effects of XXT, network pharmacology was used to construct an entire drug–target–pathway interaction network in the last part of the present study. The seven screened active components were used as “candidate compounds” for the analysis. The results showed that the main kinds of targets involved in the blood-activating effect were enzymes, kinase, and transporter. The top three targets according to degree, TNF, AKT1, and VEGFA, were considered as potential key target proteins for the treatment of blood stasis in the present study. Moreover, the TNF, NF-κB, and PI3K-Akt signaling pathways were also predicted to be involved in the anti-blood stasis effect of XXT. In previous reports, AKT1, one of three closely related serine/threonine–protein kinases (AKT1, AKT2, and AKT3), is activated reliant on the P13K pathway and is a key node in the signal network, which controls many aspects regarding cell metabolism, proliferation, apoptosis, angiogenesis and anti-hematologic malignancies.65–67 TNF (tumor necrosis factor), an inflammatory cytokine (including TNF-α and TNF-β), mainly secreted by macrophages and T lymphocytes during acute inflammation, acts as an inflammatory mediator by preventing endotoxin shock, and has anti-tumor effects and anti-infective effects by inhibiting viral replication and killing virus-infected cells/tumor cells.68 VEGFA, a key vascular endothelial growth factor to promote angiogenesis and axonal regeneration,69 promotes endothelial cell proliferation, induces cell migration, induces permeabilization of blood vessels, and suppresses apoptosis.70 Although further experimental validations of the network pharmacology prediction are required in future studies, utilizing network pharmacology in TCM research is an efficient method to elucidate how multiple components interact with multiple targets, which is consistent with the theory of TCM synergy.
5 Conclusions
In the present study, we quickly and accurately screened seven active components from Xueshuan Xinmaining Tablet using a comprehensive evaluation system combining chemical analysis, biological activity evaluation and mechanism study. Firstly, the spectrum–effect relationship was established by linking the peaks in the fingerprints of XXT with the blood-activating bioactivity to screen nine potential active components in XXT. Then, pharmacological tests verified seven of the nine compounds, salvianic acid A (P1), rutin (P3), ginsenoside Rg1 (P11), ginsenoside Rb1 (P22), cinobufagin (P36), tanshinone I (P38), and tanshinone IIA (P39), and had an anticoagulant effect in vitro. Finally, the putative mechanism of these seven components was further discussed using network pharmacology analysis, and three signal pathways (the TNF, NF-κB, and PI3K-Akt signaling pathways) that might be related to anti-blood stasis were found. The study provided a new approach and ideas for the exploration of the active components of TCM.Author contributions
Conceptualization: Jing Tan and Jinping Liu; data curation: Hongqiang Lin, Zhongyao Wang, Hanrui Si and Yutong Zhang; formal analysis: Han Wang; funding acquisition: Pingya Li; investigation: Han Wang and Ying Zhang; methodology: Han Wang; project administration: Junli Liu; resources: Ying Zhang; software: Hongqiang Lin; supervision: Junli Liu and Jinping Liu; validation: Kai Sun; visualization: Hanrui Si and Yutong Zhang; writing–original draft: Jing Tan; writing–review & editing: Jinping Liu and Kai Sun.Conflicts of interest
The authors declare that there are no conflicts of interest.Acknowledgements
This research was financially supported by the Biomedicine Special Foundation for Government–University Cooperation Project of Jilin Province [No. SXGJSF2017-1-1-(02)], and College Students Innovation and Entrepreneurship Training Project of Jilin University [No. 201910183947]. We thank Fang Wang and other workers at the Research Center of Natural Drug and Department of Pathogen Biology, College of Basic Medical Sciences in Jilin University for help with pharmacologic verification and multivariate statistical analysis.References
- X. T. Zhang, C. Zhang, J. Y. Sai, F. Li, J. P. Liu and P. Y. Li, Xueshuan Xinmaining Tablet Treats Blood Stasis through Regulating the Expression of F13a1, Car1, and Tbxa2r, Evid.-Based Complementary Altern. Med., 2015, 1–8 Search PubMed.
- X. Zhao, D. Sui, X. Yu, S. C. Qu and H. L. Xu, Protective effect and mechanism of Xueshuan Xinmaining tablets on acute myocardial infarction, Chin. J. Integr. Med., 2008, 6, 177–179 CrossRef PubMed.
- J. Liu, S. Qu, X. Yu, H. Xu and D. S, Te protective effect of of Xueshuan Xinmaining tablets on experimental cerebral ischemia in rats, Chin. J. Integr. Med., 2011, 9, 333–334 CrossRef.
- L. X. Xiong, J. S. Xie, C. X. Song, J. P. Liu, J. T. Zheng, C. G. Liu, X. T. Zhang, P. Y. Li and F. Wang, The Activation of Nrf2 and Its Downstream Regulated Genes Mediates the Antioxidative Activities of Xueshuan Xinmaining Tablet in Human Umbilical Vein Endothelial Cells, Evid.-Based Complementary Altern. Med., 2015,(22), 1–7 CrossRef CAS PubMed.
- J. Tan, C. Z. Wang, H. L. Zhu, B. S. Zhou, L. X. Xiong, F. Wang, J. P. Liu and P. Y. Li, Comprehensive Metabolomics Analysis of Xueshuan Xinmaining Tablet in Blood Stasis Model Rats Using UPLC–Q/TOF–MS, Molecules, 2018, 23(7), 1650–1665 CrossRef PubMed.
- J. Tan, H. Q. Lin, Y. H. Liu, H. Wang, Q. H. Dong, F. L. Wu, C. G. Liu, P. Y. Li and J. P. Liu, Components analysis of Xueshuan Xinmaining tablets based on UPLC–Q–TOF MS, J. Chin. Mass Spectrom. Soc., 2019, 40(03), 244–252 Search PubMed.
- J. X. Cui, J. F. Cui, W. X. Hong and H. B. Gao, Research on construction of standard TCM fingerprints based on multi–parameter distance clustering theories, Gaojishu Tongxun, 2014, 24(1), 99–103 Search PubMed.
- H. M. Tang, Y. M. Luo, Y. Yan, Q. L. Liang, X. S. Meng and G. A. Luo, Research Method of Traditional Chinese Medicine Fingerprint Based on Diode–array Detector, Chem. J. Chin. Univ., 2009, 30(2), 279–282 CAS.
- X. H. Fan, Z. L. Ye and Y. Y. Cheng, A computational method based on information fusion for evaluating the similarity of multiple chromatographic fingerprints of TCM, Chem. J. Chin. Univ., 2006, 27(1), 26–29 CAS.
- H. J. Hu, L. F. Lin, Y. L. Liu, J. Z. Zhu, C. G. Liu and Q. F. Gong, Study on UPLC–PDA Fingerprint of Xueshuan Xinmaining Tablets, Chin. Tradit. Herb. Drugs, 2017, 48(20), 4268–4274 Search PubMed.
- J. Qi and B. y. Yu, A New Mode of Quality Evaluation of Traditional Chinese Medicine–“Special Efficiency Integrated Fingerprint Spectrum” Research progress, Chin. J. Nat. Med., 2010, 8(3), 171–176 CrossRef CAS.
- L. Wang, Z. Jiang, P. Xiao, J. Sun, Z. Bi and E. Liu, Identification of anti–inflammatory components in Sinomenii Caulis based on spectrum–effect relationship and chemometric methods, J. Pharm. Biomed. Anal., 2019, 167, 38–48 CrossRef CAS PubMed.
- S. F. Liu, Y. J. Yang and J. Forrest, Introduction to Grey Systems modeling software, Grey Data Analysis, 2016, pp. 285–299 Search PubMed.
- F. Hu, Y. L. Yang, X. H. Liu, R. J. Zhu, C. Li and S. L. Feng, The spectrum of the efficacy of Buzhong Yiqi Pills Relationship study, China Pharm., 2014, 25(3), 195–198 Search PubMed.
- H. Y. Fang, H. W. Zeng, L. M. Lin, X. Chen, X. N. Shen, P. Fu, C. Lv, Q. Liu, R. H. Liu and W. D. Zhang, et al., A network–based method for mechanistic investigation of Shexiang Baoxin Pill's treatment of cardiovascular diseases, Sci. Res., 2017, 7, 43632–43642 Search PubMed.
- J. Zhao, P. Y. Yang, F. Li, L. Tao, H. Ding, Y. C. Rui, Z. W. Cao and W. D. Zhang, et al., Therapeutic Effects of Astragaloside IV on Myocardial Injuries: Multi–Target Identification and Network Analysis, PLoS One, 2012, 7(9), 44938–44948 CrossRef PubMed.
- M. Q. Liu, Y. J. Wu, S. S. Huang, H. G. Liu and J. Feng, Spectrum–effect relationship between HPLC fingerprints and hypolipidemic effect of Curcuma aromatica, Biomed. Chromatogr., 2018, 32(7), 1–7 CrossRef PubMed.
- Y. Han, J. Wen, T. Zhou and G. Fan, Chemical fingerprinting of Gardenia jasminoides Ellis by HPLC–DAD–ESI–MS combined with chemometrics methods, Food Chem., 2015, 188, 648–657 CrossRef CAS PubMed.
- B. Zhuang, Z. M. Bi, Z. Y. Wang, L. Duan, C. J. S. Lai and E. H. Liu, Chemical profiling and quantitation of bioactive compounds in Platycladi Cacumen by UPLC-Q-TOF-MS/MS and UPLC–DAD, J. Pharm. Biomed. Anal., 2018, 154, 207–215 CrossRef CAS PubMed.
- S. Su, J. Duan, W. Cui, E. Shang, P. Liu, G. Bai, S. Guo, D. W. Qian and Y. P. Tian, Network–based biomarkers for cold coagulation blood stasis syndrome and the therapeutic effects of shaofu zhuyu decoction in rats, J. Evidence-Based Complementary Altern. Med., 2013, 2013, 1–15 Search PubMed.
- X. Dang, J. J. Miao, A. Q. Chen, P. Li, J. R. Liang, R. M. Xie and Y. Zhao, The antithrombotic effect of RSNK in blood–stasis model rats, J. Ethnopharmacol., 2015, 173, 266–272 CrossRef PubMed.
- N. Li, W. Mao, M. Yan, X. Liu, Z. Xia, S. Y. Wang, B. Xiao, C. L. Chen, L. F. Zhang and S. J. Cao, Structural characterization and anticoagulant activity of a sulfated polysaccharide from the green alga Codium divaricatum, Carbohydr. Polym., 2015, 121, 175–182 CrossRef CAS PubMed.
- L. Tang, Y. Chen, Z. Jiang, Z. B. Jiang, S. P. Zhong, F. C. Zheng and G. G. Shi, Purification, partial characterization and bioactivity of sulfated polysaccharides from Grateloupia livida, Int. J. Biol. Macromol., 2017, 94(Pt A), 642–652 CrossRef CAS PubMed.
- S. Gao, H. Chen and X. Zhou, Study on the spectrum–effect relationship of the xanthine oxidase inhibitory activity of Ligustrum lucidum, J. Sep. Sci., 2019, 42, 3281–3292 CrossRef CAS PubMed.
- W. Li, X. Sun, B. Liu, L. H. Zhang, Z. Q. Fan and Y. B. Ji, Screening and identification of hepatotoxic component in Evodia rutaecarpa based on spectrum–effect relationship and UPLC-Q-TOFMS, Biomed. Chromatogr., 2016, 30(12), 1975–1983 CrossRef CAS PubMed.
- L. B. Abhang and M. Hameedullah, Determination of optimum parameters for multi-performance characteristics in turning by using gray relational analysis, Int. J. Adv. Des. Manuf. Technol., 2012, 63(1), 13–24 CrossRef.
- T. T. Zhu, L. Wu, X. L. Wang, L. Wu, X. L. Wang, Q. G. Zhou, X. Liu and B. C. Cai, Investigation on relationships between chemical spectrum and bioeffect of prepared rhubarb decoction in rats by UPLC-ESI-Q-TOF-MS method coupled with gray correlation analysis, J. Funct. Foods, 2017, 31, 104–112 CrossRef CAS.
- T. Kuo, A review of some modified grey relational analysis models, J. Grey Syst., 2017, 29(3), 70–77 Search PubMed.
- W. T. Zhu, L. Z. Duan, J. P. Zhang, Y. Y. Shi and Y. J. Qiao, Constructing a competitiveness evaluation system of listed Chinese medicine enterprises based on grey correlation, J. Grey Syst., 2015, 27, 40–51 Search PubMed.
- M. D. MA, X. J. MA, Y. Z. XIE and T. Ma, Analysis the relationship between ecological footprint (EF) of ningxia and influencing factors: Partial Least-Squares Regression (PLS), J. Ecol., 2014, 34(03), 682–689 Search PubMed.
- X. Chang, M. Yu, C. Zhou, H. M. Jia and Z. M. Zou, Spectrum–effect relationship of Chaihu–Shu–Gan–San for antidepressant effect based on partial least squares regression analysis, Eur. J. Integr. Med., 2014, 6(6), 742–743 CrossRef.
- F. A. Molfetta, A. T. Bruni, F. P. Rosselli and A. B. F. da Silva, A partial least squares and principal component regression study of quinone compounds with trypanocidal activity, Struct. Chem., 2007, 18(1), 49–57 CrossRef CAS.
- M. Wang, M. Chen, Y. Ding, Z. H. Zhu, Y. K. Zhang, P. F. Wei, J. W. Wang, Y. Qiao, L. Li and Y. W. Li, Pretreatment with β-Boswellic Acid Improves Blood Stasis Induced Endothelial Dysfunction: Role of eNOS Activation, Sci. Rep., 2015, 5, 15357–15367 CrossRef CAS PubMed.
- Y. L. Wang, Q. Zhang, S. J. Yin, L. Cai, Y. X. Yang, W. J. Liu, Y. J. Hu, H. Chen and F. Q. Yang, Screening of blood–activating active components from Danshen–Honghua herbal pair by spectrum–effect relationship analysis, Phytomedicine, 2018, 54, 149–158 CrossRef PubMed.
- C. Wu, L. Lu, S. Liang, C. Chen and S. M. Wang, Application of drug–target prediction technology in network pharmacology of traditional Chinese medicine, China J. Chin. Mater. Med., 2016, 41(3), 377–382 Search PubMed.
- W. J. Li, Y. Zhang, S. J. Shi, G. Yang, Z. H. Liu, J. M. Wang and W. Y. Kang, Spectrum–effect relationship of antioxidant and tyrosinase activity with Malus pumila flowers by UPLC–MS/MS and component knock–out method, Food Chem. Toxicol., 2019, 133, 110754–110772 CrossRef PubMed.
- Q. Fan, R. J. Yang, F. X. Yang, P. F. Xia and L. Zhao, Spectrum–effect relationship between HPLC fingerpints and antioxidant activity of Angelica sinensis, Biomed. Chromatogr., 2019, 34(2) DOI:10.1002/bmc.4707.
- H. Xu and K. J. Chen, Practical diagnostic criterion of blood stasis syndrome, Chin. J. Integr. Med., 2017, 23(4), 243–244 CrossRef PubMed.
- J. Wang, X. J. Xiong and B. Feng, Aspirin resistance and promoting blood circulation and removing blood stasis: Current situation and prospectives, Evid.-Based Complementary Altern. Med., 2014, 2014, 1–11 Search PubMed.
- F. L. Liao and J. Cao, Biomechanopharmacology in evaluation of herbs of Activating blood circulation to remove blood stasis, Chin. J. Biomed. Eng., 2005, 14(2), 47–54 Search PubMed.
- Y. Lu, Y. L. Hu, X. F. Kong and D. Y. Wang, Selection of component drug in activating blood flow and removing blood stasis of Chinese herbal medicinal formula for dairy cow mastitis by hemorheological method, J. Ethnopharmacol., 2008, 116(2), 313–317 CrossRef CAS PubMed.
- B. Jiang, D. Li, Y. Deng, F. Teng, J. Chen, S. Xue, X. Kong, C. Luo, X. Shen and H. Jiang, et al., Salvianolic acid A, a novel matrix metalloproteinase–9 inhibitor, prevents cardiac remodeling in spontaneously hypertensive rats, PLoS One, 2013, 8(3), e59621 CrossRef CAS PubMed.
- I. T. Nizamutdinova, G. W. Lee, J. S. Lee, M. K. Cho, K. H. Son, S. J. Jeon, S. S. Kang, Y. S. Kim, J. H. Lee and H. G. Seo, et al., Tanshinone I suppresses growth and invasion of human breast cancer cells, MDA–MB–231, through regulation of adhesion molecules, Carcinogenesis, 2008, 29(10), 1885–1892 CrossRef CAS PubMed.
- B. X. Ren, Y. Ji, J. C. Tang, D. P. Sun, X. Hui, D. Q. Yang and X. L. Zhu, Effect of Tanshinone IIA intrathecal injections on pain and spinal inflammation in mice with bone tumors, GMR, Genet. Mol. Res., 2015, 14(1), 2133–2138 CrossRef CAS PubMed.
- Y. Xuan, Y. Gao, H. Huang, X. Wang, Y. Cai and Q. X. Luan, Tanshinone IIA Attenuates Atherosclerosis in Apolipoprotein E Knockout Mice Infected with Porphyromonas gingivalis, Inflammation, 2017, 40(5), 1631–1642 CrossRef CAS PubMed.
- G. Lei, P. M. Siu, S. W. Chan and C. W. K. Lai, Cardiovascular Protective Effects of Salvianic Acid A on Mice with Elevated Homocysteine Level, Oxid. Med. Cell. Longevity, 2017, 1–10 Search PubMed.
- Y. Li, H. F. Wan, W. F. Wan, J. H. Yang, C. Li, L. L. Dai, L. J. Ge, H. F. Zhou, H. T. Wan and Y. He, Protective effects of effective ingredients of Danshen(Radix Salviae Miltiorrhizae) and Honghua(Flos Carthami) compatibility after rat hippocampal neurons induced by hypoxia injury, J. Tradit. Chin. Med., 2018, 38(5), 29–41 Search PubMed.
- L. C. Wu, X. Lin and H. Sun, Tanshinone IIA protects rabbits against LPS–induced disseminated intravascular coagulation (DIC), Acta Pharmacol. Sin., 2012, 33, 1254–1259 CrossRef CAS PubMed.
- G. W. Fan, X. M. Gao, H. Wang, Y. Zhu, J. Zhang, L. M. Hu, Y. F. Su, L. Y. Kang and B. L. Zhang, The anti-inflammatory activities of Tanshinone IIA, an active component of TCM, are mediated by estrogen receptor activation and inhibition of iNOS, J. Steroid Biochem. Mol. Biol., 2009, 113, 275–280 CrossRef CAS PubMed.
- L. Zhang, W. Gan and G. An, Influence of Tanshinone IIA on heat shock protein 70, Bcl–2 and Bax expression in rats with spinal ischemia/reperfusion injury, Neural Regener. Res., 2012, 7(36), 2882–2888 CAS.
- J. Jin, L. Liu and Z. H. Li, Effects of Tanshinone on Carotid Atherosclerosis Plaques and Serum hs–CRP Level in Patients with Blood–stasis Syndrome, Acta Chin. Med. Pharmacol., 2012, 40(3), 69–71 Search PubMed.
- Q. Zhou, L. Jiang, C. Xu, D. Luo, C. Zeng, P. Liu, M. Yue, Y. Liu, X. Hu and H. Hu, Ginsenoside Rg1 inhibits platelet activation and arterial thrombosis, Thromb. Res., 2014, 133(1), 57–65 CrossRef CAS PubMed.
- Y. Sun, Y. Liu and K. Chen, Roles and mechanisms of ginsenoside in cardiovascular diseases: progress and perspectives, Sci. China: Life Sci., 2016, 59(3), 292–298 CrossRef CAS PubMed.
- C. L. Xie, W. W. Wang, X. D. Xue, S. F. Zhang, J. Gan and Z. G. Liu, A systematic review and meta-analysis of Ginsenoside–Rg1 (G–Rg1) in experimental ischemic stroke, Sci. Rep., 2015, 5, 7790–7798 CrossRef CAS PubMed.
- W. Cheng, D. Wu, Q. Zuo, Z. Wang and W. Fan, Ginsenoside Rb1 prevents interleukin–1 beta induced inflammation and apoptosis in human articular chondrocytes, Int. Orthop., 2013, 37(10), 2065–2070 CrossRef PubMed.
- X. S. Zeng, X. S. Zhou, F. C. Luo, J. J. Jia, L. Qi, Z. X. Yang, W. Zhang and J. Bai, Comparative analysis of the neuroprotective effects of ginsenosides Rg1 and Rb1 extracted from, Panax notoginseng, against cerebral ischemia, Can. J. Physiol. Pharmacol., 2014, 92(2), 102–108 CrossRef CAS PubMed.
- B. Zhao, W. J. Zhang, Y. X. Xiong, Y. Zhang, L. Jia and X. Xu, Rutin protects human periodontal ligament stem cells from TNF-α induced damage to osteogenic differentiation through suppressing mTOR signaling pathway in inflammatory environment, Arch. Oral Biol., 2020, 109, 104584–104591 CrossRef PubMed.
- J. Yang, J. Guo and J. Yuan, In vitro antioxidant properties of rutin, LWT–Food Sci. Technol., 2008, 41(6), 1060–1066 CrossRef CAS.
- F. E. Deschner, Quercetin and rutin as inhibitors of azoxymethanol–induced colonic neoplasia, Carcinogenesis, 1991, 12(7), 1193–1196 CrossRef PubMed.
- K. H. Janbaz, S. A. Saeed and A. H. Gilani, Protective effect of rutin on paracetamol– and CCl4–induced hepatotoxicity in rodents, Fitoterapia, 2002, 73(7–8), 557–563 CrossRef CAS PubMed.
- H. Javed, M. M. Khan, A. Ahmad, K. Vaibhav, M. E. Ahmad, A. Khan, M. Ashafaq, F. Islam, M. S. Siddiqui and M. M. Safhi, et al., Rutin prevents cognitive impairments by ameliorating oxidative stress and neuroinflammation in rat model of sporadic dementia of Alzheimer type, Neuroscience, 2012, 17, 340–352 CrossRef PubMed.
- F. Mellou, H. Loutrari, H. Stamatis, C. Roussos and F. N. Kolisis, Enzymatic esterification of flavonoids with unsaturated fatty acids: effect of the novel esters on vascular endothelial growth factor release from K562 cells, Process Biochem., 2006, 41, 2029–3204 CrossRef CAS.
- T. L. Niu, L. Y. Zhao, X. Y. Lin, Y. K. Cai, S. H. Chen, M. K. Wang, L. Zhou, H. Y. Ding, X. H. Yu and G. Z. Qin, Cinobufagin, a bufadienolide from traditional Chinese medicine Bufo bufo gargarizans CANTOR, inhibits PC3 cell growth in vitro and in vivo, J. Trad. Chin. Med. Sci., 2019, 6(2), 175–183 Search PubMed.
- X. H. Li, B. Zhun, S. S. Liu, S. Gao, Y. Cui, K. Huang, M. Huang, J. Mao, L. Li and J. Gao, et al., Antifibrotic Mechanism of Cinobufagin in Bleomycin–Induced Pulmonary Fibrosis in Mice, Front. Pharmacol., 2019, 10, 1–14 CrossRef PubMed.
- B. R. Davies, H. Greenwood, P. Dudley, C. Crafter, D. H. Yu, J. Zhang, J. Li, B. Gao, Q. Ji and J. Maynard, et al., Preclinical Pharmacology of AZD5363, an Inhibitor of AKT: Pharmacodynamics, Antitumor Activity, and Correlation of Monotherapy Activity with Genetic Background, Mol. Cancer Ther., 2012, 11(4), 873–887 CrossRef CAS.
- D. A. Altomare and J. R. Testa, Perturbations of the AKT signaling pathway in human cancer, Oncogene, 2005, 24, 7455–7464 CrossRef CAS PubMed.
- A. Bellacosa, C. C. Kumar, C. A. Di and J. R. Testa, Activation of AKT kinases in cancer: implications for therapeutic targeting, Adv. Cancer Res., 2005, 94, 29–86 CrossRef CAS PubMed.
- H. T. Idriss and J. H. Naismith, TNFα and the TNF receptor superfamily: Structure–function relationship(s), Microsc. Res. Tech., 2000, 50(3), 184–195 CrossRef CAS PubMed.
- N. A. Stefanova, K. Y. Maksimova, E. A. Rudnitskaya, N. A. Muraleva and N. G. Kolosova, Association of cerebrovascular dysfunction with the development of Alzheimer's disease–like pathology in OXYS rats, BMC Genomics, 2018, 19(S3), 75 CrossRef PubMed.
- B. Jiang, Y. Zhang, C. She, J. Zhao, K. Zhou, Z. Zuo, X. Zhou, P. Wang and Q. Dong, Xray irradiation has positive effects for the recovery of peripheral nerve injury maybe through the vascular smooth muscle contraction signaling pathway, Environ. Toxicol. Pharmacol., 2017, 54, 177–183 CrossRef CAS PubMed.
| This journal is © The Royal Society of Chemistry 2020 |