 Open Access Article
A slight bluish-white fluorescence from E,E-2,6-bis(4-cyanostyryl)pyridine pristine crystals†
Hiroyuki Mochizuki * and
Hitoshi Kusama
Research Center for Photovoltaics, National Institute of Advanced Industrial Science and Technology, 1-1-1 Higashi, Tsukuba, Ibaraki 305-8565, Japan
First published on 15th January 2020
Abstract
Among various light emission phenomena, multicolour light emission, such as white light emission, is an interesting phenomenon. Bis-styrylbenzene derivatives show unique and excellent emission behaviours. In this study, three types of bis-styrene derivatives, with thiophene, pyridine, and benzene rings at the central position, were synthesised, and their photophysical properties were studied in detail. Among them, pristine crystals of E,E-2,6-bis(4-cyanostyryl)pyridine (Py4CN) showed a slight bluish-white emission because the Py4CN pristine crystals were mixtures of two separate crystals emitting blue and yellow-green fluorescence.
Introduction
Materials emitting multicolour light, such as white-light-emitting materials, are of great interest for displays and illumination devices.1–5 Multicolour illumination usually requires multiple light sources; however, a singular light source would be efficient from the viewpoint of device structure. In particular, if a single organic light emitter compound can emit white light, such a compound will be in great demand.For three decades, organic π-conjugated materials,6–13 especially π-conjugated oligomers, have attracted considerable attention due to their utility in tuning optical and electronic properties.9–13 Among π-conjugated oligomers, the compounds consisting of a bis-styrene skeleton have found application in organic light-emitting devices and organic solar cells due to their high photoelectronic performance based on their large conjugated area.14–16 Bis-styrylbenzene derivatives (BSDs) show unique photoemission behaviours. There have been many reports on aggregation-induced emission (AIE), the phenomenon where the derivative does not emit light in solution but emits light in aggregated state.17–22 (2Z,2′Z)-2,2′-(1,4-phenylene)bis(3-phenylacrylonitrile) (BDCS) is a typical material for which AIE was observed.23 BSD crystals have a very low threshold for the amplified spontaneous emission (ASE) phenomenon, which has garnered significant attention in recent years for the development of current injection-type organic lasers.24
Recently, these compounds with various terminal substituents have been reported; their properties depend on these terminal substituents.11,25–27 Among the substituents, the introduction of a cyano (CN) group induces widening of the absorption and fluorescence wavelength regions,26 and thus, is widely used as a substituent for organic solar cell materials.28 Additionally, it is predicted that the properties of bis-styrene derivatives will depend on the aromatic ring introduced at the central position; hence, it is essential to determine the changes introduced by each aromatic ring.
Three kinds of bis-styrene derivatives bearing CN groups at both terminals and with thiophene, pyridine, and benzene rings at the central position were synthesised in this study. To the best of our knowledge, no prior systematic evaluation has been conducted for a series of bis-cyanostyrene derivatives substituted with various aromatic rings at the central position. Furthermore, we detail the changes in the properties of these compounds depending on the central aromatic rings, and especially, report that the crystals of the compound introduced with the pyridine ring emitted a slightly bluish-white fluorescence.
Experimental
The three compounds, E,E-2,5-bis(4-cyanostyryl)thiophene (Th4CN), E,E-2,6-bis(4-cyanostyryl)pyridine (Py4CN), and E,E-1,3-bis(4-cyanostyryl)benzene (3Be4CN), were synthesised by the Horner–Wadsworth–Emmons reaction. The process for synthesis and their melting points are detailed below. The chemical structures of these three compounds are shown in Fig. 1. E,E-1,4-bis(4-cyanostyryl)benzene (4Be4CN) was known26 and also synthesised for comparison. All these three compounds are V-shaped; therefore, the linear structured compound such as 4Be4CN was necessary as a good comparison object, because the thiophene ring cannot produce a linear derivative because of its structure.Synthesis
A 28% methanol solution of sodium methoxide (8.1 mmol; from Wako Pure Chemical Industries, Ltd.) was added dropwise to a stirred mixture of diethyl(4-cyanobenzyl)phosphonate (8.0 mmol; from Tokyo Chemical Industry Co., Ltd.) and the necessary dicarboxaldehyde (3.9 mmol) in 10 mL N,N-dimethylformamide (DMF) at room temperature. The dicarboxaldehydes used were 2,5-thiophenedicarboxaldehyde, 2,6-pyridinedicarboxaldehyde, and 1,3-benzenedicarboxaldehyde (Tokyo Chemical Industry Co., Ltd). This mixture was heated to 80–120 °C for 2–4 h. Afterwards, the reaction was then quenched with 2![[thin space (1/6-em)]](https://www.rsc.org/images/entities/char_2009.gif) :
:![[thin space (1/6-em)]](https://www.rsc.org/images/entities/char_2009.gif) 1 DMF/H2O. The precipitate was then filtered and re-crystallised twice from toluene or chlorobenzene, giving the desired compounds.
1 DMF/H2O. The precipitate was then filtered and re-crystallised twice from toluene or chlorobenzene, giving the desired compounds.
The melting points of Th4CN, Py4CN, and 3Be4CN were 279–281 °C, 175–178 °C, and 215–218 °C, respectively. The 1H NMR and 13C NMR spectra of Th4CN, Py4CN, and 3Be4CN are shown in ESI.†
Basic properties measurements
The thermal properties of the products were evaluated by using differential scanning calorimetry. The optical properties were measured by using a fluorescence spectrometer (F8600, Jasco) equipped with an integrating sphere and a UV spectrophotometer (UV-3600, SHIMADZU). The lifetime in the excited state and ionisation potentials were measured by using a fluorescence lifetime spectrometer (HAMAMATSU, C11367) and a photoelectron spectrophotometer in air (RIKEN KEIKI, AC-3), respectively.The samples for determining optical and photoelectrical properties were prepared by vapour deposition at a rate of 0.02 nm s−1 to a total thickness of 100 nm for optical measurement and 50 nm for the photoelectrical measurement.
The fluorescence spectrum of the crystal was obtained with a fibre spectrometer.
The X-ray diffraction analysis at room temperature was performed by following a simple wide-angle focusing method using an X-ray diffractometer (SmartLab, RIGAKU) operated at 45 kV and 200 mA (Cu Kα).
Computational details
The density functional theory (DFT) calculations were performed by using Gaussian 16 software at the Research Center for Computational Science, Okazaki, Japan.29 The ground-state geometry was optimised at the hybrid DFT level by using the B3LYP functional, which combines Becke's three-parameter exchange functional (B3)30,31 with the correlation functional of Lee, Yang, and Parr (LYP).32 The 6-31G basis set33 was adopted in all the systems. Frequency calculations were performed to confirm the optimised structures with no imaginary frequencies, corresponding to the real minima on the entire potential energy surface. The solvent effects of dichloromethane (dielectric constant = 8.93) were modelled by using a conductor-like polarizable continuum model (C-PCM)34 within the self-consistent reaction field theory.Results and discussion
Basic optical properties in the solution
Fig. 2 shows the absorption spectra of the three compounds in dilute dichloromethane solution (10−5 M). The main absorption spectrum of Th4CN from 350 to 450 nm possessed one peak (at 410 nm) and two shoulders (at ∼385 and 440 nm). Similarly, the Py4CN absorption spectrum exhibited two peaks (at 303 and 350 nm) and one shoulder (at ∼320 nm). The 3Be4CN absorption spectrum showed one peak (at 327 nm) and two shoulders (at ∼310 and 340 nm). First, the peak absorbance of the three compounds were in the order of Th4CN < Py4CN < 3Be4CN. The full width at half maximums (FWHMs) of the absorption spectra were in the order of 3Be4CN (55 nm) < Th4CN (77 nm) < Py4CN (90 nm). Furthermore, the absorption edges of these compounds were in the order of 3Be4CN < Py4CN < Th4CN. The bandgap energies of Th4CN, Py4CN, and 3Be4CN, estimated from their absorption edges, were 2.71, 3.16, and 3.43 eV, respectively. It was observed that the introduction of a thiophene ring was effective for reducing the bandgap energy. Compared with 4Be4CN, the absorption spectrum of 3Be4CN covered the shorter wavelength region and showed larger absorbance.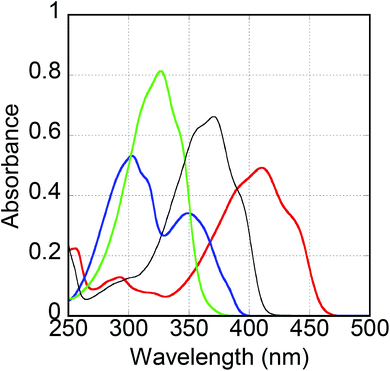 | ||
| Fig. 2 Solution-state absorption spectra of Th4CN (red line), Py4CN (blue line), 3Be4CN (green line), and 4Be4CN (black line). | ||
Fig. 3 shows the fluorescence spectra of Th4CN, Py4CN, and 3Be4CN in dilute dichloromethane solution (10−5 M). The Th4CN fluorescence spectrum, with two peaks at 464 and 491 nm, covered the longest wavelength region among the three compounds. The Py4CN spectrum also showed two peaks at 394 and 413 nm. 3Be4CN showed a top-hat-like spectrum of two peaks at 383 and 397 nm, with the same intensities. In comparison with the solution-state fluorescence spectrum of 4Be4CN, the 3Be4CN spectrum was located in the shorter wavelength region, as was the case in the absorption spectrum. The FWHMs of the three compounds increased slightly in the order of Py4CN (51 nm) < 3Be4CN (59 nm) < Th4CN (64 nm). Since Th4CN did not show monomodal and wide fluorescence spectrum in dilute solution, it can be inferred that introduction of the thiophene ring at the central position shifted the fluorescence spectrum to a longer wavelength without any intramolecular charge transfer interaction.
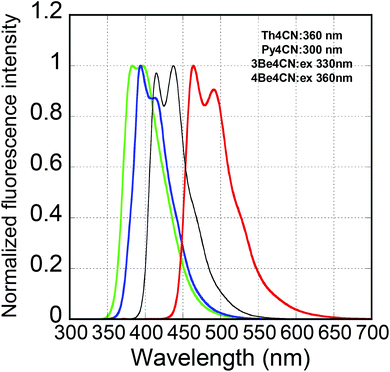 | ||
| Fig. 3 Solution-state fluorescence spectra of Th4CN (red line), Py4CN (blue line), 3Be4CN (green line), and 4Be4CN (black line). | ||
Table 1 summarises the photophysical properties of the three compounds. Py4CN showed the highest fluorescence quantum efficiency (Φf) of 0.80, while those of Th4CN and 3Be4CN were 0.08 and 0.12, respectively. This reveals that the introduction of a thiophene ring lowered the Φf value. The Φf value of 4Be4CN (0.61) was larger than that of 3Be4CN, suggesting that the V-shaped structure could reduce the Φf value. The fluorescence lifetimes (τf) of the three compounds were in the order of Py4CN (2.3 ns) > 3Be4CN (1.8 ns) > Th4CN (0.3 ns). The kr values were calculated as kr = Φf/τf; Py4CN showed a higher kr value (3.5 × 10⁸ s−1) than 2.6 × 10⁸ s−1 and 0.7 × 10⁸ s−1 of Th4CN and 3Be4CN, respectively.
| Th4CN | Py4CN | 3Be4CN | 4Be4CN | |
|---|---|---|---|---|
| Φf | 0.08 | 0.80 | 0.12 | 0.61 |
| τf/ns | 0.3 | 2.3 | 1.8 | 0.7 |
| kr/s−1 | 2.6 × 10⁸ | 3.5 × 10⁸ | 0.7 × 10⁸ | 8.7 × 10⁸ |
| Φf | 0.06 | 0.26 | 0.10 | 0.45 |
| τf/ns | 3.1 | 1.0 | 3.2 | 15.0 |
| kr/s−1 | 0.2 × 10⁸ | 2.6 × 10⁸ | 0.3 × 10⁸ | 0.3 × 10⁸ |
Basic optical properties in the solid
Fig. 4 shows the fluorescence spectra of the as-evaporated films of the three compounds. The fluorescence spectrum of the as-evaporated Th4CN film showed one peak (at 553 nm) and one shoulder (at ∼530 nm). Similarly, the fluorescence spectra of Py4CN and 3Be4CN were bimodal (with peaks at 404 and 421 nm) and monomodal (with a peak at 392 nm), respectively. Compared with the solution-state fluorescence spectrum of Th4CN, the spectrum of the as-evaporated Th4CN film shifted by ∼100 nm. The FWHM of the as-evaporated film spectrum was 110 nm, wider than that of the solution-state spectrum, suggesting that the as-evaporated Th4CN film shows an intermolecular charge transfer interaction effect, which is not seen in solution. This phenomenon was also seen in other BSD systems. The emission spectrum of CN-substituted BSD solid, (2Z,2′Z)-3,3′-(2,5-dimethoxy-1,4-phenylene)bis(2-(4-butoxyphenyl)acrylonitrile) (β-MODBDCS), also shifted to longer wavelengths by ∼100 nm than that of the solution-state spectrum, and its FWHM was ∼1.7 times larger than that of the solution-state spectrum.35 We concluded that this was due to the intermolecular charge transfer interaction.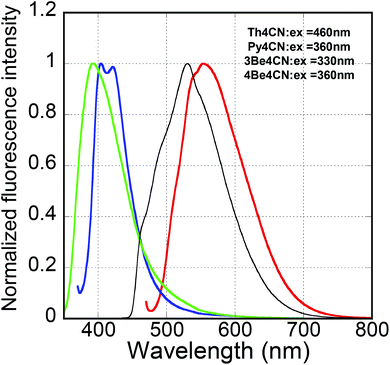 | ||
| Fig. 4 Fluorescence spectra of the as-evaporated films of Th4CN (red line), Py4CN (blue line), 3Be4CN (green line), and 4Be4CN (black line). | ||
The fluorescence spectra of the as-evaporated Py4CN and 3Be4CN films were located at almost the same wavelength as their solution-state spectra. Furthermore, the FWHMs of Py4CN and 3Be4CN were almost the same as those of the solution-state spectra. The as-evaporated 4Be4CN film showed a monomodal and wide fluorescence spectrum due to its intermolecular charge transfer interaction.26 However, the fluorescence spectrum of the as-evaporated 3Be4CN film was similar to that obtained in solution, suggesting that 3Be4CN shows no intermolecular charge transfer interaction. The absorption edges of the as-evaporated Th4CN, Py4CN and 3Be4CN films, determined from the excitation spectra, were 517, 418, and 374 nm, respectively, and these were shifted to longer wavelengths by 61, 26, and 14 nm, respectively, from the absorption edges in their solutions. The longer red shift of the absorption edge for the as-evaporated Th4CN film than those of the other two films was attributed to the intermolecular charge transfer interaction.
Table 1 also summarises the photophysical properties of the as-evaporated films of the three compounds. The Φf value of Py4CN was the highest (0.26) among the three compounds. However, the Φf value of the as-evaporated Py4CN films became lower than that in the dilute solution (0.80). The Φf values of Th4CN and 3Be4CN were 0.06 and 0.10, respectively, slightly less than the corresponding values in their solutions. The τf values of Th4CN, Py4CN, and 3Be4CN were 3.1, 1.0, and 3.2 ns, respectively. Generally, τf values in the solid states are larger than those in the solution state. The τf of the as-evaporated Py4CN film was shorter than that in the solution state. Only Py4CN showed kr > 1.0 × 10⁸ s−1, because τf of Py4CN was 1.0 ns, even in the as-evaporated films. The Φf values of Th4CN and 3Be4CN were ∼0.1, and their τf values were more than 3 ns, causing the kr values of Th4CN and 3Be4CN to be less than 1.0 × 10⁸ s−1.
Slightly bluish-white emission from Py4CN pristine crystals
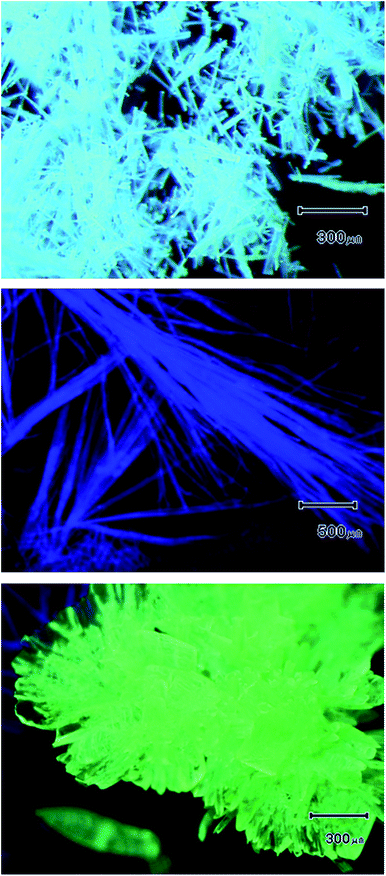
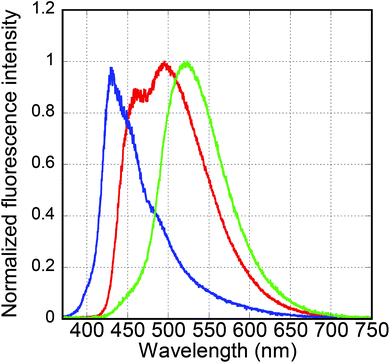
Fig. 5 shows the photomicrographs of the Py4CN pristine crystals under irradiation at 365 nm. These crystals were obtained from re-crystallisation, and emitted a slightly bluish-white colour. After the Py4CN crystals were dissolved in chlorobenzene, this solution was added dropwise on a polydimethylsiloxane (PDMS) substrate, followed by distilling off the chlorobenzene. If the chlorobenzene was dried relatively quickly (with an open system at 26–27 °C), needle-like crystals were produced, emitting a blue fluorescent glow (see the middle image in Fig. 5). On the other hand, if the chlorobenzene was dried relatively slowly by distilling off the solvent while under cover with a Petri dish, the crystals emitted a yellow-green fluorescent glow (the bottom image in Fig. 5). From these results, it can be concluded that the slightly bluish-white luminescent crystals are a mixture of blue and yellow-green luminescent crystals.Fig. 6 shows the emission spectra of the Py4CN pristine crystals under 365 nm irradiation. The emission spectrum was spread from near 420 nm to around 700 nm, covering almost the entire visible light range. Fig. 6 also shows the blue emission spectrum of the needle-like crystals, with a peak at 429 nm. The spectrum of the crystals for yellow-green fluorescence was monomodal with a peak of 523 nm. In Fig. 6, the rising edge on the short-wavelength side for the pristine crystal was more towards the longer-wavelength side than that of the blue-light-emitting crystal. The reason for this is believed to be the absorption of blue light emission by the yellow-green fluorescence crystal.
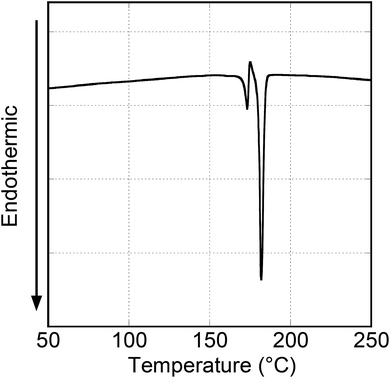
Fig. 7 shows the DSC thermogram of the first heating scan of the Py4CN pristine crystal. This thermogram had two endothermic peaks at 173 and 182 °C. Observation under a polarising microscope revealed that the melting points of the crystals emitting blue and yellow-green fluorescence were 170 and 178 °C, respectively. These suggest that the two peaks of the DSC thermogram for the pristine crystal correspond to melting points of the two crystals emitting blue and yellow-green fluorescence. Considering the peak intensity ratio of the DSC curve, it was found that in the pristine crystals, the crystals emitting yellow-green fluorescence were significantly more abundant than those emitting blue fluorescence.
Fig. 8 shows XRD profiles of the powder crystals for blue and yellow-green emissions. A lot of peaks were observed in both crystals. There were significant differences in the 2θ range from 10° to 15° between the two crystals. In the range described above, the crystals emitting blue fluorescence exhibited two peaks (13.7 and 14.8°), while the crystals emitting yellow-green fluorescence showed five peaks (at 2θ = 10.7°, 11.8°, 12.6°, 13.3°, and 13.6°), and the positions of the peaks for both the crystals were different. The XRD profile of the pristine crystals obtained from re-crystallisation is also shown in Fig. 8.
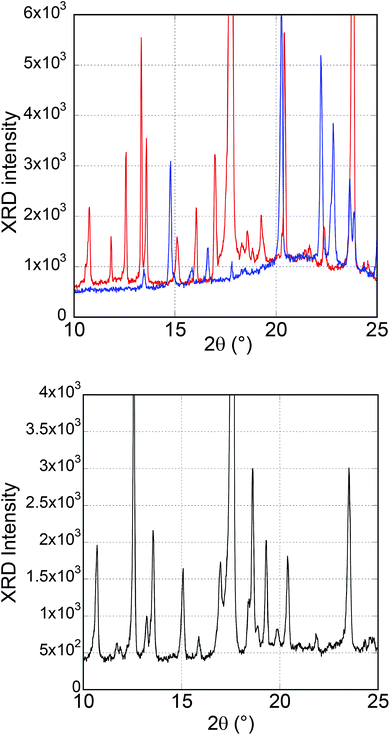 | ||
| Fig. 8 XRD profiles. (Upper) The powder crystals emitting blue (blue line) and yellow-green (red line) fluorescence; (Lower) the pristine crystal. | ||
In the XRD patterns of the pristine crystals, the peaks which could be attributed to the yellow-green fluorescence-emitting crystals had high intensities, reflecting the high composition ratio of the crystals, as suggested by the DSC measurement result. Five peaks were observed in the 2θ range 10–15° in the XRD patterns of the pristine crystals, and although these peak intensities were different from those of the crystal emitting yellow-green fluorescence, the peak positions were almost the same. On the other hand, the peaks assigned to the crystal emitting blue fluorescence were not as sharp as those of the yellow-green fluorescence crystals. This is probably because of the lower composition ratio of the blue-fluorescence crystals than that of the yellow-green-fluorescence crystals.
A commercial white LED is composed of a diode that emits blue light (around 455 nm) and a phosphor that absorbs the blue light emission and emits yellowish-green light (around 560 nm). If the emission wavelengths of the two crystals can be shifted to the longer wavelength side by 30 nm, it can function as a singular source of white light.
Photoelectronic properties
These three novel compounds can be used as additives in organic solar cells, organic light-emitting diode, etc. Thus, photophysical properties, especially the ionisation potential (IP) values of the three compounds were considered necessary for study.Table 2 shows that the IP values of the three compounds studied decreased in the order of Th4CN (−5.94 eV) > 3Be4CN (−6.53 eV) > Py4CN (−6.62 eV). Introduction of the CN group lowered the IP value, and thus, the IP value of 4Be4CN was −6.09 eV,26 suggesting that the V-shaped structure of 3Be4CN is more susceptible to the effect of the CN group than the linear 4Be4CN molecule. The IP value of Py4CN was −6.62 eV, higher than that of 3Be4CN. If the benzene ring was electronically neutral, the pyridine ring was slightly electronically negative or electron-withdrawing, compared to benzene. The IP value of Th4CN was −5.94 eV, much higher than that of 3Be4CN, meaning that the thiophene ring is more electronically positive and electron-donating compared to the benzene ring. Table 2 also shows the bandgap energies and the LUMO levels, estimated from the absorption edges of the as-evaporated films.
| Th4CN | Py4CN | 3Be4CN | 4Be4CN | |
|---|---|---|---|---|
| IP value (HOMO) (eV) | −5.94 | −6.62 | −6.53 | −6.09 |
| Bandgap (eV) | 2.40 | 2.97 | 3.32 | 2.79 |
| LUMO (eV) | −3.54 | −3.65 | −3.21 | −3.30 |
Table 3 exhibits the calculated HOMO and LUMO values of the four compounds. The calculated HOMO values were generally higher than the measured IP values. The trend of the calculated values was similar to that of the measured ones; the calculated HOMO values also decreased in the same order of Th4CN (−5.44 eV) > 4Be4CN (−5.63 eV) > 3Be4CN (−5.86 eV) > Py4CN (−6.00 eV) as the measured IP values. On the other hand, the trend of the measured LUMO values (Py4CN (−3.65 eV) < Th4CN (−3.54 eV) < 4Be4CN (−3.30 eV) < 3Be4CN (−3.21 eV)) was different from that of the calculated ones (Th4CN (−2.62 eV) < 4Be4CN (−2.44 eV) < Py4CN (−2.31 eV) < 3Be4CN (−2.22 eV)). The measured bandgap energies of the four compounds increased in the order of Th4CN (2.40 eV) < 4Be4CN (2.79 eV) < Py4CN (2.97 eV) < 3Be4CN (3.32 eV), and the calculated LUMO bandgap energies increased in the order of Th4CN (2.83 eV) < 4Be4CN (3.19 eV) < 3Be4CN (3.63 eV) < Py4CN (3.69 eV). The difference in this tendency was due to the difference in the bandgap energy of Py4CN. The calculated bandgap energy of Py4CN (3.69 eV) was significantly larger than the measured one (2.97 eV): the difference between the calculated and measured bandgap energies for Py4CN was 0.72 eV, much larger than those for Th4CN (0.43 eV), 3Be4CN (0.31 eV), and 4Be4CN (0.40 eV). If the difference in the bandgap energy of Py4CN is about the same as those of the other compounds, the trends of the measured and calculated LUMO values would be similar.
| Th4CN | Py4CN | 3Be4CN | 4Be4CN | |
|---|---|---|---|---|
| HOMO (eV) | −5.44 | −6.00 | −5.86 | −5.63 |
| Bandgap (eV) | 2.83 | 3.69 | 3.63 | 3.19 |
| LUMO (eV) | −2.62 | −2.31 | −2.22 | −2.44 |
Localizations of the HOMO and LUMO and optimised structures for the four compounds are shown in ESI.†
Conclusions
Three novel BSDs, with thiophene, pyridine, and benzene rings in central positions, were synthesised. Th4CN was located at the longer-wavelength side compared to 3Be4CN and Py4CN in both their solution-state absorption and emission spectra. Intermolecular charge transfer interaction was observed in the Th4CN solid film. The IP values of Th4CN were higher than those of Py4CN and 3Be4CN, suggesting that thiophene rings have more electron-donating ability than pyridine and benzene. The IP value of Py4CN was the lowest among the three compounds. The trends of the measured and calculated values of IP (HOMO) for the four compounds were similar. Furthermore, Py4CN showed high emission ability, and the Py4CN pristine crystals emitted a slightly bluish-white fluorescence. Based on the DSC and XRD measurements, as well as the emission spectrum of the pristine crystals and the melting points for the crystals emitting blue and yellow-green fluorescence, it was found that the pristine crystal is a mixture of these crystals.Conflicts of interest
There are no conflicts to declare.Acknowledgements
The authors thank Dr Takashi Funaki for his helpful discussion and valuable support. The theoretical calculations were performed at the Research Center for Computational Science, Okazaki, Japan.Notes and references
- W. Hua, X. Du, W. Su, W. Lin and D. Zhang, AIP Adv., 2014, 4, 027103 CrossRef.
- S. Krotkus, D. Kasemann, S. Lenk, K. Leo and S. Reineke, Light: Sci. Appl., 2016, 5, e16121 CrossRef CAS PubMed.
- M. D. Smith and H. I. Karunadasa, Acc. Chem. Res., 2018, 51, 619 CrossRef CAS.
- J. Li, Q. Liang, J.-Y. Hong, J. Yan, L. Dolgov, Y. Meng, Y. Xu, J. Shi and M. Wu, ACS Appl. Mater. Interfaces, 2018, 10, 18066 CrossRef CAS PubMed.
- L. G. T. A. Duarte, J. C. Germino, J. F. Berbigier, C. A. Barboza, M. M. Faleiros, D. A. Simoni, M. T. Galante, M. S. Holanda, F. S. Rodembusch and T. D. Z. Atvars, Phys. Chem. Chem. Phys., 2019, 21, 1172 RSC.
- E. W. Meijer and A. P. H. J. Schenning, Nature, 2002, 419, 353 CrossRef CAS.
- S. R. Forrest, Nature, 2004, 428, 911 CrossRef CAS PubMed.
- P. M. Beaujuge, C. M. Amb and J. R. Reynolds, Acc. Chem. Res., 2010, 43, 1396 CrossRef CAS PubMed.
- A. R. Murphy and J. M. J. Fréchet, Chem. Rev., 2007, 107, 1066 CrossRef CAS PubMed.
- S. Hotta and T. Yamao, J. Mater. Chem., 2011, 21, 1295 RSC.
- J. Gierschner and S. Y. Park, J. Mater. Chem. C, 2013, 1, 5818 RSC.
- S. Hotta, T. Yamao, S. Z. Bisri, T. Takenobu and Y. Iwasa, J. Mater. Chem. C, 2014, 2, 965 RSC.
- J. Gierschner, S. Varghese and S. Y. Park, Adv. Opt. Mater., 2016, 4, 348 CrossRef CAS.
- T. Yasuda, M. Saito, H. Nakamura and T. Tsutsui, Appl. Phys. Lett., 2006, 89, 182108 CrossRef.
- R. Kabe, H. Nakanotani, T. Sakanoue, M. Yahiro and C. Adachi, Adv. Mater., 2009, 21, 4034 CrossRef CAS.
- J. T. Bloking, X. Han, A. T. Higgs, J. P. Kastrop, L. Pandey, J. E. Norton, C. Risko, C. E. Chen, J.-L. Brédas, M. D. McGehee and A. Sellinger, Chem. Mater., 2011, 23, 5484 CrossRef CAS.
- B.-K. An, S.-K. Kwon, S.-D. Jung and S. Y. Park, J. Am. Chem. Soc., 2002, 124, 14410 CrossRef CAS PubMed.
- C. J. Bhongale, C.-W. Chang, C.-S. Lee, E. W.-G. Diau and C.-S. Hsu, J. Phys. Chem. B, 2005, 109, 13472 CrossRef CAS PubMed.
- S. Kim, Q. Zheng, G. S. He, D. J. Bharali, H. E. Pudavar, A. Baev and P. N. Prasad, Adv. Funct. Mater., 2006, 16, 2317 CrossRef CAS.
- J. He, B. Xu, F. Chen, H. Xia, K. Li, L. Ye and W. Tian, J. Phys. Chem. C, 2009, 113, 9892 CrossRef CAS.
- B.-R. Gao, H.-Y. Wang, Y.-W. Hao, L.-M. Fu, H.-H. Fang, Y. Jiang, L. Wang, Q.-D. Chen, H. Xia, L.-Y. Pan, Y.-G. Ma and H.-B. Sun, J. Phys. Chem. B, 2010, 114, 128 CrossRef CAS PubMed.
- Y. Hong, J. W. Y. Lam and B. Z. Tang, Chem. Soc. Rev., 2011, 40, 5361 RSC.
- S.-J. Yoon and S. Y. Park, J. Mater. Chem., 2011, 21, 8338 RSC.
- H. Mochizuki, Appl. Phys. Express, 2019, 12, 041007 CrossRef CAS.
- H. Mochizuki, Bull. Chem. Soc. Jpn., 2017, 90, 327 CrossRef CAS.
- H. Mochizuki, Jpn. J. Appl. Phys., 2017, 56, 022401 CrossRef.
- H. Mochizuki, Bull. Chem. Soc. Jpn., 2018, 91, 444 CrossRef CAS.
- Y. Shibata, T. Kono, H. Usui and Y. Yoshida, Chem. Lett., 2015, 44, 680 CrossRef CAS.
- M. J. Frisch, G. W. Trucks, H. B. Schlegel, G. E. Scuseria, M. A. Robb, J. R. Cheeseman, G. Scalmani, V. Barone, G. A. Petersson, H. Nakatsuji, X. Li, M. Caricato, A. V. Marenich, J. Bloino, B. G. Janesko, R. Gomperts, B. Mennucci, H. P. Hratchian, J. V. Ortiz, A. F. Izmaylov, J. L. Sonnenberg, D. Williams-Young, F. Ding, F. Lipparini, F. Egidi, J. Goings, B. Peng, A. Petrone, T. Henderson, D. Ranasinghe, V. G. Zakrzewski, J. Gao, N. Rega, G. Zheng, W. Liang, M. Hada, M. Ehara, K. Toyota, R. Fukuda, J. Hasegawa, M. Ishida, T. Nakajima, Y. Honda, O. Kitao, H. Nakai, T. Vreven, K. Throssell, J. A. Montgomery Jr, J. E. Peralta, F. Ogliaro, M. J. Bearpark, J. J. Heyd, E. N. Brothers, K. N. Kudin, V. N. Staroverov, T. A. Keith, R. Kobayashi, J. Normand, K. Raghavachari, A. P. Rendell, J. C. Burant, S. S. Iyengar, J. Tomasi, M. Cossi, J. M. Millam, M. Klene, C. Adamo, R. Cammi, J. W. Ochterski, R. L. Martin, K. Morokuma, O. Farkas, J. B. Foresman and D. J. Fox, Gaussian 16, Revision C.01, Gaussian, Inc., Wallingford CT, 2019 Search PubMed.
- A. D. Becke, J. Chem. Phys., 1993, 98, 5648 CrossRef CAS.
- A. D. Becke, Phys. Rev. A: At., Mol., Opt. Phys., 1988, 38, 3098 CrossRef CAS PubMed.
- C. Lee, W. Yang and R. G. Paar, Phys. Rev. B: Condens. Matter Mater. Phys., 1980, 37, 785 CrossRef PubMed.
- R. Ditchfield, W. J. Hehre and J. A. Pople, J. Chem. Phys., 1971, 54, 724 CrossRef CAS.
- M. Cossi, N. Rega, G. Scalmani and V. Barone, J. Comput. Chem., 2003, 24, 669 CrossRef CAS PubMed.
- S.-J. Yoon, S. Varghese, S. K. Park, R. Wannemacher, J. Gierschner and S. Y. Park, Adv. Opt. Mater., 2013, 1, 232 CrossRef.
Footnote |
| † Electronic supplementary information (ESI) available. See DOI: 10.1039/c9ra09576d |
| This journal is © The Royal Society of Chemistry 2020 |


