
 Open Access Article
 This Open Access Article is licensed under a Creative Commons Attribution-Non Commercial 3.0 Unported Licence
Zinc(II)-based coordination polymer encapsulated Tb3+ as a multi-responsive luminescent sensor for Ru3+, Fe3+, CrO42−, Cr2O72− and MnO4−†
Yuandi Wua,
Dongyang Liua,
Meihua Lina and
Jing Qian *abc
*abc
aCollege of Chemistry, Tianjin Normal University, Tianjin 300387, P. R. China. E-mail: qianjinger@aliyun.com
bTianjin Key Laboratory of Structure and Performance for Functional Molecules, Tianjin Normal University, Tianjin 300387, P. R. China
cKey Laboratory of Inorganic–Organic Hybrid Functional Materials Chemistry, Tianjin Normal University, Ministry of Education, Tianjin 300387, P. R. China
First published on 6th February 2020
Abstract
A zinc(II)-based coordination polymer (CP), namely [Zn(modbc)2]n (Zn-CP) (modbc = 2-methyl-6-oxygen-1,6-dihydro-3,4′-bipyridine-5-carbonitrile), has been synthesized and characterized. Single-crystal structural determination reveals that Zn-CP is a two-dimensional framework structure with tetranuclear homometallic Zn4(modbc)4 units cross-linked by modbc. The excellent luminescence as well as good stability of Zn-CP do not enable it to have selective sensing capability for different ions. After encapsulation of Tb3+ in Zn-CP, the as-obtained fluorescent functionalized Tb3+@Zn-CP maintained excellent luminescence as well as stability, which made it a highly selective and sensitive multiresponsive luminescent sensor for Ru3+, Fe3+, CrO42−, Cr2O72−, and MnO4− with high sensitivity, good anti-interference performance, and quick response time (∼10 s). The detection limits are 0.27 μM, 0.57 μM, 0.10 μM, 0.43 μM and 0.15 μM, respectively. A possible sensing mechanism was discussed in detail.
1. Introduction
At present, hexavalent chromium (CrO42−, Cr2O72−) as a potential carcinogen mainly exists in natural water and various industrial processes, which can cause serious harm to the environment and human health.1,2 In addition, the extensive application of MnO4− in research experiments and industry has caused serious water pollution.3 On the other hand, Fe3+ affects the activity of hemoglobin and transferrin in organisms. Both excess and deficiency of the normal permissible limit will lead to serious diseases.4,5 The purification and trace detection of ruthenium have been paid attention to,6 and the olefin reaction catalyzed by ruthenium also won the 2005 Nobel Prize in chemistry.7 The development of ion selective sensing is very important in life and environmental science, so new materials for detecting Ru3+, Fe3+, CrO42−, Cr2O72−, and MnO4− have attracted great attention.8–11 To date, various methods and techniques for ion detection have been reported.12–14 Among them, fluorescent chemosensors have attracted extensive research interest due to their remarkable advantages such as fast response, high sensitivity and simplicity.15–173D microporous CPs can produce significant fluorescence signals and visible emission, and has become the most reported chemosensors.18–22 At present, Ln-CPs, compared with transition metal-based CPs, has attracted great interest due to its unique optical characteristics, such as large Stokes shift and long fluorescence lifetime obtained by “antenna effect” of 4f–4f electron transition.19,20,23,24 Recently, lanthanide ions were doped into CPs by post-synthesis method (PSM), and an alternative strategy to construct Ln-CPs and optimize photoluminescence was proposed.25,26 Any desired fluorescent probe can be obtained by changing the molar ratio of reactants.27,28
Some luminescent CPs have been developed in recent years to effectively simultaneously sense Fe3+ and Cr2O72−.29,30 The reported polymer as a fluorescent probe for the specific detection of MnO4− contaminants is still rare to date.31,32 However, there is no multifunctional ion sensor for sensing Ru3+, Fe3+, CrO42−, Cr2O72− and MnO4− at the same time. Moreover, low-dimensional chemosensors with one-dimensional or two-dimensional structures are rarely reported as ion sensors.33 Herein, asymmetric unflexible 2-methyl-6-oxygen-1,6-dihydro-3,4′-bipyridine-5-carbonitrile (modbc) containing coordination N and O atoms, was utilized as an anionic ligand (Scheme 1). A new compound with the formula, [Zn(modbc)2]n (Zn-CP) has been obtained via solvothermal reaction showing a new type of two-dimensional open framework structure. To improve the selectivity of Zn-CP, Tb3+@Zn-CP was obtained via PSM. Tb3+@Zn-CP detect a series of metal ions and anions by taking the advantage of its excellent luminescence and good stability. The results demonstrate that Tb3+@Zn-CP is an efficient multiresponsive sensor for optical detection of Ru3+, Fe3+, CrO42−, Cr2O72− and MnO4− with a fast response of 10 s and lower limit of detection.
 | ||
| Scheme 1 The structure of modbc. | ||
2. Experimental section
2.1 General methods and materials
2.2 Synthesis of [Zn(modbc)2]n (Zn-CP)
A mixture of ZnSO4 (0.05 mmol, 0.008 g) and modbc (0.1 mmol, 0.021 g) was dissolved in 8 mL of DMF/H2O (1![[thin space (1/6-em)]](https://www.rsc.org/images/entities/char_2009.gif) :3), and stirred at room temperature for 15 min. Then the mixture was transferred into a 25 mL Teflon-lined stainless steel vessel. The reactor was heated to 120 °C for 72 h under self-generated pressure, then cooled to ambient temperature at a rate of 2.0 °C h−1. Finally, light yellow bulk-shaped crystals were collected, filtered, washed with H2O (3 × 1 mL), diethylether (3 × 1 mL). The total yields of is ca. 68% based on the metal ions. Elem. anal. calcd for C12H8Zn0.50N3O: C, 59.33; H, 3.32; N, 17.30%. Found: C, 58.63; H, 4.02; N, 16.87%. IR (KBr pellet, cm−1): ν = 3370.13 (vs), 2984.28 (s), 2340.06 (m), 1602.97 (s), 1385.90 (s), 1108.44 (vs), 982.48 (vs), 857.44 (s), 538.28 (vs) (Fig. S1†).
:3), and stirred at room temperature for 15 min. Then the mixture was transferred into a 25 mL Teflon-lined stainless steel vessel. The reactor was heated to 120 °C for 72 h under self-generated pressure, then cooled to ambient temperature at a rate of 2.0 °C h−1. Finally, light yellow bulk-shaped crystals were collected, filtered, washed with H2O (3 × 1 mL), diethylether (3 × 1 mL). The total yields of is ca. 68% based on the metal ions. Elem. anal. calcd for C12H8Zn0.50N3O: C, 59.33; H, 3.32; N, 17.30%. Found: C, 58.63; H, 4.02; N, 16.87%. IR (KBr pellet, cm−1): ν = 3370.13 (vs), 2984.28 (s), 2340.06 (m), 1602.97 (s), 1385.90 (s), 1108.44 (vs), 982.48 (vs), 857.44 (s), 538.28 (vs) (Fig. S1†).
2.3 Preparation of Tb3+@Zn-CP
Tb3+@Zn-CP was prepared by soaking 200 mg powder of Zn-CP in 1.0 mM Tb(NO3)3 aqueous solution for 24 h, centrifuged, washed with Milli-Q water to remove the remaining Tb3+, and dried under 60 °C vacuum conditions for tonight.2.4 General fluorescence measurements
Zn-CP and Tb3+@Zn-CP (100 μM) were well-dispersed in DMF by sonicating for 30 min to obtain stock solution and stored in a 4 °C refrigerator. The aqueous solution of nitrate salt or chloride of Ag+, Pb2+, Mn2+, Hg2+, Ni2+, Ca2+, Cd2+, Zn2+, Co2+, Cu2+, Fe3+, Ru3+ (1.0 mM) were prepared for luminescent experiments. Generally, ferrous salt is easy to be oxidized in the air, but it is relatively stable and not easy to be oxidized after forming double salt, so we chose double salt (NH4)2Fe(SO4)2 to prepare the aqueous solution of Fe2+. In addition, the same concentrations (1.0 mM) of aqueous solution containing potassium salt of I−, C2O42−, CrO42−, Cr2O72−, SO42−, CO32−, HCO3−, PO43−, MnO4− were also prepared.Fluorescence emission spectra of Zn-CP and Tb3+@Zn-CP in 1 cm path length quartz cuvette were measured by a Spex Fluorog-2 spectrofluorimeter. 1.0 mM above ions were added to a quartz cuvette for luminescence detection immediately by excitation with 330 nm. The slit size for both excitation and emission was 4 nm. The fluorescence stability of Zn-CP and Tb3+@Zn-CP with different pH values were investigated in 5 mM Tris–HCl/NaCl buffer. The Stern–Volmer equation: I0/I = 1 + Ksv[Q] was applied to judge the quenching effect.36 The detection limit was calculated according to 3σ/k recommended by IUPAC, where the standard deviation, σ value was estimated by 15 repeated fluorescent measurements of Zn-CP and Tb3+@Zn-CP, and k value was obtained using a calibration curve of I vs. [Q].37
3. Results and discussion
3.1 Description of structure
A 2D CP was synthesized by self-assemble of ZnSO4 and modbc by one-pot solvothermal method with a yield of ∼68%. X-ray crystallographic analysis shows that Zn-CP crystallizes in the tetragonal space group P43212, Z = 28 (Table S1†). The symmetric unit consists of one Zn2+ center and two modbc anions. In Zn-CP, each Zn(II) center has a distorted octahedral geometry and it is connected to two O atoms from two modbc ligands and four N atoms from four modbc ligands, as shown in Fig. 1a. Fig. 1b displays that each modbc molecule adopts tridentate coordination mode. The Zn–O distance is 2.390 Å, while the Zn–N length is in the range of 2.089–2.104 Å. The L–Zn–L (L = O, N) bond angle is in the scope of 59.10(8)–173.81(11)° (Table S2†). In addition, the structure of Zn-CP is characterized in that each zinc chain serves as a secondary construction unit and is further connected into a 2D framework through modbc ligands, and the framework comprises the tetranuclear homometallic Zn4(modbc)4 units with different Zn1⋯Zn1 distances of 10.741 and 15.187 Å (Fig. 1c), which is larger than Cd1⋯Cd1 distances of 10.434 and 14.756 Å.38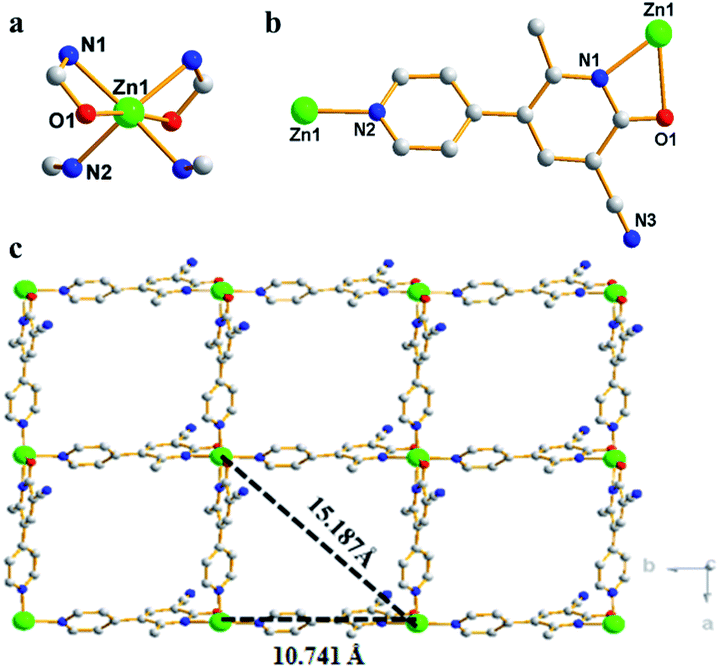 | ||
| Fig. 1 (a) Coordination environment of Zn2+ in Zn-CP. (b) Coordination mode of modbc molecule. (c) Two-dimensional reticulated structure of Zn-CP along the c axis; red, O; gray, C; green, Zn1; blue, N. All H atoms are omitted for clarity. | ||
3.2 Property characterization
TGA analysis of Zn-CP was measured to evaluate its thermal stability at ≤500 °C, as shown in Fig. S2.† PXRD confirmed that Zn-CP has phase purity and excellent stability in H2O, common organic solvents and metal salt aqueous system (Fig. S3†). In addition, the corresponding PXRD after the sample was heated at different temperatures for 8 h showed that Zn-CP skeleton still had excellent chemical stability at ≤180 °C, as shown in Fig. S4.† High stability of Zn-CP may be due to the synergy between N/O atoms and Zn2+ according to Pearson's hard/soft acid–base principle,39,40 or relatively high density 2D framework, and the synergy effect of these factors.41 Obviously, the Zn-CP framework with excellent chemical stability provides the possibility for its practical application as an ion sensor.Then, Zn-CP was soaked in Tb(NO3)3 aqueous solution to obtain Tb3+@Zn-CP. The crystal integrity of Zn-CP remained unchanged after doping Tb3+, which was confirmed by PXRD (Fig. S5†). PXRD of Tb3+@Zn-CP after soaking in FeCl3, RuCl3, KMnO4, K2CrO4 and K2Cr2O7 solutions for 12 h, respectively, also shows that it has excellent crystal integrity and chemical stability. In order to obtain the amount of Tb3+ doped in Zn-CP, ICP analysis on Tb3+@Zn-CP was performed (Table S3†). The result shows that the ratio of Zn2+ and Tb3+ is approximately 80:1. Tb3+@Zn-CP and Zn-CP were further analyzed by X-ray photoelectron spectroscopy (XPS), as shown in Fig. S6.† After being treated with Tb3+, three new peaks corresponding to Tb 3d3/2, Tb 3d5/2, Tb 4d appeared at 1277.5, 1243.0 and 153.0 eV, thus the existence of Tb3+ in the composite material can be determined.42
3.3 Fluorescence properties
Considering that Zn-CP composed of d10 ions and aromatic ligand may be a promising luminescent material,43 the fluorescence properties of Zn-CP were investigated in 5 mM Tris–HCl/NaCl buffer (pH 7.0) at room temperature. Under 312 and 330 nm excitation, the luminescence of Zn-CP and Tb3+@Zn-CP in aqueous solution show the intense emission centered at 395 and 390 nm, respectively, while the luminescence of modbc exhibits a similar emission centered at 475 nm at 415 nm excitation. The fluorescence emission of Zn-CP and Tb3+@Zn-CP also show good stability within 12 h (Fig. S7†). In addition, the fluorescence stability of Zn-CP and Tb3+@Zn-CP dispersed in different pH 1.0–13.0 solution were performed, as shown in Fig. S8.† Obviously, Tb3+@Zn-CP framework with excellent chemical stability than Zn-CP offers the possibility for its practical application based on the fact that industrial effluent and polluted rivers are usually acidic or alkaline.443.4 Detection of ions
To detect water pollution, we explored the potential detection of Zn-CP to various ions. 1 mM aqueous solution of Ag+, Pb2+, Mn2+, Hg2+, Ni2+, Ca2+, Cd2+, Zn2+, Co2+, Cu2+, Fe3+, Fe2+, Ru3+, I−, C2O42−, CrO42−, Cr2O72−, SO42−, CO32−, HCO3−, PO43− and MnO4− were prepared, and we investigated their effects on the fluorescence intensity of Zn-CP. All experimental cations have a remarkable effect on the luminescence intensity of Zn-CP (Fig. S9†), and all experimental inions show negligible effect on the luminescence intensity of Zn-CP (Fig. S10†) indicating that Zn-CP shows no selective sensing ability toward different both cations and anions.To improve the selectivity of Zn-CP, Tb3+@Zn-CP was obtained via PSM. A series of luminescence experiments were carried out by the addition of different metal ions to Tb3+@Zn-CP. Other metal ions have a negligible effect on the luminescence intensity of Tb3+@Zn-CP except Ru3+ and Fe3+, indicating that Tb3+@Zn-CP can detect Ru3+ and Fe3+ selectively among coexisting ions (Fig. 2). Furthermore, the titration of Tb3+@Zn-CP (10 μM) with Ru3+ or Fe3+ (0.0–90 μM) were performed, as shown in Fig. S11 and S12.† With the gradual addition of Ru3+ or Fe3+, the fluorescence of Tb3+@Zn-CP solution was obviously quenched.
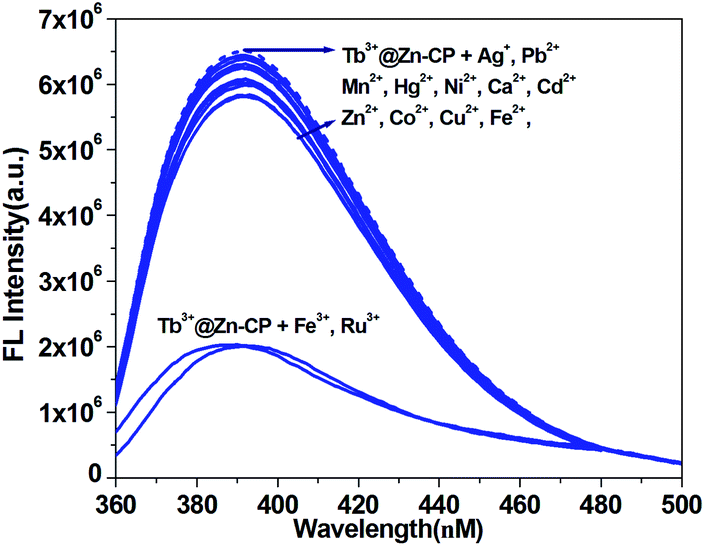 | ||
| Fig. 2 Luminous intensity of Tb3+@Zn-CP upon different ions (Ru3+, Ag+, Cd2+, Zn2+, Pb2+, Ca2+, Mn2+, Cu2+, Co2+, Ni2+, Fe2+, Hg2+ and Fe3+) in 5 mM Tris–HCl/NaCl buffer (pH 7.0). [Tb3+@Zn-CP] = 10 μM and [cations] = 50 μM. λex: 330 nm, λF: 390 nm, slit width: 4 nm. | ||
Compared with Ru3+, the influence of Fe3+ on the luminescence intensity of Tb3+@Zn-CP is relatively smaller (Fig. 3a and b). To better analyze, the quenching sensitivity was quantified by the Stern–Volmer equation: I0/I = 1 + Ksv[Q].45 At low concentrations (0–20 μM), a good linearity plot was obtained with correlation coefficient of 0.997 for Fe3+ and 0.994 for Ru3+, respectively. Also, the quenching constant (Ksv) were determined to be 7.2 ± 0.56 × 10³ M−1 for Fe3+ and 1.72 ± 0.19 × 10⁴ M−1 for Ru3+, respectively. However, the Stern–Volmer plot deviated from the straight line at higher concentrations due to self-absorption or energy transfer processes.46,47 In addition, the LODs based on Tb3+@Zn-CP were also obtained to be 0.57 ± 0.06 μM for Fe3+ and 0.27 ± 0.01 μM for Ru3+, respectively (Fig. S13†). The calculated LOD value is far below MCL for Fe3+ in drinking water as required by U.S. EPA standard (5.36 μM).48 The performance of Tb3+@Zn-CP composite for sensing Ru3+ and Fe3+ is comparable with some recently reported MOF composites (Table S4†).
 | ||
| Fig. 3 (a) Relative fluorescence intensity and (b) the corresponding quenching efficiency of Tb3+@Zn-CP vs. different Ru3+ or Fe3+ ion concentrations. λex: 330 nm, λF: 390 nm for Tb3+@Zn-CP, slit width: 4 nm. [Tb3+@Zn-CP] = 10 μM. | ||
To corroborate the practical applicability of Tb3+@Zn-CP as a sensor for Fe3+, we performed a series of anti-jamming experiments (Fig. 4 and S14†). The coexisting ions above mentioned showed negligible influence on the detection of Fe3+. The results confirmed that Tb3+@Zn-CP as a sensor can detect Fe3+ even in the presence of such potential interfering ions. Similarly, Tb3+@Zn-CP as a sensor can detect Ru3+ even in the presence of such potentially interfering ions, as shown in Fig. 4 and S15.† Satisfyingly, the fluorescence response is quite quick, and it is controlled in ≤10 s for detecting both Ru3+ and Fe3+ (Fig. S16†).
 | ||
| Fig. 4 Comparison of the luminescence intensity of Tb3+@Zn-CP: after addition of mixed ions (Ag+, Cd2+, Zn2+, Pb2+, Cr3+, Cu2+, Co2+, Ni2+, Mg2+; total concentration of mixed metal ions is 45 μM), and followed by addition of Fe3+ or Ru3+ ([Fe3+] = 5 or 45 μM); ([Ru3+] = 5 or 45 μM). λex: 330 nm, λF: 390 nm, slit width: 4 nm. | ||
To explore the potential selectivity of Tb3+@Zn-CP for various anions, potassium salts of I−, C2O42−, CrO42−, Cr2O72−, SO42−, CO32−, HCO3−, PO43− and MnO4− were added to an aqueous of Tb3+@Zn-CP (10 μM) and the fluorescence of Tb3+@Zn-CP was observed (Fig. 5). Notably, the fluorescence intensity of Tb3+@Zn-CP shows a irregular quenching with addition of CrO42−, Cr2O72− and MnO4−, respectively, however other anions show a negligible influence, which indicates that Tb3+@Zn-CP can detect CrO42−, Cr2O72− and MnO4− selectively.
 | ||
| Fig. 5 Luminous intensity of Tb3+@Zn-CP upon different ions (I−, C2O42−, CrO42−, Cr2O72−, SO42−, CO32−, HCO3−, PO43− and MnO4−) in 5 mM Tris–HCl/NaCl buffer (pH 7.0) except CrO42− (pH 8.0), Cr2O72− (pH 6.0). [Tb3+@Zn-CP] = 10 μM and [ions] = 40 μM. λex: 330 nm, λF: 390 nm, slit width: 4 nm. | ||
To investigate the fluorescence sensitivity ability of Tb3+@Zn-CP for detecting CrO42−, Cr2O72− and MnO4−, the corresponding luminescence spectra of Tb3+@Zn-CP (10 μM) were recorded by ion concentration titration (0.0–70 μM), as shown in Fig. S17–S19.† With the gradual addition of CrO42−, Cr2O72− and MnO4−, respectively, the fluorescence of Tb3+@Zn-CP were significant quenched. The influence order of three ions on luminous intensity of Tb3+@Zn-CP is as follows: CrO42− > MnO4− > Cr2O72−, as shown in Fig. 6a and b. Quantitatively, the quenching sensitivity was quantified by the Stern–Volmer equation.45 At low concentrations for CrO42− (0–20 μM) and for MnO4− (0–30 μM), a good linearity plot was obtained with correlation coefficient of ∼0.99. Also, the quenching constant (Ksv) were determined to be 1.18 ± 0.16 × 10⁵ M−1 for CrO42− and 7.44 ± 0.77 × 10⁴ M−1 for MnO4−, respectively. However, the Stern–Volmer plot deviated from the straight line at higher concentrations due to self-absorption or energy transfer processes.46,47 In addition, the LODs based on Tb3+@Zn-CP were also obtained to be 0.10 ± 0.02 μM for CrO42− and 0.15 ± 0.03 μM for MnO4−, respectively (Fig. S20a and b†). However, Fig. S20c† show that the Stern–Volmer plot for Cr2O72− presents a good linear relationship with a correlation coefficient of 0.995. The quenching constant (Ksv) and the value of the detection limit (3σ/k) were evaluated to be 2.49 ± 0.1 × 10⁴ M−1 and 0.43 ± 0.04 μM (S/N = 3), respectively, which also lies well below several MOF fluorescent sensors for detecting CrO42−, Cr2O72− and MnO4− for a specific comparison (Table S5†).
 | ||
| Fig. 6 (a) Relative fluorescence intensity and (b) the corresponding quenching efficiency of Tb3+@Zn-CP vs. different CrO42− (pH 8.0), Cr2O72− (pH 6.0) and MnO4− (pH 7.0) ion concentrations in 5 mM Tris–HCl/NaCl buffer. λex: 330 nm, λF: 390 nm for Tb3+@Zn-CP, slit width: 4 nm. [Tb3+@Zn-CP] = 10 μM. | ||
Furthermore, we measured the fluorescence response of Tb3+@Zn-CP to CrO42−, Cr2O72− and MnO4−, respectively, in the presence of other anions, as shown in Fig. 7 and S21–23.† The CrO42−, Cr2O72− and MnO4−-dependent fluorescence intensity of Tb3+@Zn-CP was not affected by the presence of coexisting anions such as I−, C2O42−, SO42−, CO32−, HCO3− and PO43−. Therefore, Tb3+@Zn-CP has desirable anti-interference ability for detecting CrO42−, Cr2O72− and MnO4−. Satisfyingly, the response time is quite short, and it can control in ∼10 s (Fig. S24†).
 | ||
| Fig. 7 Comparison of the luminescence intensity of Tb3+@Zn-CP: after addition of mixed ions (I−, C2O42−, SO42−, CO32−, HCO3− and PO43−; total concentration of mixed ions is 30 μM), and followed by addition of CrO42−, Cr2O72− and MnO4− (5 or 30 μM). λex: 330 nm, λF: 390 nm, slit width: 4 nm. | ||
3.5 The underlying mechanism of luminescence quenching
The crystal integrity of Tb3+@Zn-CP remained unchanged after soaking in aqueous solutions of FeCl3, RuCl3, KMnO4, K2CrO4 and K2Cr2O7, respectively, which was confirmed by PXRD, indicating that the luminescence quenching was not caused by the collapse of the main framework structure (Fig. S5†).49 The possible sensing mechanism of fluorescence quenching by ions were determined by further analysis.For MnO4− ion detection, the result of ICP analysis show that the ratio of Zn2+/Tb3+/Mn2+ is approximately 108:1:12 comparing with Zn2+/Tb3+ (80:1) in Tb3+@Zn-CP, which ion exchange is involved in the detection of MnO4− by Tb3+@Zn-CP (Table S3†).50 In addition, the color of the solid sample after immersion in KMnO4 aqueous solution was observed to have change in both ultraviolet and ordinary light, which also confirmed MnO4− was diffused into 2D structure of Tb3+@Zn-CP (Fig. S25†). We further measured X-ray photoelectron spectroscopy (XPS) analysis on Tb3+@Zn-CP after soaked in KMnO4, as shown in Fig. S26.† New peak at 642.5 eV appears corresponding to Mn 2p, by which the existence of MnO4− in the composites can be ascertained. The O 1s spectrum of Tb3+@Zn-CP + MnO4− can be fitted into two peaks at 530.0 eV and 531.5 eV, which correspond to carboxyl group oxygen atoms and –OH species, respectively (Fig. S27†). The result shows that carboxyl oxygen atoms of Zn-CP and hydroxyl oxygen atoms of H2O participate in the formation of hydrogen bonds of MnO4−.28 In order to examine the sensing behavior of Tb3+@Zn-CP to MnO4−, titration experiment of Tb3+@Zn-CP (10 μM) with MnO4− was carried out (Fig. S28†). On gradual addition of MnO4− (0–300 μM), the absence intensity of Tb3+@Zn-CP solution is obviously increasing. MnO4− solution shows obvious absorption in the range 300–400 nm, as shown in Fig. S29.† This means that the excitation wavelength of Tb3+@Zn-CP is totally overlapped by the absorption spectra of MnO4−, which demonstrates that transfer of the excitation energy to the emissive center is effectively suppressed by MnO4− ions. In a word, luminescence quenching of Tb3+@Zn-CP by MnO4− originates from three possible approaches: hydrogen bond interaction between MnO4− and the frameworks, ion exchange, and competitive absorption of excitation energy by MnO4−.49,50
For CrO42− and Cr2O72− anion detection, we performed XPS analysis on Tb3+@Zn-CP after soaked in K2CrO4 and K2Cr2O7, respectively, as shown in Fig. S30 and S31.† New peak at 586.0 eV appears corresponding to Cr 2p, by which the existence of Cr2O72−, CrO42− in the composites can be ascertained. To examine the sensing behavior of Tb3+@Zn-CP to CrO42− and Cr2O72−, titration experiment of Tb3+@Zn-CP (10 μM) with CrO42− and Cr2O72− were carried out. On gradual addition of Cr2O72− (0–300 μM), the absence intensity of Tb3+@Zn-CP solution is obviously increasing (Fig. S32†). With gradual addition of CrO42− (0–60 μM), new absorption bands centered at 369 nm appeared with increasing intensity (Fig. S33†). From Fig. S29,† we can see that CrO42− and Cr2O72− solution show obvious absorption in the range 300–400 nm. The luminescence quenching of Tb3+@Zn-CP originates from the competitive absorption of excitation energy of CrO42− and Cr2O72−.51
For the Fe3+ detection process, the mechanism involving an Fe3+–framework interaction, or Fe3+–Zn2+ exchange cannot be excluded. In order to prove our hypothesis, ICP analysis of Tb3+@Zn-CP after doping into Fe3+ was performed (Table S3†). The ratio of Zn2+/Tb3+/Fe3+ is approximately 295:1:12 comparing with Zn2+/Tb3+ (80:1) in Tb3+@Zn-CP, which ion exchange is involved in the detection of Fe3+ by Tb3+@Zn-CP. Further, XPS analysis on Tb3+@Zn-CP after soaked in FeCl3 was performed, as shown in Fig. S34.† New peak at 711.3 eV appears corresponding to Fe 2p, by which the existence of Fe3+ ions in the composites can be ascertained. To examine the sensing behavior of Tb3+@Zn-CP to Fe3+, titration experiment of Tb3+@Zn-CP (10 μM) with Fe3+ was carried out. On gradual addition of Fe3+ (0–60 μM), the absence intensity of Tb3+@Zn-CP solution is obviously increasing (Fig. S35†). From Fig. S29,† we can see that Fe3+ also show significant absorption in the range 300–400 nm. In short, the fluorescence quenching of Tb3+@Zn-CP by Fe3+ originates from two possible approaches: ion exchange and from the competitive absorption of excitation energy by Fe3+.
For Ru3+ ion detection, we investigated XPS analysis on Tb3+@Zn-CP after soaked in RuCl3, as shown in Fig. S36.† New peak at 281.8 eV appears corresponding to Ru 3d, by which the existence of Ru3+ in the composites can be ascertained. In addition, the color of the solid sample after immersion in RuCl3 aqueous solution was observed to have change in ordinary light, which also confirmed Ru3+ was diffused into two-dimensional structure of Tb3+@Zn-CP (Fig. S25†). To examine the sensing behavior of Tb3+@Zn-CP to Ru3+, titration experiment of Tb3+@Zn-CP (10 μM) with Ru3+ was carried out. With gradual addition of Ru3+ (0–60 μM), the absence intensity of Tb3+@Zn-CP solution is obviously increasing (Fig. S37†). From Fig. S29,† we can see that the solution of Ru3+ show obvious absorption in the range 300–400 nm. The luminescence quenching of Tb3+@Zn-CP originates from the competitive absorption of excitation energy by Ru3+.
Although Tb3+@Zn-CP as a luminescent sensor for Ru3+, Fe3+, CrO42−, Cr2O72− and MnO4−, the selectivity of it is not good, because these ions might exist simultaneously in environmental samples and complicated samples such as surface water or wastewater. However, compared with Zn-CP, Tb3+@Zn-CP can obviously improve the selectivity. The framework of Zn-CP contains uncoordinated nitrogen atoms and oxygen atoms possessing unshared pair electrons, which may coordinate with most metal ions or form hydrogen bonds with anions. Zn-CP is used as a parent coordination compound to encapsulate Tb3+ to obtain Tb3+@Zn-CP. Therefore, compared with Zn-CP, there is an obvious decrease in the adsorption capacity of Tb3+@Zn-CP to metal ions and anions. In addition, compared with Zn-CP, the excitation spectrum of Tb3+@Zn-CP also changed (Fig. S7†). Generally speaking, if the excitation spectrum of MOF overlaps with the ultraviolet-visible absorption spectrum of analyte to a certain extent, there is likely to be competitive energy absorption between MOF and analyte.52 So the competitive absorption of Ru3+, Fe3+, CrO42−, Cr2O72− and MnO4− is the main factor for Zn-CP fluorescence quenching.
As shown in Fig. S38 and Table S6,† the lifetime is shortened from 3.17 to 0.79 ns after Zn-CP treated with Tb3+. However, the lifetimes of Tb3+@Zn-CP remain in the presence and absence of Ru3+, Fe3+, CrO42−, Cr2O72− and MnO4−, which suggest that there are the static quenching mechanisms in selectively differentiate these ions by Tb3+@Zn-CP.53
4. Conclusion
We have successfully synthesized a zinc(II)-containing coordination polymer, namely [Zn(modbc)2]n (Zn-CP), using modbc as the linker. Zn-CP exhibited high stability in aqueous solution of metal salts, organic solvents and different temperatures. After encapsulation of Tb3+ ions in Zn-CP, the as-obtained fluorescent functionalized Tb3+@Zn-CP was obtained. An investigation of sensing properties reveals that Tb3+@Zn-CP as a luminescent sensor exhibits instant and selective luminescence quenching properties toward Ru3+, Fe3+, CrO42−, Cr2O72− and MnO4− ions in DMF/H2O media. It should be mentioned that the two-dimensional luminescent probes for detecting a trace amount ions (μM), well antiinterference performance, and quick response time (∼10 s) are still few reports.Conflicts of interest
The authors declare no competing financial interest.Acknowledgements
This work was supported by the National Natural Science Foundation of China (No. 21571141) and Tianjin Natural Science Foundation, China (No. 15JCYBJC20300).References
- M. Ota and C. B. Lin, Crit. Rev. Toxicol., 2006, 36, 155–163 CrossRef PubMed.
- E. Aakas, V. Sridis and M. Petala, J. Environ. Sci. Health, Part A: Toxic/Hazard. Subst. Environ. Eng., 2013, 48, 1390–1398 CrossRef PubMed.
- S. S. M. Assan, A. A. A. Shafi and A. H. K. Mohammed, Talanta, 2005, 67, 696–702 CrossRef PubMed.
- A. Barba-Bon, A. M. Costero, S. Gil, M. Parra, J. Soto, R. Martínez-Máñez and F. Sancenón, Chem. Commun., 2012, 48, 3000–3002 RSC.
- S. K. Sahoo, D. Sharma, R. K. Bera, G. Crisponi and J. F. Callan, Chem. Soc. Rev., 2012, 41, 7195–7227 RSC.
- S. H. Hong and R. H. Grubbs, Org. Lett., 2007, 9, 1955–1957 CrossRef CAS PubMed.
- R. R. Schrock, Angew. Chem., 2006, 118, 3832–3844 CrossRef.
- J. E. Macdonald, J. A. Kelly and J. G. C. Veinot, Langmuir, 2007, 23, 9543–9545 CrossRef CAS PubMed.
- M. Zheng, H. Tan, Z. Xie, L. Zhang, X. Jing and Z. Sun, ACS Appl. Mater. Interfaces, 2013, 5, 1078–1083 CrossRef CAS PubMed.
- B. Ding, S. X. Liu, Y. Cheng, C. Guo, X. X. Wu, J. H. Guo, Y. Y. Liu and Y. Li, Inorg. Chem., 2016, 55, 4391–4402 CrossRef CAS PubMed.
- R. Lv, J. Wang, Y. Zhang, H. Li, L. Yang, S. Liao, W. Gu and X. Liu, J. Mater. Chem. A, 2016, 4, 15494–15500 RSC.
- K. Akatsuka, J. W. McLaren, J. W. Lam and S. S. Berman, J. Anal. At. Spectrom., 1992, 7, 889–894 RSC.
- S. S. Nagarkar, B. Joarder, A. K. Chaudhari, S. Mukherjee and S. K. Ghosh, Angew. Chem., Int. Ed., 2013, 52, 2881–2885 CrossRef CAS PubMed.
- Z. O. Tesfaldet, J. F. van Staden and R. I. Stefan, Talanta, 2004, 64, 1189–1195 CrossRef CAS PubMed.
- M. M. Xu, X. J. Kong, T. He, X. Q. Wu, L. H. Xie and J. R. Li, Inorg. Chem., 2018, 57, 14260–14268 CrossRef CAS PubMed.
- B. Parmar, Y. Rachuri, K. K. Bisht and E. Suresh, Inorg. Chem., 2017, 56, 10939–10949 CrossRef CAS PubMed.
- S. F. Tang and X. M. Hou, Cryst. Growth Des., 2019, 19, 45–48 CrossRef CAS.
- B. Wang, X. L. Lv, D. Feng, L. H. Xie, J. Zhang, M. Li, Y. B. Xie, J. R. Li and H. C. Zhou, J. Am. Chem. Soc., 2016, 138, 6204–6216 CrossRef CAS PubMed.
- W. Yan, C. L. Zhang, S. G. Chen, L. J. Han and H. Zheng, ACS Appl. Mater. Interfaces, 2017, 9, 1629–1634 CrossRef CAS PubMed.
- G. F. Ji, J. J. Liu, X. C. Gao, W. Sun, J. Z. Wang, S. L. Zhao and Z. L. Liu, J. Mater. Chem. A, 2017, 5, 10200–10205 RSC.
- X. Y. Xu and B. Yan, Sens. Actuators, B, 2016, 222, 347–353 CrossRef CAS.
- P. C. Rao and S. Mandal, Inorg. Chem., 2018, 57, 11855–11858 CrossRef PubMed.
- G. Ji, J. Wang, X. Gao, J. Liu, W. Guan, H. Liu and Z. Liu, Eur. J. Inorg. Chem., 2018, 19, 1998–2003 CrossRef.
- Z. J. Lin, J. Lu, M. Hong and R. Cao, Chem. Soc. Rev., 2014, 43, 5867–5895 RSC.
- G. F. Ji, X. C. Gao, T. X. Zheng, W. H. Guan, H. T. Liu and Z. L. Liu, Inorg. Chem., 2018, 57, 10525–10532 CrossRef CAS PubMed.
- J. N. Hao and B. Yan, Nanoscale, 2016, 8, 12047–12053 RSC.
- K. M. Buschbaum, F. Beuerle and C. Feldmann, Microporous Mesoporous Mater., 2015, 216, 171–199 CrossRef.
- Z. Zhang, Y. He, L. Liu, X. Lu, X. Zhu, W. Wong, M. Pan and C. Su, Chem. Commun., 2016, 52, 3713–3716 RSC.
- Y. Lin, X. Zhang, W. Chen, W. Shi and P. Cheng, Inorg. Chem., 2017, 56, 11768–11778 CrossRef CAS PubMed.
- R. Lv, H. Li, J. Su, X. Fu, B. Yang, W. Gu and X. Liu, Inorg. Chem., 2017, 56, 12348–12356 CrossRef CAS PubMed.
- S. L. Yao, T. F. Zheng, X. M. Tian, S. J. Liu, C. Cao, Z. H. Zhu, Y. Q. Chen, J. L. Chen and H. R. Wen, CrystEngComm, 2018, 20, 5822–5832 RSC.
- D. Peng, X. Xia, L. Zhao, Z. Xie, Q. Zhang, J. Jiao and G. Xu, RSC Adv., 2017, 7, 3051–3058 RSC.
- D. Basudeb, J. Rajkumar, K. B. Anup, P. R. Partha, S. Chittaranjan and H. M. Mohammad, Inorg. Chem., 2019, 58, 2686–2694 CrossRef PubMed.
- SHELXTL 6.10, Bruker Analytical Instrumentation, Madison, WI, USA, 2000 Search PubMed.
- X-Area, Version 1.44, Program Package for Single Crystal Measurements, STOE & CIE GmbH, Darmstadt, Germany, 2008 Search PubMed.
- Y. L. Hou, H. Xu, R. R. Cheng and B. Zhao, Chem. Commun., 2015, 51, 6769–6772 RSC.
- L. Li, S. Shen, R. Lin, Y. Bai and H. Liu, Chem. Commun., 2017, 53, 9986–9989 RSC.
- Y. D. Wu, M. H. Lin, D. Y. Liu, M. Liu and J. Qian, RSC Adv., 2019, 9, 34949–34957 RSC.
- F. Y. Yi, S. C. Wang, M. Gu, J. Q. Zheng and L. Han, J. Mater. Chem. C, 2018, 6, 2010–2018 RSC.
- Z. Q. Yao, G. Y. Li, J. Xu, T. L. Hu and X. H. Bu, Chem.–Eur. J., 2018, 24, 3192–3198 CrossRef CAS PubMed.
- C. Yu, Z. Shao and H. Hou, Chem. Sci., 2017, 8, 7611–7619 RSC.
- T. K. Mondal, U. K. Ghorai and S. K. Saha, ACS Omega, 2018, 3, 11439–11446 CrossRef CAS PubMed.
- C. Liu and B. Yan, Photochem. Photobiol. Sci., 2015, 14, 1644–1650 RSC.
- L. F. Liang, L. Y. Liu, F. L. Jiang, C. P. Liu, D. Q. Yuan, Q. H. Chen, D. Wu, H. L. Jiang and M. C. Hong, Inorg. Chem., 2018, 57, 4891–4897 CrossRef CAS PubMed.
- Y. L. Hou, H. Xu, R. R. Cheng and B. Zhao, Chem. Commun., 2015, 51, 6769–6772 RSC.
- B. Wang, X. L. Lv, D. Feng, L. H. Xie, J. Zhang, M. Li, Y. B. Xie, J. R. Li and H. C. Zhou, J. Am. Chem. Soc., 2016, 138, 6204–6216 CrossRef CAS PubMed.
- W. Yan, C. L. Zhang, S. G. Chen, L. J. Han and H. Zheng, ACS Appl. Mater. Interfaces, 2017, 9, 1629–1634 CrossRef CAS PubMed.
- WHO, Guidelines for Drinking-Water Quality, WHO Press, Geneva, 4th edn, 2011 Search PubMed.
- P. Mahata, S. K. Mondal, D. K. Singha and P. Majee, Dalton Trans., 2017, 46, 301–328 RSC.
- G. Wen, Y. Wu, W. Dong, J. Zhao, D. Li and J. Zhang, Inorg. Chem., 2016, 55, 10114–10117 CrossRef CAS PubMed.
- K. Fan, S. S. Bao, W. X. Nie, C. H. Liao and L. M. Zheng, Inorg. Chem., 2018, 57, 1079–1089 CrossRef CAS PubMed.
- D. M. Chen, N. N. Zhang, C. S. Liu and M. Du, J. Mater. Chem. C, 2017, 5, 2311–2317 RSC.
- B. Gole, A. K. Bar and P. S. Mukherjee, Chem.–Eur. J., 2014, 20, 2276–2291 CrossRef CAS PubMed.
Footnote |
| † Electronic supplementary information (ESI) available: Crystallographic data, tables, IR, UV, TGA, PXRD, ICP, XPS, and luminescent spectra. CCDC 1882227. For ESI and crystallographic data in CIF or other electronic format see DOI: 10.1039/c9ra09541a |
| This journal is © The Royal Society of Chemistry 2020 |