 Open Access Article
Ultra-thin NiS nanosheets as advanced electrode for high energy density supercapacitors†
Hailong Yanab,
Kejia Zhuab,
Xu Liuab,
Yinghui Wangab,
Yangbo Wangab,
Deyang Zhangab,
Yang Lu ab,
Tao Pengab,
Yunxin Liu
 c and
Yongsong Luo
 *ab
*ab
aSchool of Physics and Electronic Engineering, Xinyang Normal University, Xinyang 464000, P. R. China. E-mail: eysluo@163.com; Fax: +86 376 6390801; Tel: +86 376 6390801
bKey Laboratory of Microelectronics and Energy of Henan Province, Xinyang Normal University, Xinyang 464000, P. R. China
cDepartment of Physics and Electronic Science, Hunan University of Science and Technology, Xiangtan 411201, China
First published on 28th February 2020
Abstract
Low energy density of supercapacitors is one of the major downsides for their practical applications. Here, a simple hydrothermal method was developed to synthesize NiS nanosheets on Ni foam. NiS nanosheets with a rough surface promise large electroactive surface area for energy storage, and show an ultra-high capacitance of 2587 F g−1 at a scan rate of 0.2 A g−1 (corresponding to the discharge time of 5563 s). The NiS nanosheets also present an outstanding cycling stability of 95.8% after 4000 cycles. As a positive electrode material for hybrid supercapacitors (HSC), NiS nanostructures provide a broad voltage window of 1.7 V. Our device also shows a high energy density of 38 W h kg−1 at a power density of 1.5 kW kg−1.
1. Introduction
The exhaustion of traditional energy accompanying environmental pollution has led to an increase in the requirements of efficient energy storage devices. Supercapacitors with good cycling performance and excellent power density are considered as promising power-supply devices.1–5 Many carbon nanostructures such as graphene and CNT have been applied in supercapacitors and other power supplies.6,7 However, large-scale application of carbon-based supercapacitors is still a challenge due to their lower energy density and high material cost. Ni3S2, NiS, Co9S8, NiCo2O4 and NiCo2S4 have received substantial attention for their good capacitance performance, various oxidation states and abundant raw materials.8–14 Compared to many oxides, NiS and Ni3S2 have higher conductivity and richer redox reactions.10,14 To the best of our knowledge, many researches on high performance electrodes are mainly focused on Ni3S2, and a good capacitance performance of 2885 F g−1 has been received.15 However, numerous reports indicate that the electrochemical performances of NiS are still unsatisfactory.On the other hand, one way to address the challenge of high energy density is developing HSCs with a much higher voltage window.16–18 The HSCs based on the Ti3C2Tx@CNT electrode delivered an energy density of 62 W h kg−1 with a voltage window of 1.6 V.9 Li et al. synthesized an N-doped activated carbon electrode for HSC, which showed great energy density and a good cycling stability.19
Here, we successfully fabricated NiS nanosheets by a hydrothermal method and investigated its electrochemical performance. The NiS electrode exhibits a high specific capacity of 2587 F g−1 at a current density of 0.2 A g−1. It is noteworthy that the NiS electrodes showed 4.2% capacity decay after 4000 cycling tests. HSC was assembled with NiS nanosheets and activated carbon as the electrodes. The HSC delivered an energy density of 38 W h kg−1 with a voltage window of 1.7 V.
2. Experimental section
2.1 Materials preparation
Ni precursors were prepared by a one-step hydrothermal method (as shown in Fig. S1†). First, 0.4 g urea and 0.58 g NiNO3·6H2O were stirred for 60 min in a mixture of 3 mL ethanol and 37 mL purified water. Second, this solution and a rectangular Ni foam substrate were transferred into an autoclave that was heated to 180 °C at a heating rate of 3 °C min−1 and kept at 180 °C for 18 h. Third, the product was taken out from the autoclave and cleaned by ultrasonication for 10 min to remove the loose products on the surface. NiS nanosheets were then prepared by transferring Ni precursor and Na2S solution into an autoclave, which was heated and kept at 120 °C for 3 h. Finally, the as-obtained samples were washed with deionized water and dried at 60 °C for further characterization. The mass and area loading of NiS on Ni foam were about 28 mg and 3.2 cm2, respectively. The mass loading per unit area was calculated to be 8.8 mg cm−2.2.2 Preparation of the HSCs
NiS nanosheets and activated carbon (AC) were used as the electrodes of HSC. A piece of commercial separator and 3 M KOH were also used in the HSC. The negative electrode was formulated with AC, carbon black, and polyvinylidene following a typical procedure as shown in ref. 14 and 20. Based on the charge balance relationship the mass of positive and negative electrodes were calculated to be 12 mg and 32.3 mg, respectively.
2.3 Materials characterization
NiS sample with Ni substrate was cut into a series of squares with sides of about 4 and 8 mm for further characterization. Micro-structural characterization of the NiS sample (4 mm × 4 mm) was performed by scanning electron microscopy (SEM, Hitachi, Chiyoda-ku, S4800). Phase identification of the NiS nanosheets was measured by X-ray diffraction (XRD, Bruker D8-Advance). The chemical elements of the NiS sample (8 mm × 8 mm) were evaluated by X-ray photoelectron spectroscopy (XPS, PHI 5600).2.4 Electrochemical measurements
The electrochemical performance of the NiS electrode was tested on an electrochemical workstation (Chenhua, CHI 660E, China). The saturated calomel electrode (SCE) and Pt foil were used as the reference electrode and counter electrode, respectively, in the measurements. 0.15 mol KOH was stirred in 50 mL purified water, which was then used as the electrolyte. The valid mass of NiS electrode immersed in the KOH solution was about 21 mg.3. Results and discussion
Fig. 1a presents the microstructural characterization of the hydrothermal precursor on Ni foam wherein the Ni foam is covered by dense NiS nanosheets. An enlarged view shown in Fig. 1b and c reveals that the nanosheets with a size of a few micrometers grow on the substrate, forming a 3D framework structure. Fig. 1d shows the high magnification SEM image of NiS nanosheets vulcanized for 3 h. After this process, the surface of NiS nanosheets became rougher, leading to an enlarged interface area between the active material and the electrolyte.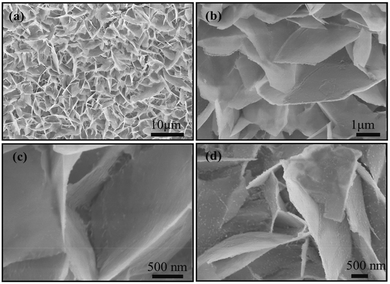 | ||
| Fig. 1 (a–c) SEM images of the NiS precursors on Ni foam. (d) SEM image of NiS nanosheets vulcanized for 3 h. | ||
The phase identification of the NiS nanosheets was studied by XRD measurements (Fig. 2a). The diffraction lines observed at 2θ of 31°, 33.5°, 60.3°, 62.1°, and 70° corresponded to NiS and are in agreement with the standard data (PDF: 02-1280). Two peaks at 45° and 50.8° can be indexed to the (111) and (200) crystal faces of Ni, respectively (JCPDS 04-0850). No impurity peaks were observed in the pattern, which further suggests that the nanostructures are made of pure NiS. XPS tests were carried out to obtain the chemical states of nanosheets. Fig. 2b is the survey scan spectrum of NiS nanosheets that show peaks corresponding to both S and Ni elements. Two major peaks at 857 eV and 874.8 eV are assigned to Ni 2p3/2 and Ni 2p3/2, respectively (Fig. 2c). Two peaks at 862.7 eV and 880.3 eV are indexed to the satellite peaks of Ni 2p3/2 and Ni 2p1/2 signals due to the coulombic interaction between holes and valence electrons. Fig. 2d shows the XPS spectrum after the decomposition of the S element. The binding energy of 164.2 eV corresponds to the S that is bonded with Ni, and another peak at 169.4 eV corresponds to sulfur oxides at the surface.21
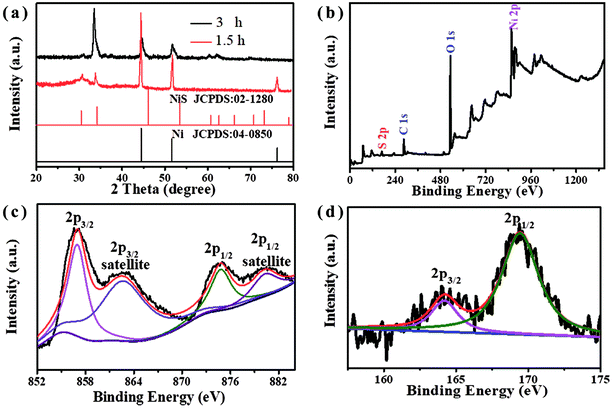 | ||
| Fig. 2 (a) XRD patterns of NiS nanosheets vulcanized for 1.5 and 3 h. (b) The survey scan spectrum, and (c and d) the survey scans of Ni 2p and S 2p. | ||
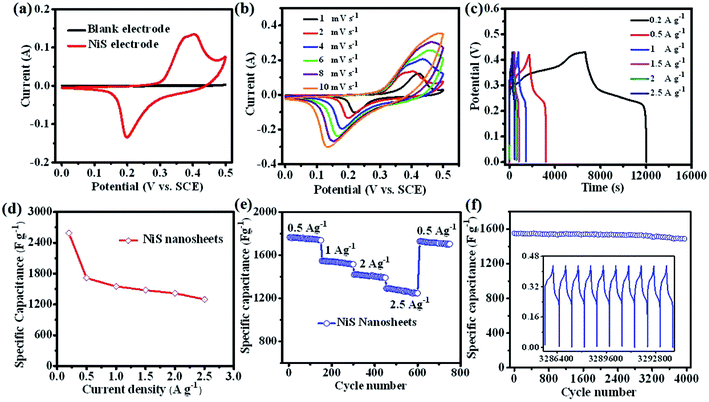
To assess the electrochemical performance of NiS nanosheets, a three-electrode system was employed in 3 M KOH. Fig. 3a shows the cyclic voltammetry (CV) curves of the blank electrode and NiS electrode measured at 4 mV s−1. Obviously, the specific capacity of NiS electrode is much higher than that of the blank electrode. Fig. 3b displays the CV curves of the NiS electrode measured at scan rates of 1, 2, 4, 6, 8 and 10 mV s−1. Well-defined redox peaks were found in every CV curve proving the pseudocapacitive nature of the NiS electrode. The specific capacity of the NiS electrode was calculated to be 2038 F g−1 at a scan rate of 1 mV s−1 via the following equation,7
 | (1) |
 represents the integral area of CV curves, V, ν and m are the potential, scan rate and the mass of active materials, respectively. When the scan rate was increased to 10 mV s−1, the specific capacity was estimated to be 857 F g−1. Fig. 3c displays the charge/discharge (CD) curves of NiS electrodes tested at different current densities. The capacity of NiS electrodes can be worked out based on the following equation.3,6
| C = IΔt/(Vm) | (2) |
![[thin space (1/6-em)]](https://www.rsc.org/images/entities/char_2009.gif) 404, 1399 and 1257 F g−1 at different current densities of 0.5, 1.0, 2.0, and 2.5 A g−1, respectively. In addition, high cycling performance of the NiS nanosheets at a current density of 1.5 A g−1 is shown in Fig. 3f. The capacity retention of 95.8% was finally obtained after 4000 cycles. The CD curves of the final 10 cycles were similar to the first few cycles (see the inset of Fig. 3f). The performance of NiS electrodes has also been compared with other sulphide electrodes, especially NiS (as listed in Table 1). The performance of the NiS electrode in our work can compete with or even surpass the reported values for NiS and other materials. To further understand the superiority of this NiS, electrochemical impedance spectra of NiS and NiO nanosheets were measured in the frequency range of 0.01 Hz to 100 kHz. At a high frequency region, NiS has a smaller radius compared to NiO, which shows a lower interfacial charge transfer resistance (as shown in Fig. S2†). The slope of NiS is similar to that of the NiO electrode indicating that they have the same diffusion resistance. Moreover, the real axis intercept of NiS is smaller than that of NiO. These results revealed that NiS has unique electrical conductivity and contact resistance.
404, 1399 and 1257 F g−1 at different current densities of 0.5, 1.0, 2.0, and 2.5 A g−1, respectively. In addition, high cycling performance of the NiS nanosheets at a current density of 1.5 A g−1 is shown in Fig. 3f. The capacity retention of 95.8% was finally obtained after 4000 cycles. The CD curves of the final 10 cycles were similar to the first few cycles (see the inset of Fig. 3f). The performance of NiS electrodes has also been compared with other sulphide electrodes, especially NiS (as listed in Table 1). The performance of the NiS electrode in our work can compete with or even surpass the reported values for NiS and other materials. To further understand the superiority of this NiS, electrochemical impedance spectra of NiS and NiO nanosheets were measured in the frequency range of 0.01 Hz to 100 kHz. At a high frequency region, NiS has a smaller radius compared to NiO, which shows a lower interfacial charge transfer resistance (as shown in Fig. S2†). The slope of NiS is similar to that of the NiO electrode indicating that they have the same diffusion resistance. Moreover, the real axis intercept of NiS is smaller than that of NiO. These results revealed that NiS has unique electrical conductivity and contact resistance.
| Electrodes | Capacitance | Current density | Cycle number | Capacitance retention | Reference |
|---|---|---|---|---|---|
| NiS | 2587 F g−1 | 0.2 A g−1 | 4000 | 95.8% | This work |
| CuCo2O4 | 796 F g−1 | 2 A g−1 | 5000 | 94.7% | 3 |
| NiO | 1126 F g−1 | 2 A g−1 | 2000 | 95% | 4 |
| Ni3S2 | 1209.6 F g−1 | 3 A g−1 | 8 | ||
| NiCo2S4 | 2036.5 F g−1 | 1 A g−1 | 5000 | 94.3% | 13 |
| Ni3S2 | 1024 F g−1 | 0.8 A g−1 | 1000 | 80% | 14 |
| Ni3S2 | 2885 F g−1 | 2 A g−1 | 10![[thin space (1/6-em)]](https://www.rsc.org/images/entities/char_2009.gif) 000 000 |
60% | 15 |
| NiS | 1606 F g−1 | 1 A g−1 | 10![[thin space (1/6-em)]](https://www.rsc.org/images/entities/char_2009.gif) 000 000 |
91.2% | 16 |
| NiS | 1897 F g−1 | 1 A g−1 | 4000 | 100% | 23 |
| NiS | 1122.7 F g−1 | 1 A g−1 | 1000 | 97.8% | 24 |
The energy storage modes of the supercapacitor can be grouped into Faraday reaction process and electric double layer storage process. The surface capacity contribution can be separated according to equation.8
| i = k1v + k2v1/2 | (3) |
Fig. 4a–e show the CV curves tested at scan rates of 1, 2, 4, 6 and 8 mV s−1. The grid area of the CV curve indicates the ratio of capacity contributions to the total charge in the electrode. The capacity contribution of the diffusion-limited processes increased from 87.9% to 92.3%. When the scan rate is lower, there is enough time for the ions to migrate and intercalate. While at higher scan rates, there is no sufficient time for ion migration and intercalation. The relationship between the measured current (i) and sweep rate (v) could be described by the power law.22,23
| i = avb | (4) |
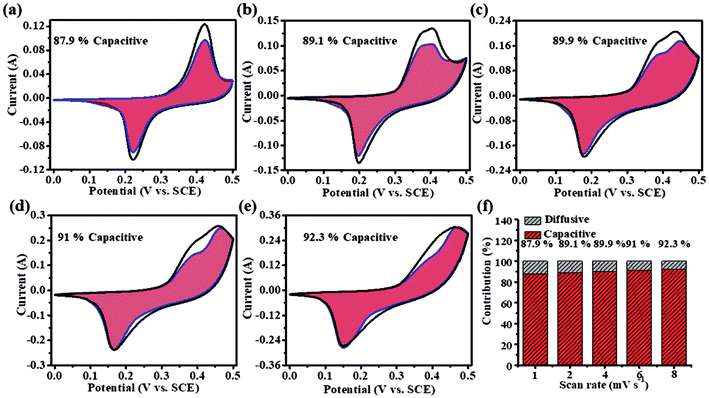 | ||
| Fig. 4 (a–e) Capacitance contribution rate of NiS electrodes at 1, 2, 4, 6 and 8 mV s−1. (f) Capacitance contribution rates of NiS electrodes. | ||
For sweep rates ranging from 1 to 10 mV s−1, the b-values for cathodic and anodic peaks are 0.481 and 0.475, respectively, suggesting that the kinetics is mainly diffusion controlled (as shown in Fig. S3†).
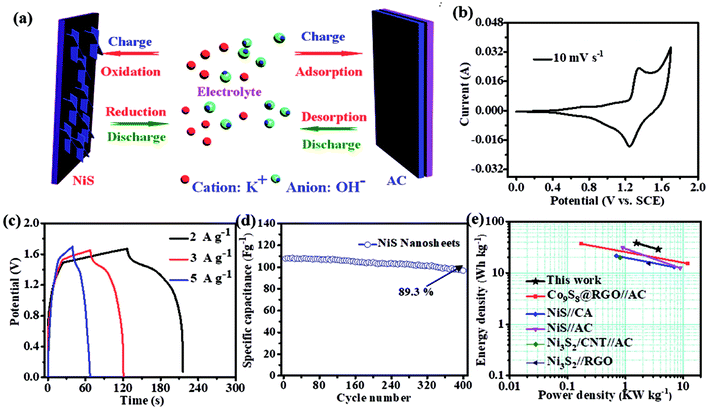
To evaluate the performance of the NiS electrode for the practical applications, we assembled an HSC device with the NiS nanosheets and AC electrode, as shown in Fig. 5a. Fig. S4a† demonstrates the CV curves of AC and NiS electrode measured at a scan rate of 6 mV s−1 in a three-electrode system. The potential windows of AC and NiS were −1 to 0 V and 0 to 0.6 V, respectively. The specific capacitances of AC were estimated to be 274 and 267 F g−1 at current densities of 5 and 10 A g−1, respectively (as shown in Fig. S4b†). Fig. 5b presents a CV curve of the HSC in a potential range of 0–1.7 V. Two clear redox peaks were found in the curve indicating that the device could work stably at 0–1.7 V. Fig. 5c displays the CD curves at current densities of 2, 3 and 5 A g−1, the maximum capacity of the HSC obtained is 106 F g−1. The HSC also shows an excellent cycling stability of 89.3% after 400 cycles (Fig. 5d). The energy and power density can be worked out from these equations.24–26
 | (5) |
| P = E/Δt | (6) |
The energy density was estimated to be 38 W h kg−1 at the maximum power density of 1.5 kW kg−1. The highest power density calculated was 3.7 kW kg−1, when the energy density was 29 W h kg−1. This result can compete with or even surpass that of the reported NixSy-based HSC (Fig. 5e), such as Ni3S2 (35.2 W h kg−1),8 Ni3S2 (19.8 W h kg−1),14 NiS (21.5 W h kg−1),16 NiS (11.6 W h kg−1),25 and NiS (31 W h kg−1).26 The outstanding performance can be attributed to the following factors. First, the energy density is largely improved due to the expansion of the potential window. Second, vertical growth of NiS nanosheets ensures a good electrical connection to the current collector, and third, the rough surface increases the electrolyte-material contact area.
4. Conclusions
We demonstrated the preparation of NiS nanosheets on a flexible substrate and examined their performance as electrodes for supercapacitors. These NiS nanosheets have superior electrochemical properties including ultrathin structure, adequate active sites and strong adhesion to the substrate. The NiS electrode delivers a high capacity of 2587 F g−1 at a current density of 0.2 A g−1 (corresponding to long discharge time of 5563 s) and a retention ratio of 95.8% after 4000 cycles. The assembled NiS/AC device shows a broad working voltage of 1.7 V, which is beneficial to acquire an energy density of 38 W h kg−1. This work is helpful for the application of NiS electrodes in supercapacitors.Conflicts of interest
There are no conflicts to declare.Acknowledgements
This work is supported by the Natural Science Foundation of Henan Province (182300410283), the Young Backbone Teachers in Henan Province (No. 2016GGJS-095), National Natural Science Foundation of China (No. 61704146, 11604282, 61874093), and the Nanhu Scholars Program for Young Scholars of XYNU.Note and references
- X. Peng, L. L. Peng, C. Z. Wu and Y. Xie, Chem. Soc. Rev., 2014, 43, 3303–3323 RSC.
- K. W. Qiu, Y. Lu, D. Y. Zhang, J. B. Cheng, H. L. Yan, J. Y. Xu, X. M. Liu, J. K. Kim and Y. S. Luo, Nano Energy, 2015, 11, 687–696 CrossRef CAS.
- J. B. Cheng, H. L. Yan, Y. Lu, K. W. Qiu, L. Han, X. M. Liu, J. K. Kim and Y. S. Luo, J. Mater. Chem. A, 2015, 3, 9769–9776 RSC.
- B. Wang, J. S. Chen, Z. Y. Wang, S. Madhavi and X. W. Lou, Adv. Energy Mater., 2012, 2, 1188–1192 CrossRef CAS.
- X. M. Li, L. F. Jian, C. Zhou, J. P. Liu and H. B. Zeng, NPG Asia Mater., 2015, 7, e165 CrossRef CAS.
- X. H. Xia, Y. Q. Zhang, Z. X. Fan, D. L. Chao, Q. Q. Xiong, J. P. Tu, H. Zhang and H. J. Fan, Adv. Energy Mater., 2015, 5, 1401709 CrossRef.
- J. Yan, Z. J. Fan, W. Sun, G. Q. Ning, T. Wei, Q. Zhang, R. F. Zhang, J. J. Zhi and F. Wei, Adv. Funct. Mater., 2012, 22, 2632–2641 CrossRef CAS.
- W. B. Fu, Y. Y. Zhao, J. F. Mei, F. J. Wang, W. H. Han, F. C. Wang and E. Q. Xie, Electrochim. Acta, 2018, 283, 737–743 CrossRef CAS.
- M. M. Hu, C. Cui, C. Shi, Z. S. Wu, J. X. Yang, R. F. Cheng, J. J. Guang, H. L. Wang, H. X. Lu and X. H. Wang, ACS Nano, 2019, 13, 6899–6905 CrossRef CAS PubMed.
- S. F. Wang, Z. Y. Xiao, S. Y. Zhai, H. S. Wang, W. J. Cai, L. F. Qin, J. Y. Huang, D. Zhao, Z. C. Li and Q. D. An, J. Mater. Chem. A, 2019, 7, 17345–17356 RSC.
- B. Q. Xie, M. Y. Yu, L. H. Lu, H. Z. Feng, Y. Yang, Y. Chen, H. D. Cui, R. B. Xiao and J. Liu, Carbon, 2014, 141, 134–142 CrossRef.
- G. Q. Zhang and X. W. Lou, Adv. Mater., 2013, 25, 976–979 CrossRef CAS PubMed.
- Y. X. Wen, S. L. Peng, Z. L. Wang, J. X. Hao, T. F. Qin, S. Q. Lu, J. C. Zhang, D. Y. He, X. Y. Fan and G. Z. Cao, J. Mater. Chem. A, 2017, 5, 7144–7152 RSC.
- C. S. Dai, P. Y. Chen, J. Y. Lin, S. W. Chou, W. K. Wu, P. H. Li, K. Y. Wu and T. W. Lin, ACS Appl. Mater. Interfaces, 2013, 5, 12168–12174 CrossRef CAS PubMed.
- J. S. Chen, C. Guan, Y. Gui and D. J. Blackwood, ACS Appl. Mater. Interfaces, 2017, 9, 496–504 CrossRef CAS PubMed.
- L. Z. Zuo, W. Fan, Y. F. Zhang, Y. P. Huang, W. Gao and T. X. Liu, Nanoscale, 2017, 9, 4445–4455 RSC.
- Y. Han, Y. Z. Lu, S. H. Shen, Y. Zhong, S. Liu, X. H. Xia, Y. X. Tong and X. H. Lu, Adv. Funct. Mater., 2019, 29, 1806329 CrossRef.
- X. Y. Hu, H. S. Nan, M. Liu, S. J. Liu, T. An and H. W. Tian, Electrochim. Acta, 2019, 306, 599–609 CrossRef CAS.
- B. Li, F. Dai, Q. F. Xiao, L. Yang, J. M. Shen, C. M. Zhang and M. Cai, Energy Environ. Sci., 2016, 9, 102–106 RSC.
- Y. J. Ruan, L. Lv, Z. S. Li, C. D. Wang and J. J. Jiang, Nanoscale, 2017, 9, 18032–18041 RSC.
- X. H. Wang, F. F. Huang, F. Rong, P. He, R. H. Que and S. P. Jiang, J. Mater. Chem. A, 2019, 7, 12018–12028 RSC.
- Y. X. Zhang, Y. P. Liu, Z. H. Sun, J. C. Fu, S. T. Cheng, P. Cui, J. Y. Zhou, Z. X. Zhang, X. J. Pan, W. H. Han and E. Q. Xie, J. Mater. Chem. A, 2019, 7, 21290–21298 RSC.
- X. Yang, R. Y. Zhang, J. Zhao, Z. X. Wei, D. X. Wang, X. F. Bie, Y. Gao, J. Wang, F. Du and G. Chen, Adv. Energy Mater., 2017, 8, 1701827 CrossRef.
- W. D. Yu, W. R. Lin, X. F. Shao, Z. X. Hu, R. C. Li and D. S. Yuan, J. Power Sources, 2014, 272, 137–143 CrossRef CAS.
- Z. C. Li, X. W. Yu, A. J. Gu, H. Tang, L. B. Wang and Z. S. Lou, Nanotechnology, 2017, 28, 065406 CrossRef PubMed.
- B. Guan, Y. Li, B. Y. Yin, K. F. Liu, D. W. Wang, H. B. Zhang and C. J. Cheng, Chem. Eng. J., 2017, 308, 1165–1173 CrossRef CAS.
Footnote |
| † Electronic supplementary information (ESI) available. See DOI: 10.1039/c9ra09486e |
| This journal is © The Royal Society of Chemistry 2020 |

