
 Open Access Article
 This Open Access Article is licensed under a Creative Commons Attribution-Non Commercial 3.0 Unported Licence
Investigation of dielectric constants of water in a nano-confined pore
Haochen
Zhu
 ab,
Fengrui
Yang
ab,
Yunjie
Zhu
ab,
Aihua
Li
ab,
Wenzhi
He
ab,
Juwen
Huang
ab and
Guangming
Li
*ab
ab,
Fengrui
Yang
ab,
Yunjie
Zhu
ab,
Aihua
Li
ab,
Wenzhi
He
ab,
Juwen
Huang
ab and
Guangming
Li
*ab
aState Key Laboratory of Pollution Control and Resources Reuse, College of Environmental Science and Engineering, Tongji University, 1239 Siping Rd, Shanghai 200092, China. E-mail: ligm@tongji.edu.cn
bShanghai Institute of Pollution Control and Ecological Security, Shanghai 200092, P. R. China
First published on 27th February 2020
Abstract
We report the dielectric properties of pure water confined in a silica hydrophilic nanopore determined from the computation of the density of liquid in the confined phase by the grand canonical Monte Carlo (GCMC) simulations. The silica cylindrical nanopore is divided into n concentric radial shells to get a better insight into the dielectric properties of nanoconfined water. We find that the average values of the dielectric constants are very close and almost independent of the number of concentric radial shells. The decrease in the dielectric constant of confined pure water is due to the strong orientation of water dipoles in the vicinity of the surface while water dipoles do not exhibit any preferential orientation in bulk phase.
1. Introduction
Water pollution has attracted more and more people's attention due to the growing population and industrial needs. About one-third of the world's population currently lives now in areas with scarce water resources, and by 2025 this ratio is likely to reach two-thirds.1,2 Membrane separation technology is a kind of technology which uses selective separation membranes to separate the mixture under external pressure.3–6 Among which, nanofiltration (NF) membranes have been widely used in drinking water preparation, wastewater treatment, product desalination and purification and other fields due to its excellent separation performance.7–13 However, due to the special effect brought by the complex structure of nanofiltration membrane, research on the separation mechanism and theoretical model of nanofiltration has become one of the difficulties in the field of nanofiltration research, which limits the development and application of nanofiltration membranes. In recent years the special effect caused by the nanoscale size of nanofiltration membrane has been paid more and more attention.7–9,14 Among which, dielectric permittivity is the most important one that represents the electrical polarization or the amount of electrical energy stored in a material. The dielectric exclusion is one of the most important separation mechanisms that was firstly considered by Glueckauf15 and then suggested by Yaroshchuk16 that the effect of ion interactions with polarization charges or “image forces” at the solution/membrane interface may cause dielectric exclusion. This phenomenon is induced at the solvent-membrane surface because of the interaction between ions and membrane materials with different dielectric constants. However, the dielectric constant of water in the membrane pore lacks a direct measurement method. The effect of confinement on the dielectric constant is currently a matter of debate in the membrane community and the dielectric constant inside pores of NF membranes is usually used as a fitting parameter.Molecular dynamics simulation (MD) relies on Newtonian mechanics to simulate the motion of the molecular system, and then extracts samples from the system composed of different states of the molecular system to calculate the configuration integral of the system, and further calculate the thermodynamic quantity and other macroscopic properties of the system based on the results of the configuration integral. It explores the specific behavior of microscopic systems at the molecular level by describing the trajectory of each particle at the atomic level and is widely used in computational chemistry,17 drug design,18 computational biology,19 and materials science.20
Since the pore size of nanofiltration membranes is mostly within 1 nm, and the size of water molecules is about 0.3 nm, this means that only 3–4 water molecules can be accommodated in the pore of a nanofiltration membrane. The structure of water molecules under confinement is more orderly than that of bulk space, leading to changes in dielectric constant. The decrease of dielectric constant of the confined phase is caused by the reduction of the rotational freedom of water dipoles near surfaces. Peer's work has shown that water molecules confined in such nanoscale environments exhibit a distinct layered structure inside pores.21–26 To this end, Varghese et al. have found that the rotational diffusion coefficient for water molecules decreased near the solid surface, which is due to the hindered rotation away from the center of the channel to the wall.22 In addition, Fumagalli et al., probed the dielectric constant of water at nanoscale by applying scanning microscopy techniques and they found that an extremely low dielectric constant of water in nano-confined surroundings.26 However, most of these researches have focused on the dielectric constant of water confined in hydrophobic surfaces, few works have investigated the dielectric proprieties of confined water in hydrophilic frameworks. Water layered near hydrophilic surfaces being in proximity of one another can play a role of relatively strong glue between these surfaces. Genko et al., investigated dielectric properties of different hydrophilic/hydrophobic surfaces and dispersion medium (air, water, chloroform, carbon tetrachloride, and other solvents) using dielectric relaxation spectroscopy and theoretical methods on the interfacial water;27 Parez et al., compared dielectric properties of water at rutile (hydrophilic) and graphite surfaces (hydrophobic) and they found an augmented density at the rutile surface and an increased molecular polarizability due to the lack of H-bonding partners at the graphite surface.28 Although the above work investigate the dielectric constant in hydrophilic nanopores, the physical mechanism of dielectric response at the interfaces requires further study and understanding.
In the present work GCMC simulations have been used to investigate dielectric properties of pure water confined in a silica hydrophilic nanopore. Results obtained with the confined nanopore were further discussed by the orientation of water molecules inside the nanopore.
2. Models and computational procedure
The most populated MCM-41 matrix has been applied as the silicate forms by means of the atomic model created by Vink and Barkema.29 The confined environment of a silica hydrophilic cylindrical nanopore was performed by the procedure of Bródka and Zerda.30 A cylindrical cavity of 0.6 nm of radius was produced by removing the atoms of silicate matrix. From their coordination numbers, we differentiated bridging oxygens (Ob) bonded to two silicon atoms from nonbridging oxygens (Onb) bonded to only one silicon and bonded to one hydrogen atom (Hnb). The nonbridging oxygens were saturated with hydrogen atoms to form surface hydroxyl groups and the density of surface silanol groups is 7.5 nm−2 which presented a highly hydrated silica nanopore. Even if the silica matrix remained rigids, we allowed the rotation around the silicon–oxygen (Si–O) bond of the hydroxyl groups from the SHAKE constraints algorithm.31–34 This process can veritably restore the irregularity of the porous silicate and the interaction between fluid and matrix. The section view of the silica hydrophilic pore is given in Fig. 1.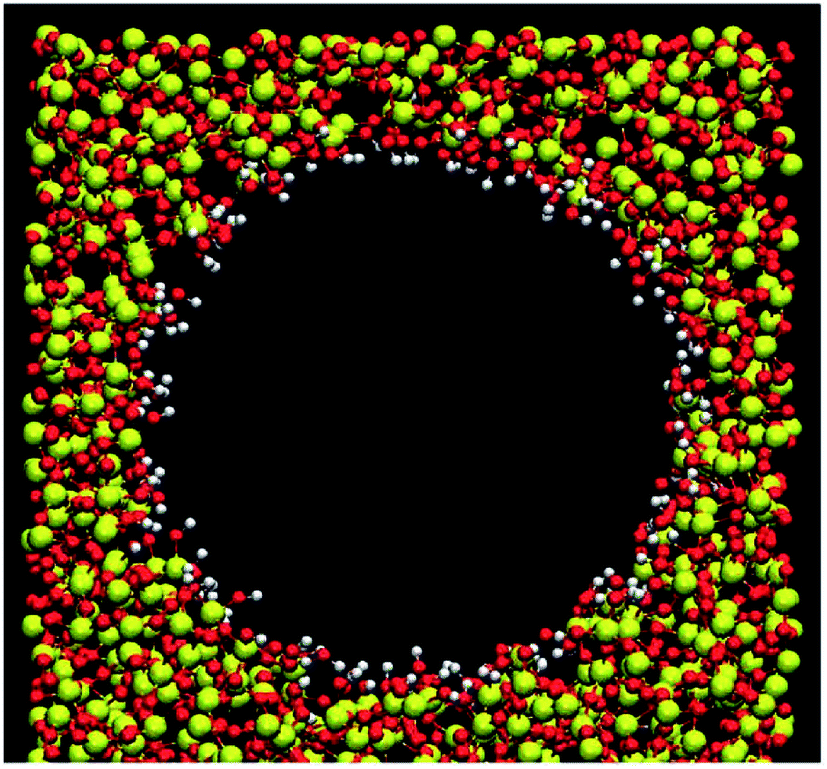 | ||
| Fig. 1 Section view of the silica hydrophilic pore. Red, white and yellow colors represent the oxygen, hydrogen and silicon atoms, respectively. | ||
The total intermolecular potential is composed of a sum of the Lennard-Jones (LJ)35 and electrostatic interactions (Elec). The most common expressions of the LJ potential are:
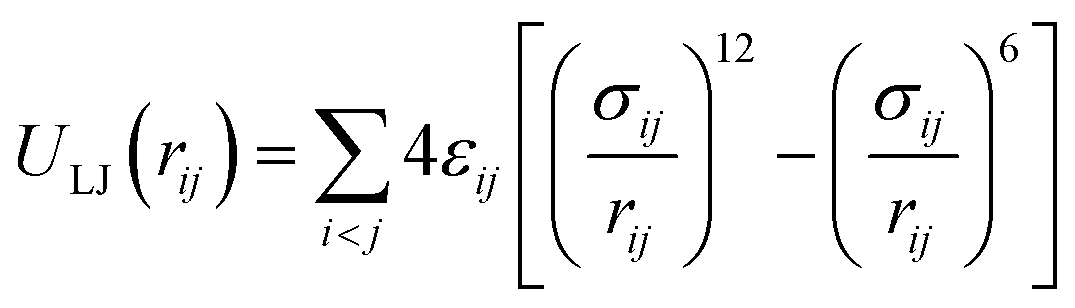 | (1) |
When particles i and j are different chemical species, εij and σij are usually estimated by the Lorentz–Berthelot (LB) mixing rules,
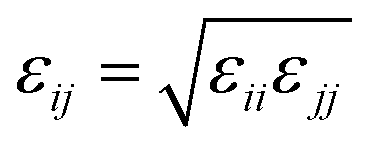 | (2) |
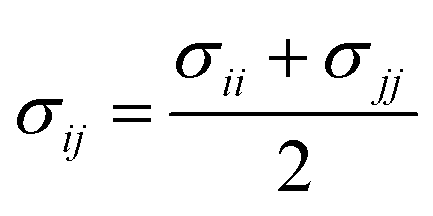 | (3) |
The parameters of charges and the Lennard-Jones of silica hydrophilic matrix are given in Table 1. The electrostatic potential is calculated as a sum of interactions between pairs of point charges, using Coulomb's law:
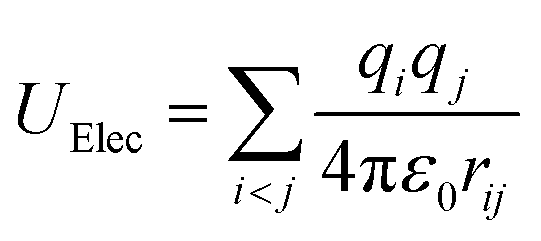 | (4) |
 | (5) |
![[k with combining low line]](https://www.rsc.org/images/entities/i_char_006b_0332.gif) is a reciprocal lattice vector defined by = 2π
is a reciprocal lattice vector defined by = 2π![[n with combining low line]](https://www.rsc.org/images/entities/i_char_006e_0332.gif) /L2, where is the reciprocal space basis vectors, δlm is the Kronecker delta, erf is the error function, erfc is the complementary error function and α is the convergence parameter (a sharp distribution of charge is set if a large value of α is chosen).
/L2, where is the reciprocal space basis vectors, δlm is the Kronecker delta, erf is the error function, erfc is the complementary error function and α is the convergence parameter (a sharp distribution of charge is set if a large value of α is chosen).
| q (e) | σ (Å) | ε (kJ mol−1) | |
|---|---|---|---|
| Hnb | 0.206 | 0.000 | 0.000 |
| Ob | −0.6349 | 2.700 | 1.622 |
| Onb | −0.5399 | 2.700 | 1.622 |
| Si | 1.2739 | 0.000 | 0.000 |
| Si–O | 0.320 | 4.500 | 0.832 |
Water molecular model was developed in order to help discovering a adequate structure of water. In this work, we used the non polarizable rigid model TIP4P/2005 formed by Abascal and Vega.37 In this model, the center of the negative charge corresponding to the oxygen atom is moved along the bisecting line of the H–O–H bond to the position M closer to the hydrogen atom.
In order to simulate realistically the actual process of nanofiltration, the whole system was divided into two parts (see Fig. 2). One was bulk phase which is distributed on both sides of the system and the lengths in x, y and z directions are 35.5 Å, 35.5 Å and 35.5 Å respectively. The solid and adsorbed phases are in the middle of the bulk phase and had a box lengths Lx = Ly = 35.5 Å, Lz = 70 Å. We formed therefore a rectangular simulation box with Lx = Ly = 35.5 Å, and Lz = 141 Å. The density of liquid of confined phase was investigated by the grand canonical Monte Carlo (GCMC) and all the simulations were carried out in an efficient isothermal–isosurface–isobaric statistical ensemble34 with periodic boundary conditions at 298 K and 1 bar. Systems studied were consisted of 5000 water molecules and performed with the DL_POLY package38 using the velocity Verlet algorithm31 and Nose–Hoover thermostat39 with a time step of 2 fs. The LJ and electrostatic interactions were cut off at 12 Å.
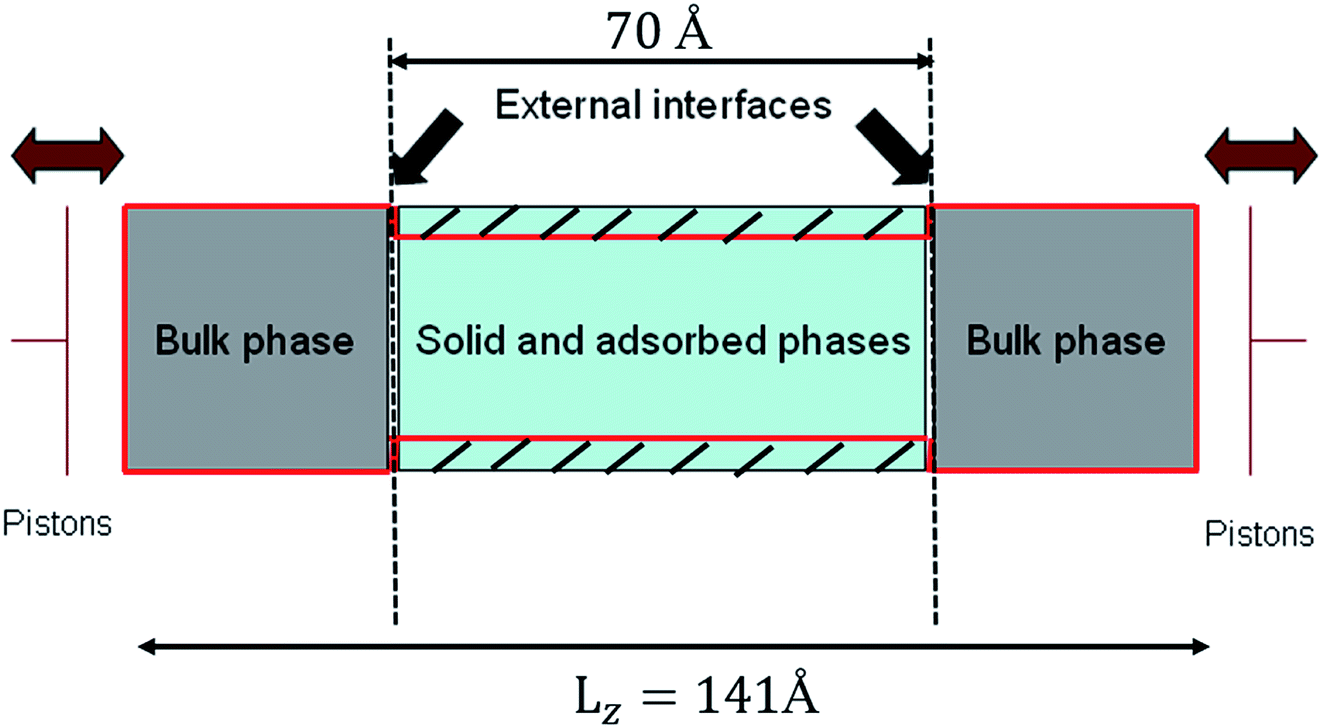 | ||
| Fig. 2 Schematic of silica hydrophilic pore with two water reservoirs. | ||
3. Calculations of the dielectric constant
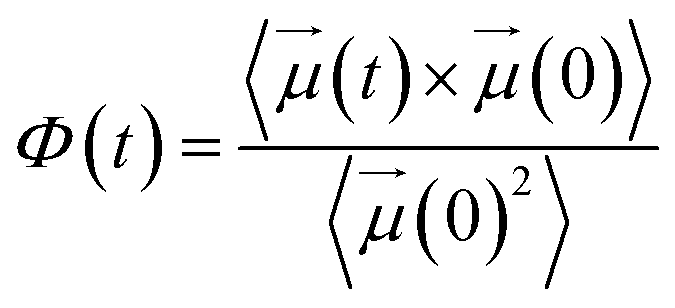
The dielectric constant is defined by the relationship between the polarization and the electric field and it can be determined by the calculations of the dipole moment fluctuations from the fluctuations–dissipation relation40 as follow: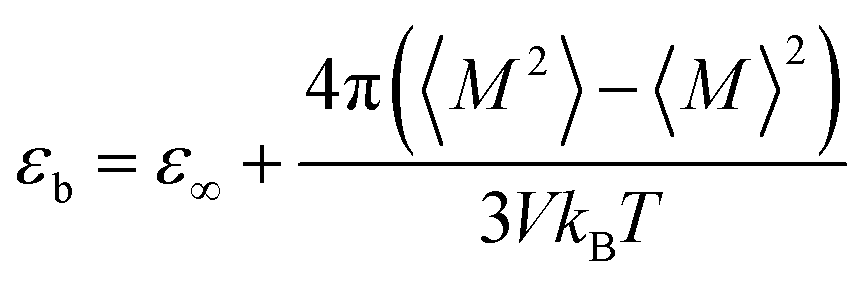 | (6) |
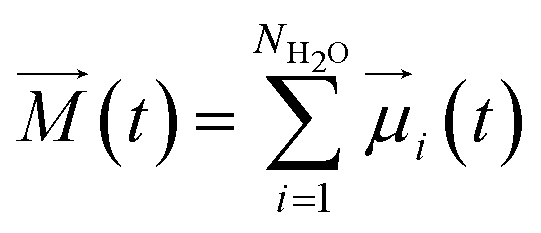 | (7) |
![[small mu, Greek, vector]](https://www.rsc.org/images/entities/i_char_e0e9.gif) i(t) the individual molecular dipole moment of the ith water molecule and NH2O is the number of water molecules. The term ε∞ in eqn (6) can be obtained from the Clausius–Mossotti eqn,41
i(t) the individual molecular dipole moment of the ith water molecule and NH2O is the number of water molecules. The term ε∞ in eqn (6) can be obtained from the Clausius–Mossotti eqn,41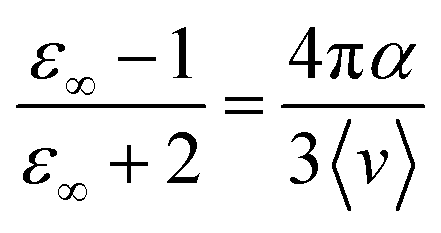 | (8) |
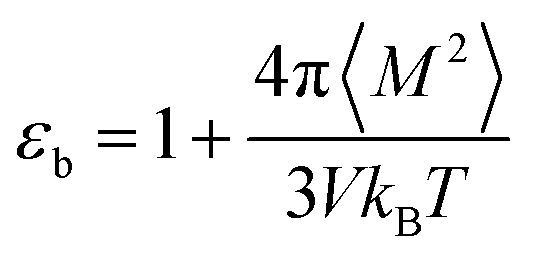
Since we considered a non-polarizable water model throughout this work, α = 0 and then eqn (8) leads to ε∞ = 1. Therefore, for non polarizable solvent molecules eqn (6) takes the form,
 | (9) |
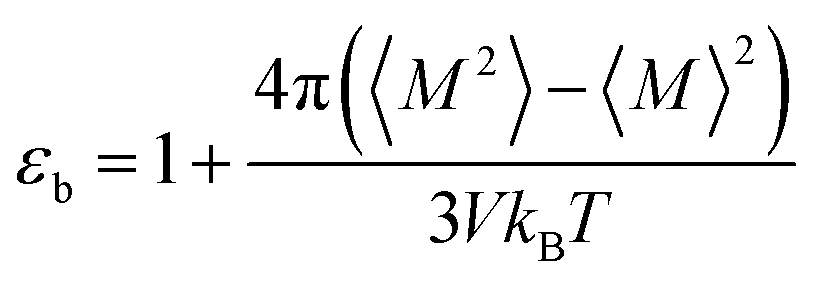
For an isotropic medium the ideal limit of zero net dipole moment signifies M = 0. εb can be calculated from the following relation for sufficiently long simulation,
 | (10) |
Throughout this work, eqn (10) was used to compute the dielectric constant of bulk phases. The total dipole moment of a system can be expressed as the integral of the local polarization density ![[P with combining right harpoon above (vector)]](https://www.rsc.org/images/entities/i_char_0050_20d1.gif) (r) over the entire system,42
(r) over the entire system,42
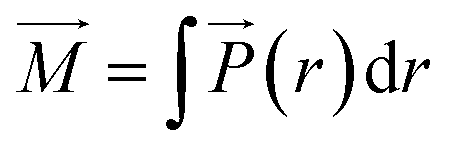 | (11) |
For non-uniform systems, like nanoconfined solutions, a local (i.e. space dependent) dielectric constant may be defined. This latter can be computed from dipolar fluctuations within the inhomogeneous fluid that can be characterized by the term 〈(r) × ![[M with combining right harpoon above (vector)]](https://www.rsc.org/images/entities/i_char_004d_20d1.gif) 〉 − 〈(r)〉 × 〈〉.40 We used this local approach to compute the dielectric constant of solutions confined inside silica nanopores (εp),
〉 − 〈(r)〉 × 〈〉.40 We used this local approach to compute the dielectric constant of solutions confined inside silica nanopores (εp),
 | (12) |
Note that (r) may be replaced by /V in a homogeneous medium.40 In that case eqn (12) becomes strictly equivalent to eqn (9) and then to eqn (10) for sufficiently long simulation times. We have performed additional calculations (results not shown) to check this point by computing the dielectric constant of water in bulk phase (εb,water) from the overall (i.e.eqn (10)) and the local (i.e.eqn (12)) methods. Results show that both methods give identical dielectric constants for simulation times longer than ∼3000 ps. In addition, the atoms of the silica material has not accounted for the calculation of the dipolar polarization and dielectric constant.
4. Results and discussion
Fig. 3 shows the radial profile of the dielectric constant of water inside the nanopore (εp,water).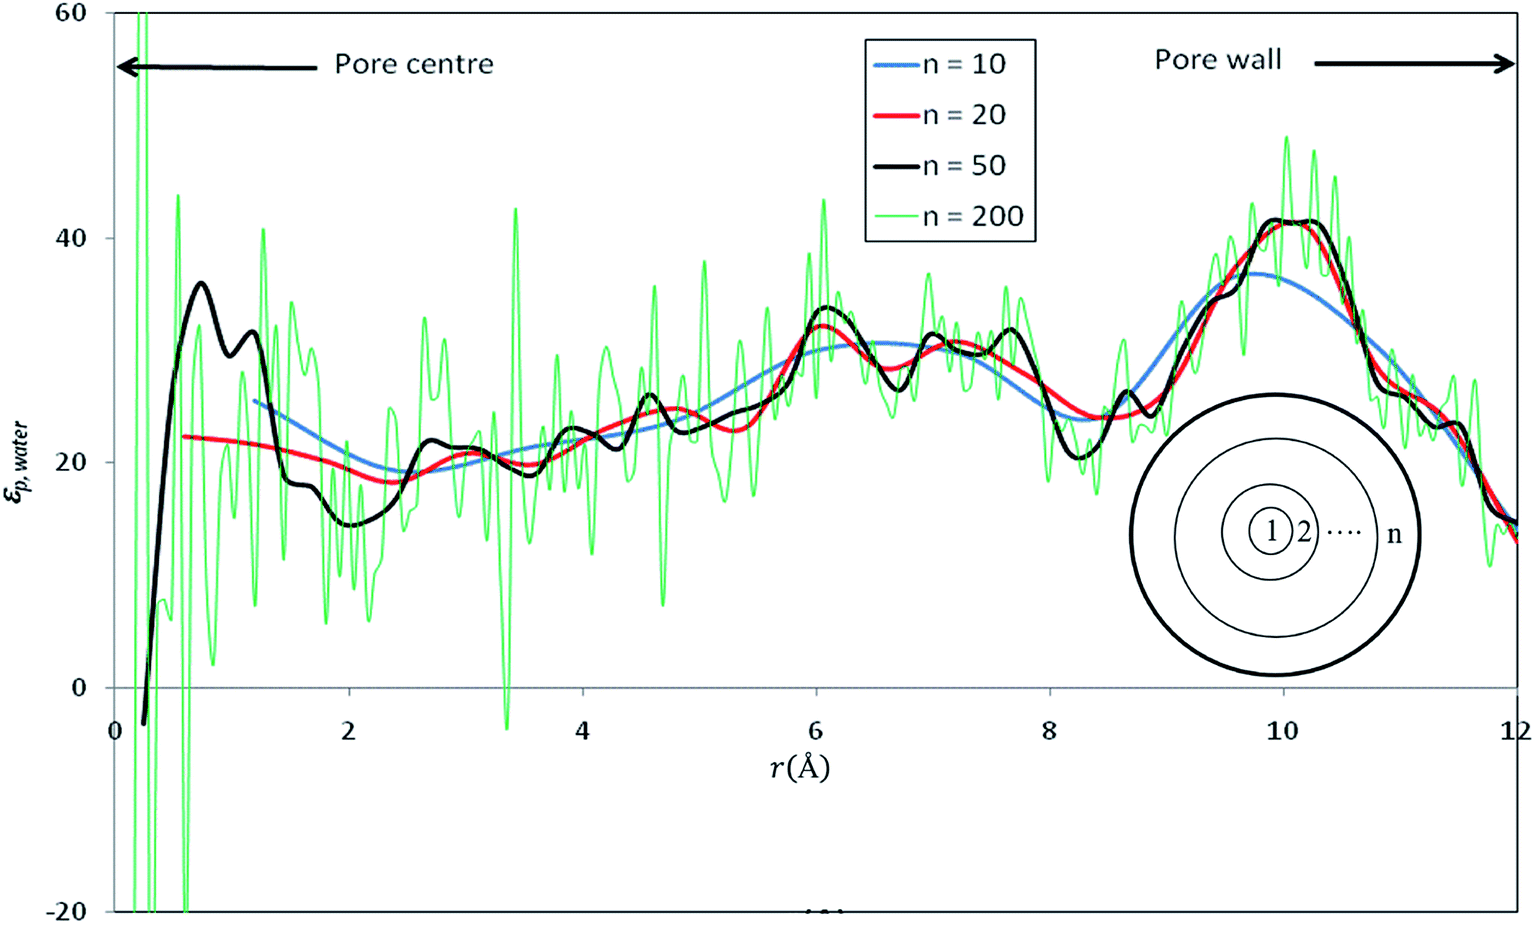 | ||
| Fig. 3 Radial profile of the dielectric constant of water inside nanopore (εp,water) computed by dividing the pore into various numbers of concentric shells (n). | ||
In order to have a deep understanding of the dielectric properties in nanoconfined water, we divided the silica cylindrical nanopore into n concentric radial shells as shown in inset of Fig. 3. The dielectric constant of confined pure water has been computed by applying eqn (12) in each concentric shell for various values of n. Results are shown in Fig. 3 for n = 10, 20, 50 and 200. Although some discrepancies appear locally, the average values of the dielectric constants are very close and almost independent of the number of concentric radial shells, at least up to n = 50 (see Table 2). For very large values of n, strong fluctuations appear in the dielectric constant profile (see e.g. n = 200 in Fig. 3) and a variation of the average dielectric constant of about 10% (see Table 2) is observed. Gereben and Pusztai have pointed out that the static dielectric constant computed from MD simulations may depend on the size of the system (i.e. the number of water molecules in the simulation).43 These authors found a variation of the dielectric constant of about 10% when considering systems ranging from 216 to 16![[thin space (1/6-em)]](https://www.rsc.org/images/entities/char_2009.gif) 000 polarizable water molecules and a non-monotonous variation of the dielectric constant with the system size. This is likely to affect our results since the number of water molecules within the n concentric shells (see inset of Fig. 3) differ from one shell to another.
000 polarizable water molecules and a non-monotonous variation of the dielectric constant with the system size. This is likely to affect our results since the number of water molecules within the n concentric shells (see inset of Fig. 3) differ from one shell to another.
| n | 10 | 20 | 50 | 200 |
|---|---|---|---|---|
| ε p,water (average value) | 25.5 | 25.4 | 25.5 | 23.2 |
When n is too large, the number of water molecules in each layer is quite low and statistical uncertainties on the fluctuation term on the right hand side of eqn (12) are dramatically amplified, which can even lead to nonphysical negative values as shown in Fig. 3 This might be an additional difficulty for the determination of dielectric constants inside pores of realistic nanoporous membranes whose effective diameters are expected to be 2–3 times smaller than that of our model nanopore.
Fig. 4 shows the radial variation of the ratio between the dielectric constant of confined water (εp,water) and the dielectric constant of bulk water (εb,water). The dielectric constant of pure water is found to be reduced by a factor of more than 2 with respect to its bulk value (the average εp,water/εb,water ratio was found to be 0.44; note that values obtained at the pore centre should not be considered because the analysis is biased by the low statistics resulting from the small number of water molecules inside the central cylindrical shell).
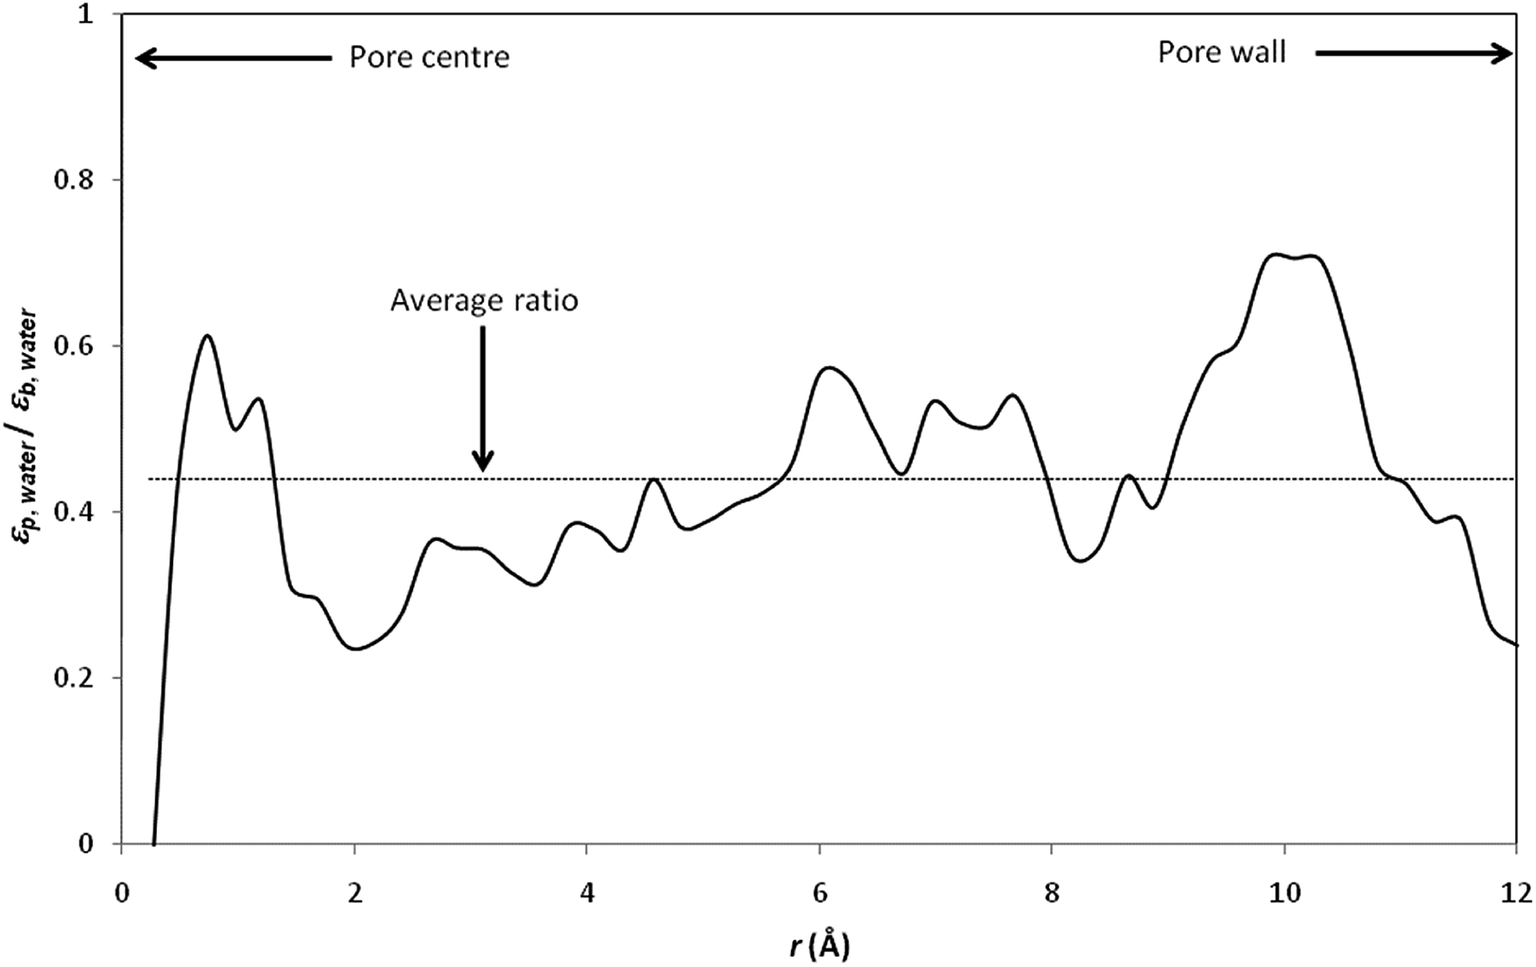 | ||
| Fig. 4 Ratio between the dielectric proprieties of confined water (εp,water) and the dielectric proprieties of bulk water (εb,water). The local dielectric constant inside the nanopore was computed by dividing the nanopore into 50 concentric radial shells (i.e. n = 50 in inset of Fig. 3). | ||
It should be stressed that the ratio εp,water/εb,water inferred from our simulations is significantly lower than that obtained by Senapati and Chandra for spherical cavities of 24.4 Å in diameter.21 Indeed, these authors obtained εp,water/εb,water ratios of 0.88 and 0.83 with SSD and SPC/E water models, respectively. Of course, the different geometries considered in Senapati and Chandra's work and in the present work make difficult a direct comparison between our results. Nevertheless, it should be noted that a recent MD study performed by Gereben and Pusztai has clearly shown that trajectories recorded for times shorter than 5–6 ns are not applicable for providing a good estimate of the dielectric constant.43 Unfortunately, Senapati and Chandra reported MD simulations performed over simulation times shorter than 2 ns including equilibration time. On the other hand, we performed data analysis of dielectric constants inside pore for the last 2 ns of our simulations, after 4–7 ns of equilibration, which means that our total simulation times were 7–10 ns.
In an attempt to understand the origin of the decrease in the dielectric constant of confined pure water we focused on the orientation of water molecules inside the nanopore. We define θ as the angle between the dipole moment of a water molecule (H2O) and the vector normal to the pore surface (![[N with combining right harpoon above (vector)]](https://www.rsc.org/images/entities/i_char_004e_20d1.gif) ) which connects the pore center and the center of mass of the oxygen atom of the water molecule (see Fig. 5).
) which connects the pore center and the center of mass of the oxygen atom of the water molecule (see Fig. 5).
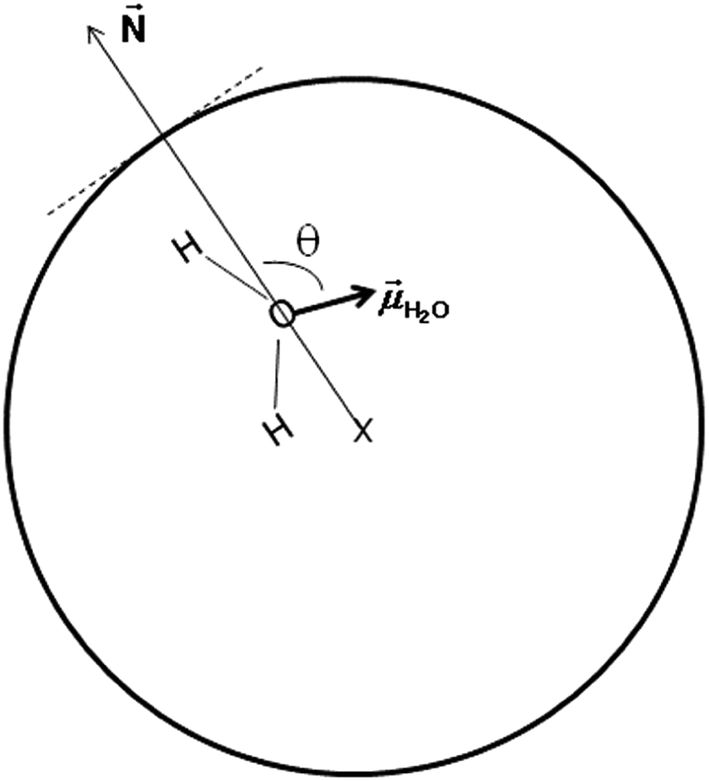 | ||
| Fig. 5 Schematic representation of the angle θ between the water dipole moment and the vector normal to the pore surface and connecting the pore center and the center of mass of the oxygen atom of the water molecule. | ||
Fig. 6 shows the distribution of water molecules inside the nanopore as a function of θ. The pore was divided into concentric shells of thickness 1 Å (i.e. n = 12, see inset in Fig. 3). Water molecules located within the first three shells in the vicinity of the pore surface (that is the first hydration layer) exhibit preferential orientation with θ ∼ 90–100° while molecules located farther from the surface do not align their dipole according to a preferential orientation with respect to the pore surface. This strong orientation of water dipoles in the vicinity of the surface may explain the decrease in the dielectric constant of pure water under confinement with respect to the bulk phase where water dipoles do not exhibit any preferential orientation. This decrease of dielectric constant was due to the fact that hydrogen bond (HB) rearrangement of water molecules was limited and led to a decrease in the fluctuations of water dipoles. In the first three shells that are closer to the interface, the preferred dipole orientation is a slight tilt toward the interface. This tilt is more pronounced closer to the interface. This behavior is consistent with water molecules participating in some H-bonds with interfacial oxygens and hydrogens, in addition to the water–water H-bonds.
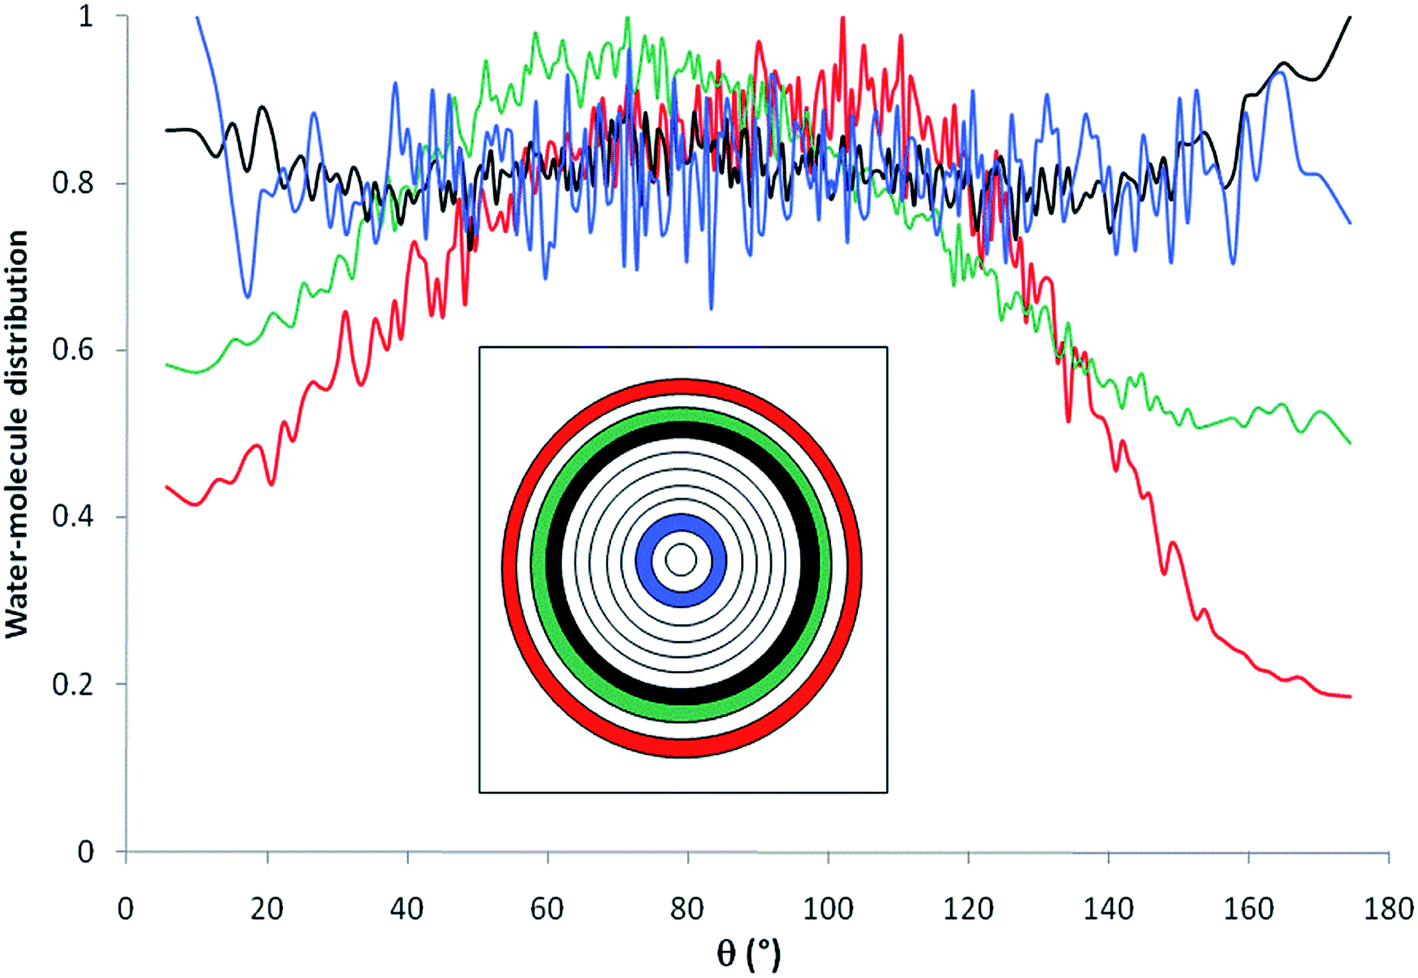 | ||
| Fig. 6 Water molecules orientations inside the nanopore (filled with pure water); θ represents the angle composed by the water dipole moment and the normal vector. The inset shows the location of the different layers inside the pore (n = 12). | ||
Another important parameter of dielectric properties is the so-called dielectric relaxation time of polar fluids, τrel, given by assuming a Debye exponential behavior of self-correlation function of dipole moments:44
| Φ(t) = exp(−t/τrel) | (13) |
 | (14) |
Fig. 7 compares the time correlation function of the dipole moments of pure water in bulk and confined phases respectively. It is clearly seen that dipole moments relax much faster in bulk phase than that of confined phase. The dynamical dielectric properties of water molecules can be performed via the correlation time of dipole moments, τ, computed as,45
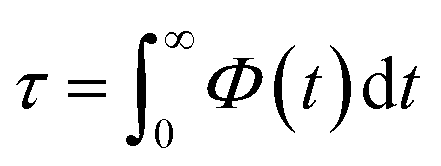 | (15) |
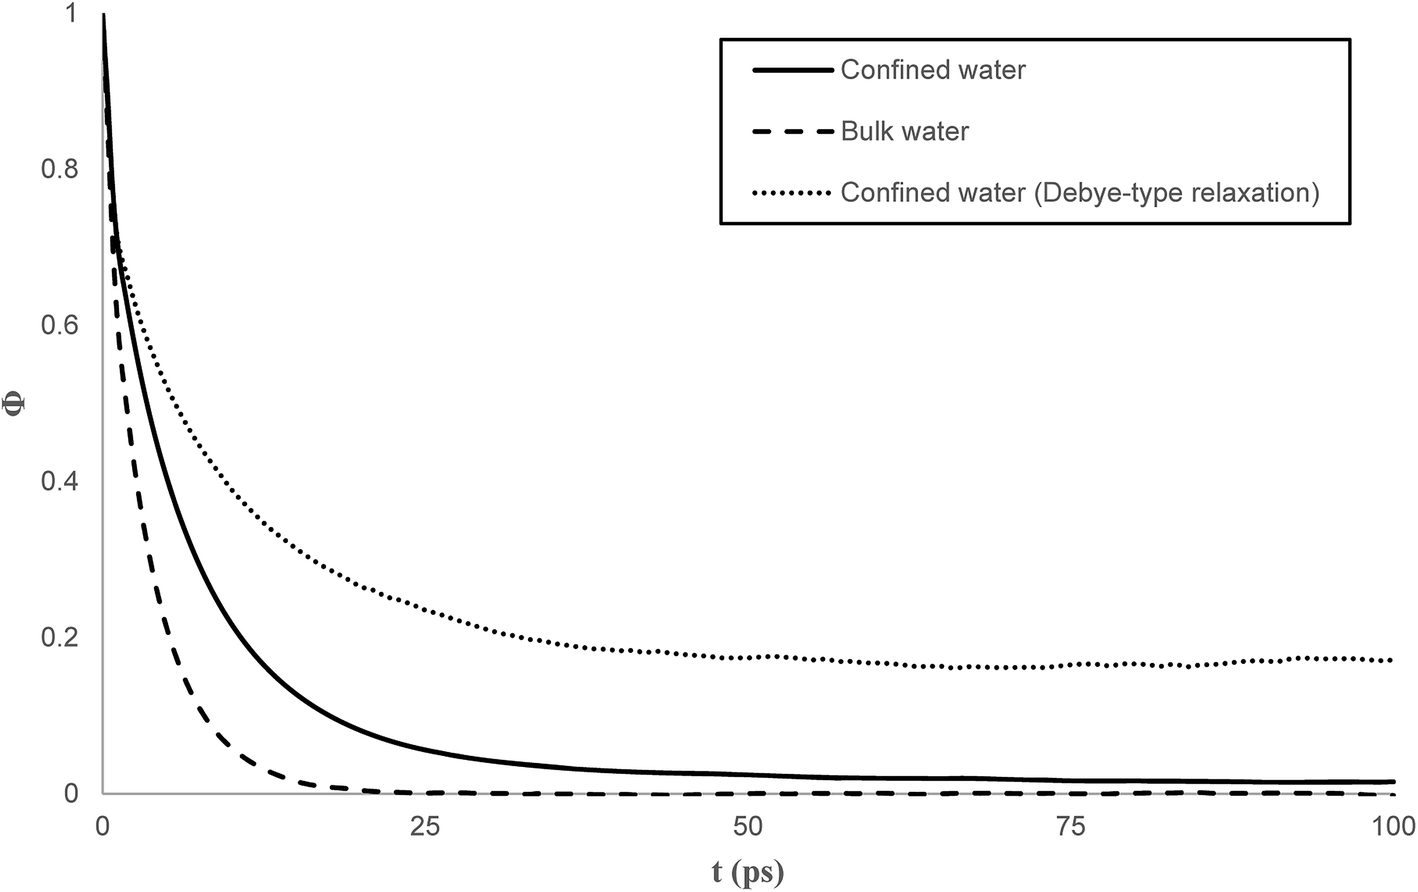 | ||
| Fig. 7 Self time correlation function of the dipole moments for bulk and confined water. | ||
In bulk phase, the correlation time of dipole moments of water in Fig. 7 was taken into account in eqn (13) and (15) and we obtained τ = 3.9 ps and τrel = 3.1 ps. The rather small difference between τ and τrel indicates that the behavior of bulk water is close to that of a Debye dielectric.
Interestingly, the correlation time of the moment dipoles rises to 16.7 ps inside the nanopore, which indicates that dipole moments remain oriented along fixed directions for much longer times than in bulk phase. Furthermore, the relaxation time τrel determined from eqn (13) is found to be 6.2 ps. Although the analysis of τ and τrel lead to a similar qualitative conclusion, i.e. water molecules relax much slower inside the nanopore than in the bulk phase, it can be noted that the large discrepancy between τ and τrel observed for confined water molecules indicate a different relaxation mode under nanoconfinement and confined water does not exhibit a Debye-type relaxation with a single relaxation time anymore. To get further insight in the dielectric properties of confined water we computed the time correlation function of the dipole moments in different areas inside the nanopore. Results are shown in Fig. 8 which clearly puts in evidence a distribution of the correlation times inside the nanopore with a delayed relaxation with respect to the bulk phase (see dotted line in Fig. 8) and a monotonous increase in the relaxation time when water molecules approach the pore surface (in the first interfacial shell we found τ > 200 ps from eqn (11)). This indicates a decrease in the rotational dynamics of water dipoles close to the pore surface.
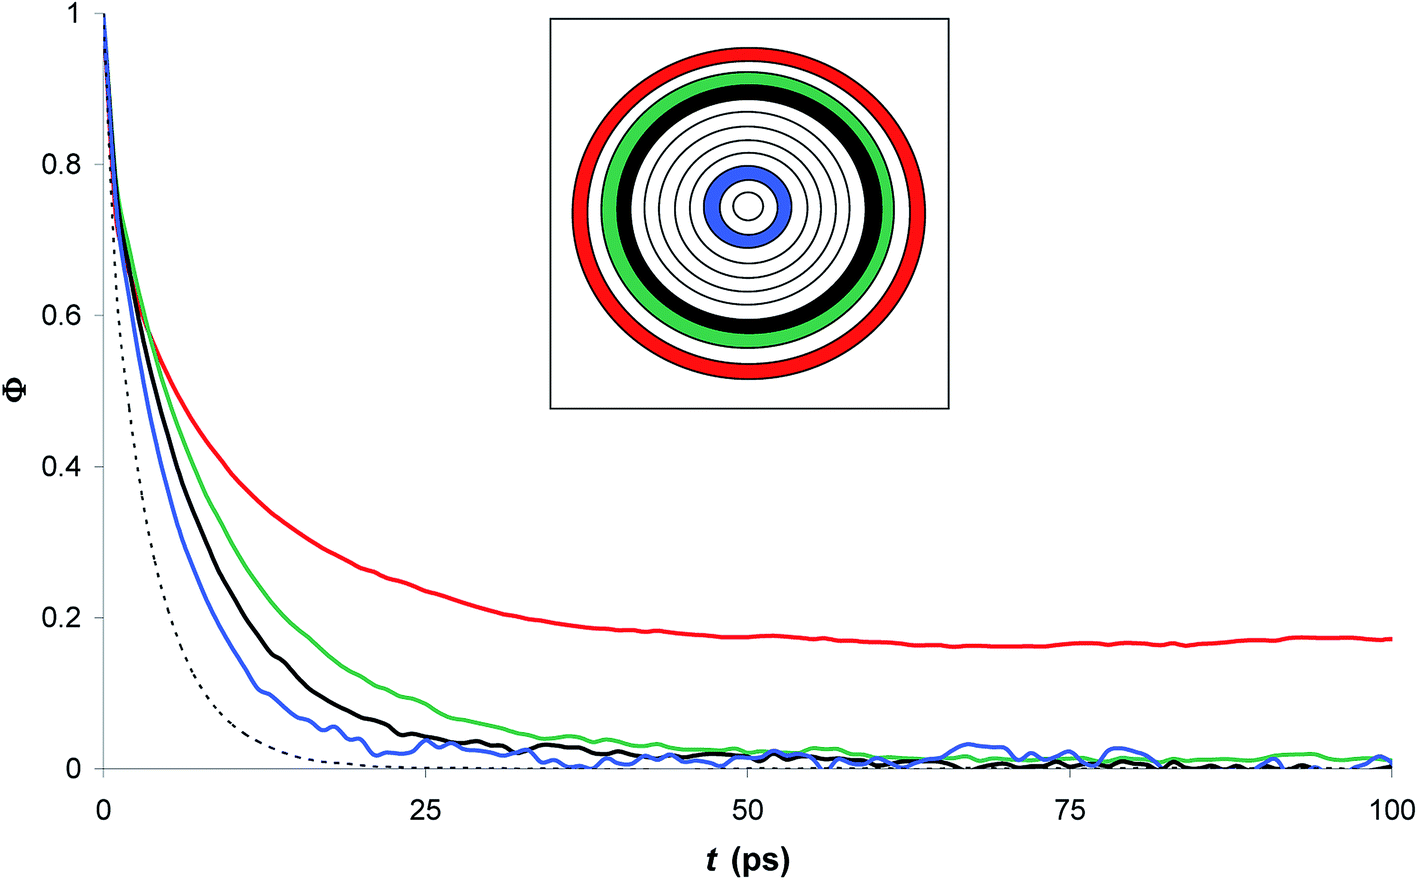 | ||
| Fig. 8 Time correlation function of the dipole moments in different zones inside the nanopore (filled with pure water). The inset shows the location of the different layers inside the pore (n = 12); dotted line: bulk water. | ||
Finally, it is interesting to note that although both the water density and the orientation of water dipoles (see Fig. 5) are bulk-like in the central part of the nanopore, the dielectric properties remain significantly affected by confinement.
5. Conclusion
In this work the computation of the density of liquid in a silica hydrophilic nanopore was executed by the grand canonical Monte Carlo (GCMC) and all the simulations were carried out in an efficient isothermal–isosurface–isobaric statistical ensemble. The local dielectric constants were computed from dipolar fluctuations within the inhomogeneous fluid. For very large values of concentric shells (n), strong fluctuations appear in the dielectric constant profile and a variation of the average dielectric constant of about 10% is observed. The dielectric constant of pure water was found to be reduced by a factor of more than 2 with respect to its bulk value (the average εp,water/εb,water ratio was found to be 0.44). That was imputed to water molecules located within the first three shells in the vicinity of the pore surface which exhibit preferential orientation with θ ∼ 90–100° in nanoconfined phase. Regarding the correlation time of the moment dipoles we observed that dipole moments remained oriented along fixed directions for much longer times than in bulk phase and the correlation times inside the nanopore had a delayed relaxation with respect to the bulk phase.Conflicts of interest
There are no conflicts to declare.Acknowledgements
This work was supported by National Natural Science Foundation of China (21603164) and Major Science and Technology Program for Water Pollution Control and Treatment (2017ZX07207004).References
- I. A. Wright, S. Wright, K. Graham and S. Burgin, Land Use Policy, 2011, 28, 353–360 CrossRef.
- V. Kumar, R. D. Parihar, A. Sharma, P. Bakshi, G. P. Singh Sidhu, A. S. Bali, I. Karaouzas, R. Bhardwaj, A. K. Thukral, Y. Gyasi-Agyei and J. Rodrigo-Comino, Chemosphere, 2019, 236, 124364 CrossRef CAS PubMed.
- S. Alzahrani and A. W. Mohammad, Journal of Water Process Engineering, 2014, 4, 107–133 CrossRef.
- P. Pal, in Industrial Water Treatment Process Technology, ed. P. Pal, Butterworth-Heinemann, 2017, pp. 173–242, DOI:10.1016/b978-0-12-810391-3.00005-9.
- W. R. Bowen, A. W. Mohammad and N. Hilal, J. Membr. Sci., 1997, 126, 91–105 CrossRef CAS.
- J. R. Werber, A. Deshmukh and M. Elimelech, Environ. Sci. Technol. Lett., 2016, 3, 112–120 CrossRef CAS.
- A. Szymczyk and P. Fievet, J. Membr. Sci., 2005, 252, 77–88 CrossRef CAS.
- A. Yaroshchuk, M. L. Bruening and E. Zholkovskiy, Adv. Colloid Interface Sci., 2019, 268, 39–63 CrossRef CAS PubMed.
- B. Balannec, A. Ghoufi and A. Szymczyk, J. Membr. Sci., 2018, 552, 336–340 CrossRef CAS.
- H. Zhu, A. Szymczyk and B. Balannec, J. Membr. Sci., 2011, 379, 215–223 CrossRef CAS.
- P. Ortiz-Albo, R. Ibanez, A. Urtiaga and I. Ortiz, Sep. Purif. Technol., 2019, 210, 746–753 CrossRef CAS.
- K. Jiang, H. Kuang, T. Qin, M. Song, J. Zhou, P. Yang, W. Zhuang, H. Ying and J. Wu, RSC Adv., 2018, 8, 12672–12683 RSC.
- O. Labban, C. Liu, T. H. Chong and J. H. Lienhard, J. Membr. Sci., 2018, 554, 26–38 CrossRef CAS.
- CN107096401-A.
- E. Glueckauf, Nature, 1966, 211, 1227–1230 CrossRef CAS.
- A. E. Yaroshchuk, Adv. Colloid Interface Sci., 2000, 85, 193–230 CrossRef CAS PubMed.
- R. Sardella, E. Camaioni, A. Macchiarulo, A. Gioiello, M. Marinozzi and A. Carotti, TrAC, Trends Anal. Chem., 2020, 122, 115703 CrossRef CAS.
- Z. Shariatinia and A. Mazloom-Jalali, J. Mol. Liq., 2019, 273, 346–367 CrossRef CAS.
- M. Arnittali, A. N. Rissanou and V. Harmandaris, Procedia Computer Science, 2019, 156, 69–78 CrossRef.
- X. Liu, T. Wang and M. He, J. Mol. Liq., 2019, 288, 111034 CrossRef CAS.
- S. Senapati and A. Chandra, J. Phys. Chem. B, 2001, 105, 5106–5109 CrossRef CAS.
- S. Varghese, S. K. Kannam, J. S. Hansen and S. P. Sathian, Langmuir, 2019, 35, 8159–8166 CrossRef CAS PubMed.
- C. Zhang, F. Gygi and G. Galli, J. Phys. Chem. Lett., 2013, 4, 2477–2481 CrossRef CAS.
- J. N. Israelachvili and R. M. Pashley, Nature, 1983, 306, 249–250 CrossRef CAS.
- M. F. Toney, J. N. Howard, J. Richer, G. L. Borges, J. G. Gordon, O. R. Melroy, D. G. Wiesler, D. Yee and L. B. Sorensen, Nature, 1994, 368, 444–446 CrossRef CAS.
- L. Fumagalli, A. Esfandiar, R. Fabregas, S. Hu, P. Ares, A. Janardanan, Q. Yang, B. Radha, T. Taniguchi, K. Watanabe, G. Gomila, K. S. Novoselov and A. K. Geim, Science, 2018, 360, 1339 CrossRef CAS PubMed.
- V. M. Gun'ko, V. V. Turov, V. M. Bogatyrev, V. I. Zarko, R. Leboda, E. V. Goncharuk, A. A. Novza, A. V. Turov and A. A. Chuiko, Adv. Colloid Interface Sci., 2005, 118, 125–172 CrossRef PubMed.
- S. Parez, M. Předota and M. Machesky, J. Phys. Chem. C, 2014, 118, 4818–4834 CrossRef CAS.
- R. L. C. Vink and G. T. Barkema, Phys. Rev. B: Condens. Matter Mater. Phys., 2003, 67, 245201 CrossRef.
- A. Bródka and T. W. Zerda, J. Chem. Phys., 1996, 104, 6319–6326 CrossRef.
- M. Allen and D. Tildesley, Computer simulation of liquids, Oxford, New York, 1989, p. 385 Search PubMed.
- J.-P. Ryckaert, G. Ciccotti and H. J. Berendsen, J. Comput. Phys., 1977, 23, 327–341 CrossRef CAS.
- A. Ghoufi, D. Morineau, R. Lefort and P. Malfreyt, J. Chem. Theory Comput., 2010, 6, 3212–3222 CrossRef CAS PubMed.
- A. Ghoufi, D. Morineau, R. Lefort, I. Hureau, L. Hennous, H. Zhu, A. Szymczyk, P. Malfreyt and G. Maurin, J. Chem. Phys., 2011, 134, 074104 CrossRef PubMed.
- J. E. Lennard-Jones, Proc. R. Soc. A, 1924, 106, 463–477 Search PubMed.
- P. Ewald, Ann. Phys., 1921, 64, 253–287 CrossRef.
- J. L. Abascal and C. Vega, J. Chem. Phys., 2005, 123, 234505 CrossRef CAS PubMed.
- W. Smith and T. Forester, J. Mol. Graphics, 1996, 14, 136–141 CrossRef CAS PubMed.
- D. J. Evans and B. L. Holian, J. Chem. Phys., 1985, 83, 4069–4074 CrossRef CAS.
- V. Ballenegger and J.-P. Hansen, J. Chem. Phys., 2005, 122, 114711 CrossRef CAS PubMed.
- G. Lamoureux, A. D. MacKerell and B. Roux, J. Chem. Phys., 2003, 119, 5185–5197 CrossRef CAS.
- H. A. Stern and S. E. Feller, J. Chem. Phys., 2003, 118, 3401–3412 CrossRef CAS.
- O. Gereben and L. Pusztai, Chem. Phys. Lett., 2011, 507, 80–83 CrossRef CAS.
- J. Martí, E. Guàrdia and J. A. Padró, J. Chem. Phys., 1994, 101, 10883–10891 CrossRef.
- M. Neumann, J. Chem. Phys., 1986, 85, 1567–1580 CrossRef CAS.
| This journal is © The Royal Society of Chemistry 2020 |