 Open Access Article
iTRAQ-based proteomic analysis reveals several key metabolic pathways associated with male sterility in Salvia miltiorrhiza†
Ruihong Wang‡
ab,
Congyu Lu‡c,
Zhiming Shua,
Xinbo Yuana,
Han Jiangb and
Hongbo Guo *a
*a
aCollege of Chemistry and Pharmacy, Northwest A&F University, Yangling 712100, China. E-mail: hbguo@nwsuaf.edu.cn
bCollege of Life Sciences, Northwest A&F University, Yangling 712100, China
cCentre for Bioinformatics & Computational Biology, University of Delaware, Newark, DE 19713, USA
First published on 30th April 2020
Abstract
Male sterility is a common phenomenon in flowering plants, and it has been widely used in hybrid seed production in a number of economically important crops. In 2002, our team discovered a natural male sterile mutant of Salvia miltiorrhiza. It provided us with the possibility of obtaining stable and controllable quality. To study the molecular mechanism of male sterility in S. miltiorrhiza, we generated proteomic profiles comparing the male sterile mutant type (MT) and wild type (WT) using iTRAQ sequencing. We found a total of 639 differential abundant proteins (DAPs) between MT and WT buds. The DAPs associated with male sterility were mainly involved in (1) carbohydrate and energy metabolism, and (2) protein synthesis and degradation. Based on a comparison between the protein expression profiles of MT and WT, we elucidated a potential protein interaction network involved in male sterility. These results provide new potential biomarkers and insights into the molecular mechanism of male sterility in S. miltiorrhiza.
1. Introduction
Cardiovascular and cerebrovascular diseases are some of the most prevalent causes of global mortality.1–3 S. miltiorrhiza is one of the major traditional Chinese medicinal materials in China and it has been widely used for the treatment of cardiovascular, cerebrovascular, and hyperlipidemia diseases, and acute ischemic stroke.4–6 Due to increasing demand, its planting area has expanded rapidly.7 S. miltiorrhiza cultivation is affected by factors such as climate and region, which lead to variable amounts of active ingredients.8,9 However, there has been no effective method to produce hybrid S. miltiorrhiza seeds, which is very unfavorable for its cultivation and further use.Due to the fact that S. miltiorrhiza is a hermaphrodite plant, self-pollination has to be ruled out to conduct hybrid breeding. As a result, laborious emasculation has to be performed to prevent some S. miltiorrhiza plants from producing pollen so that they serve only as the female parents and are capable of taking pollen from other S. miltiorrhiza plants.10 Fortunately, Shu et al. discovered a natural male sterile mutant of S. miltiorrhiza in 2002. It provides the possibility to obtain stable and controllable quality. Male sterility can be divided into several types, such as cytoplasmic male sterility (CMS), genic male sterility (GMS) and thermo-photo sensitive genic male sterility (TPSGMS), which are found in Zea mays, Oryza sativa, Brassica napus, and Triticum aestivum.11–15 Through continuous backcross and testcross in 2006–2009, we found that S. miltiorrhiza male sterility belonged to the GMS type.16,17 Male sterility plays a significant role in hybrid breeding, and it is a good way to generate stronger plants and to produce high-quality F1 hybrid seeds.18 The GMS is a very stable genetic system that includes fertile (MsfMs) and sterile (MsMs) plants that segregate in a 1![[thin space (1/6-em)]](https://www.rsc.org/images/entities/char_2009.gif) :
:![[thin space (1/6-em)]](https://www.rsc.org/images/entities/char_2009.gif) 1 ratio. The GMS also has many advantages compared with CMS, such as stability, complete sterility, no negative cytoplasmic effects, and extensive distribution of fertility restorer genes. Therefore, male sterile mutant type (MT) and wild type (WT) flower buds of the GMS are ideal materials for studying male sterility in S. miltiorrhiza. Based on our previous study, we hypothesize that the abnormal tapetum disintegration could be the key factor that causes pollen sterility in the MT of S. miltiorrhiza.19 To test this we obtained genetically stable near-isogenic male fertile lines and male sterile lines.8 The discovery of male sterile lines in S. miltiorrhiza opened a new gate for its hybrid breeding. These lines can be used as the female parent for hybrid breeding without performing emasculation, which will greatly reduce the time and labors needed for the hybrid breeding process. However, the mechanisms that regulate the male sterility of S. miltiorrhiza are still unknown, which will greatly hinder its utilization in hybrid breeding.
1 ratio. The GMS also has many advantages compared with CMS, such as stability, complete sterility, no negative cytoplasmic effects, and extensive distribution of fertility restorer genes. Therefore, male sterile mutant type (MT) and wild type (WT) flower buds of the GMS are ideal materials for studying male sterility in S. miltiorrhiza. Based on our previous study, we hypothesize that the abnormal tapetum disintegration could be the key factor that causes pollen sterility in the MT of S. miltiorrhiza.19 To test this we obtained genetically stable near-isogenic male fertile lines and male sterile lines.8 The discovery of male sterile lines in S. miltiorrhiza opened a new gate for its hybrid breeding. These lines can be used as the female parent for hybrid breeding without performing emasculation, which will greatly reduce the time and labors needed for the hybrid breeding process. However, the mechanisms that regulate the male sterility of S. miltiorrhiza are still unknown, which will greatly hinder its utilization in hybrid breeding.
Male sterility is the abnormal development of the stamens of flowering plants, which cannot produce normal pollen, but their pistils develop normally and can accept normal pollen and fertilize.13 Plant male sterility is an important way to exploit the heterosis of crops, and utilizing heterosis is of great significance in crop breeding.20 It can improve crop yield and quality, and improve disease resistance and stress resistance. Especially in the breeding and seed production of crops, it plays an important role and has achieved great success in production.12,13,21 In recent years, previous physiological and biochemical studies on male sterility materials have focused on the following: changes in soluble sugar, starch content and soluble protein content; differences in the activity of endogenous hormones and enzymes related to the metabolism of reactive oxygen species.9 Studies have shown that plant male sterility is related to abnormal metabolism of substances, energy metabolism, and peroxide protective enzymes, but the correlation is not consistent.22–24 Male sterility can be attributed to many reasons, such as did not grow and differentiate normally of anthers, did not occur normal microspores, did not release mature pollen grains and did not germinate on the surface of stigma of mature pollen grains.24,25 Male sterility have been widely used in maize, wheat and rice.13,26–28 So far, no certain gene related to male sterility of S. miltiorrhiza has been identified and functionally characterized. To use male sterile mutant S. miltiorrhiza in hybrid breeding, it is of great importance to study the molecular mechanisms of its male sterility.
With the continuous development of new techniques and methods of molecular biology, it provides new methods for the research of plant male sterility and shows a broad application prospect in making full use of male sterility to improve crop yield and optimize quality assisted selection breeding.29–34 To further investigate the molecular mechanism of male sterility in S. miltiorrhiza, a differential proteomics analysis was performed to compare MT and WT flower buds using an iTRAQ-based strategy. There is an increase in the application of proteomics to identify global changes of proteins.35–37 Previous proteomics studies were mostly limited to 2D gel electrophoresis.38 iTRAQ has also been used to study male sterility in some other plant species due to its unique advantages.39,40 This research aimed to obtain the key DAPs and to identify the significantly enriched pathways involved in male sterility by comparing the male sterile mutant type (MT) and wild type (WT) S. miltiorrhiza flower buds using an iTRAQ-based strategy. These results will lay the foundation for exploring the genetic and molecular mechanisms that underlie male sterility in S. miltiorrhiza.
2. Materials and methods
2.1 Plant materials
This article used the flowers of male sterile mutant type (MT) and wild type (WT) S. miltiorrhiza as experimental materials, which picked up from a botanical garden of S. miltiorrhiza at Northwest A&F University in Xianyang City, Shaanxi Province, China (ESI Fig. S1†). The MT and WT flower buds were collected under sterile conditions, immediately frozen and stored in liquid nitrogen at −80 °C before the protein extraction.2.2 Protein extraction and iTRAQ labeling
Three independent biological replicates performed in our experiment. Three internal standards (IS-1, IS-2, and IS-3) were prepared by mixing one biological replicate from the six tested samples. Protein extraction performed using TCA (trichloroacetic acid)-acetone method with some modifications.41 Flowers were ground to powder in liquid nitrogen using a mortar and pestle. The powder was mixed with cold acetone which contains 10% (w/v) TCA and 0.07% (w/v) 2-mercaptoethanol and then precipitated for 2 h at −20 °C. After centrifuging at 25![[thin space (1/6-em)]](https://www.rsc.org/images/entities/char_2009.gif) 000 × g for 30 min, the pellet was washed with cold acetone twice and suspended in buffer containing 8 M urea, 4% CHAPS, 2% ampholyte and 20 mM DTT. After centrifuging at 25
000 × g for 30 min, the pellet was washed with cold acetone twice and suspended in buffer containing 8 M urea, 4% CHAPS, 2% ampholyte and 20 mM DTT. After centrifuging at 25![[thin space (1/6-em)]](https://www.rsc.org/images/entities/char_2009.gif) 000g for 60 min, the supernatant underwent a reductive alkylation reaction. The concentration of the protein solution was determined using the Bradford method with BSA as a standard. For protein digestion, 100 μg of protein sample was digested with trypsin at 20
000g for 60 min, the supernatant underwent a reductive alkylation reaction. The concentration of the protein solution was determined using the Bradford method with BSA as a standard. For protein digestion, 100 μg of protein sample was digested with trypsin at 20![[thin space (1/6-em)]](https://www.rsc.org/images/entities/char_2009.gif) :
:![[thin space (1/6-em)]](https://www.rsc.org/images/entities/char_2009.gif) 1 (w/w) for 4 h at 37 °C and then digested 8 h at 37 °C after adding the same amount trypsin. Sample digestions were vacuum dried and reconstituted with 0.5 M TEAB. iTRAQ labeling was performed using iTRAQ 8-plex kits (AB Sciex, USA) according to the manufacturer's protocol.42
1 (w/w) for 4 h at 37 °C and then digested 8 h at 37 °C after adding the same amount trypsin. Sample digestions were vacuum dried and reconstituted with 0.5 M TEAB. iTRAQ labeling was performed using iTRAQ 8-plex kits (AB Sciex, USA) according to the manufacturer's protocol.42
2.3 SCX chromatography and LC-ESI-MS/MS analysis
The iTRAQ-labeled samples mixed, lyophilized and resolved in 4 ml buffer A (25 mM NaH2PO4 in 25% ACN, pH 2.7). The LC-20AB HPLC equipped with an Ultremex SCX column (4.6 × 250 mm) was used for peptides fractionation. The peptides were eluted from the column with a gradient buffer B (25 mM NaH2PO4, 1 M KCl in 25% ACN, pH 2.7) (0–7 min, 5% buffer B; 7–27 min, 5–60% buffer B; 27–29 min, 60–100% buffer B; 29–30 min, 100% buffer B; 30–40 min, 100–5% buffer B) at a flow rate of 1 ml min−1. The elution was monitored by absorbance at 214 nm. A total of 20 fractions were collected, desalted by StrataX column and vacuum lyophilized. Each fraction was resolved in buffer C (5% ACN, 0.1% FA) to a final concentration of approximately 0.5 μg μl−1 and centrifuged at 20![[thin space (1/6-em)]](https://www.rsc.org/images/entities/char_2009.gif) 000g for 10 min. 5 μl (approximately 2.5 μg) supernatant was separated by Shimadzu LC-20AD Nano-HPLC system. The samples were loaded onto the trap column within 4 min at a flow rate of 8 μl min−1 and eluted onto an analytical column with a gradient buffer D (95% ACN, 0.1% FA) (0–5 min, 5% buffer B; 5–40 min, 5–35% buffer B; 40–45 min, 35–60% buffer B; 45–47 min, 60–80% buffer B; 47–49 min, 80% buffer B; 49–50 min, 80–5% buffer B; 50–60 min, 5% buffer B) at a flow rate of 300 μl min−1. For the tandem mass spectrometry analysis, Q-exactive (Thermo Fisher Scientific, San Jose, CA) was applied. Intact peptides were detected at a resolution of 70
000g for 10 min. 5 μl (approximately 2.5 μg) supernatant was separated by Shimadzu LC-20AD Nano-HPLC system. The samples were loaded onto the trap column within 4 min at a flow rate of 8 μl min−1 and eluted onto an analytical column with a gradient buffer D (95% ACN, 0.1% FA) (0–5 min, 5% buffer B; 5–40 min, 5–35% buffer B; 40–45 min, 35–60% buffer B; 45–47 min, 60–80% buffer B; 47–49 min, 80% buffer B; 49–50 min, 80–5% buffer B; 50–60 min, 5% buffer B) at a flow rate of 300 μl min−1. For the tandem mass spectrometry analysis, Q-exactive (Thermo Fisher Scientific, San Jose, CA) was applied. Intact peptides were detected at a resolution of 70![[thin space (1/6-em)]](https://www.rsc.org/images/entities/char_2009.gif) 000, and ion fragments were detected in the Orbitrap at a resolution of 17
000, and ion fragments were detected in the Orbitrap at a resolution of 17![[thin space (1/6-em)]](https://www.rsc.org/images/entities/char_2009.gif) 500. Peptides were dissociated by high-energy collision dissociation (HCD) mode with a normalized collision energy of 27% ± 12%. 15 precursor ions, with a 2+ to 5+ charge state and an ion count above 20
500. Peptides were dissociated by high-energy collision dissociation (HCD) mode with a normalized collision energy of 27% ± 12%. 15 precursor ions, with a 2+ to 5+ charge state and an ion count above 20![[thin space (1/6-em)]](https://www.rsc.org/images/entities/char_2009.gif) 000, were selected for MS/MS scans. The dynamic exclusion duration was set for half of the peak width and the electrospray voltage applied was 1.6 kV. The spectra generated by the Orbitrap was optimized using automatic gain control. The MS scan range was 350–2000 Da.
000, were selected for MS/MS scans. The dynamic exclusion duration was set for half of the peak width and the electrospray voltage applied was 1.6 kV. The spectra generated by the Orbitrap was optimized using automatic gain control. The MS scan range was 350–2000 Da.
2.4 RNA extraction and quantitative real time PCR (RT-qPCR) validation
Total RNA was extracted with RNA Pure Plant Kit (Tiangen Biotech Co., Ltd, Beijing, China). The total RNA concentration and 28S/18S were determined using NanoDrop ND-1000 Spectrophotometer (NanoDrop Technologies Inc., USA). 1 μg total RNA from each sample was reverse transcribed into cDNA using PrimeScript™ RT reagent kit with gDNA Eraser (Perfect Real Time, Takara, Japan). GenScript Real-time PCR online software was adopted to build sequencing primers, represented in ESI Table S1.† RT-qPCR was performed in a CFX96 Real-Time PCR Detection System (Bio-Rad, USA) using SYBR green master mix (Takara Biotech Co., Ltd, Japan) according to the manufacturer's instructions. The cycling conditions were composed of 30 s at 95 °C, followed by 40 cycles of 95 °C for 5 s, 60 °C for 30 s. β-Actin was used as an internal control. Three independent technical replicates and three biological replicates for each sample were run to measure and assess to perform RT-qPCR.2.5 Data analysis and functional annotations
All raw mass data were searched using MASCOT version 2.3.02 (Matrix Science, London, United Kingdom) against S. miltiorrhiza databases. Searches were performed with the following parameters: fragment mass tolerance was set to ±0.05 Da; peptide mass tolerance was set to ±20 ppm; full tryptic specificity was required with one missed cleavage allowed; carbamidomethyl (C), iTRAQ 8plex (N-term) and iTRAQ 8plex (K) were set as fixed modifications; Gln → pyro-Glu (N-term Q), oxidation (M) and iTRAQ 8plex (Y) were set as variable modifications. The iTRAQ 8-plex was chosen for quantification during the search. A 1.2- or 0.8-fold change was set to determine differentially expressed proteins. A p-value of 0.05 (p ≤ 0.05) implies that the accepted false discovery rate (FDR) is 5%. Identified proteins were categorized based on the molecular function, biological process, and cellular components using gene ontology (GO) annotation.35 COG (cluster of orthologous groups of proteins) analysis of the identified proteins was performed for functional annotation.36 A kyoto encyclopedia of genes and genomes (KEGG) analysis of the identified proteins was conducted for pathway annotation.37 GO and pathway enrichment analysis were also performed to replenish functional and biological properties of the differentially expressed proteins. Interactions of the identified proteins were constructed with the online analysis tool STRING 9.1.38 To show simplified main pathways and major proteins, the identified important nodes and interconnected proteins that make a link between them were extracted from the whole network by using Cytoscape.3. Results
3.1 Basic information for protein identification
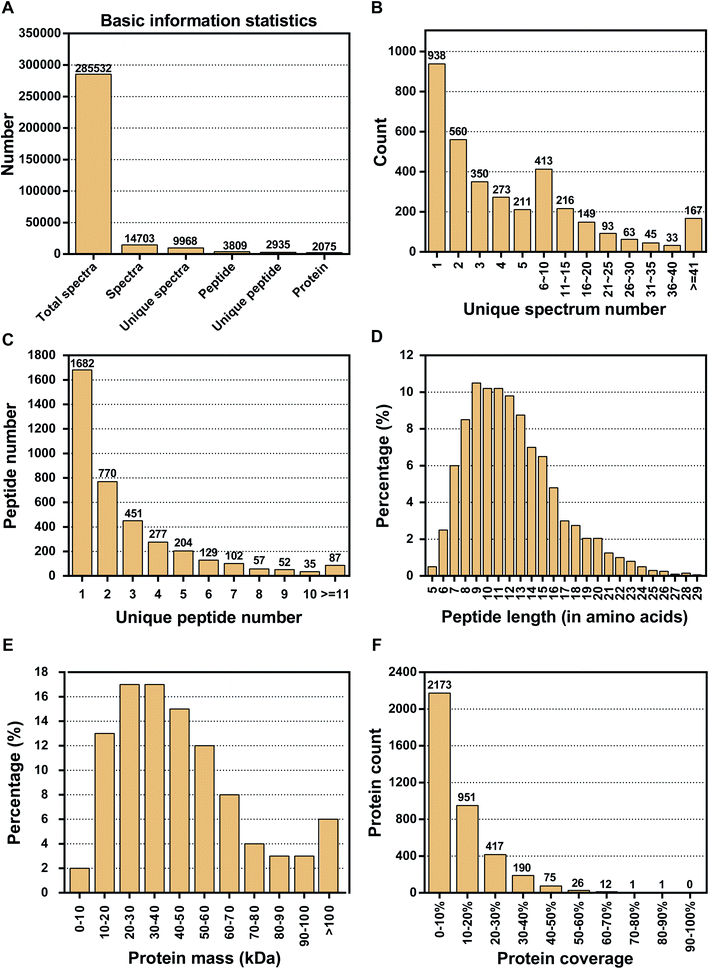
Proteins play a role in most cellular functions and processes, and proteomics offers a direct and integrated perspective on cellular processes. Thus, to investigate the DAPs that are associated with floral organ development in S. miltiorrhiza, we performed an iTRAQ analysis on MT and WT. iTRAQ tag labeling of all samples included three independent replicates from both WT and MT. The iTRAQ-based strategy was applied in the proteomic analysis of S. miltiorrhiza, with the workflows shown in Fig. 1. After processing MS/MS spectra in Mascot software, a total of 285![[thin space (1/6-em)]](https://www.rsc.org/images/entities/char_2009.gif) 532 mass spectra were generated (Fig. 2A). Of these, 14
532 mass spectra were generated (Fig. 2A). Of these, 14![[thin space (1/6-em)]](https://www.rsc.org/images/entities/char_2009.gif) 703 spectra matched to known spectra and 3809 peptides and 2935 unique peptides were identified. After data filtering to eliminate low scoring spectra, a total of 9968 unique spectra met the strict confidence criteria. The LC-MS/MS data were processed by proteome discover 2.1 and 2075 proteins were identified. In this paper, the distribution of the unique spectrum numbers, the unique peptide number, the peptide length, the protein mass, and the protein coverage were shown in Fig. 2B–F. In Fig. 2B, most of the identified spectra contained fewer than ten spectra. Most of the identified proteins contained fewer than five peptides, and >43% of the proteins were mapped with one unique peptide (Fig. 2C). The length of the peptide was mainly distributed in 7–15 amino acids shown in Fig. 2D. In terms of protein mass distribution, we found good coverage (2–17% of total proteins in each molecular group) for a wide molecular weight range from 0 kDa to >100 kDa (Fig. 2E). The distribution of the peptide sequence coverage is shown in Fig. 2F. Peptide coverage of 0–20% accounts for 81% (3124) of the total proteins, while coverage levels >20% account for only 19% (722) of the total proteins.
703 spectra matched to known spectra and 3809 peptides and 2935 unique peptides were identified. After data filtering to eliminate low scoring spectra, a total of 9968 unique spectra met the strict confidence criteria. The LC-MS/MS data were processed by proteome discover 2.1 and 2075 proteins were identified. In this paper, the distribution of the unique spectrum numbers, the unique peptide number, the peptide length, the protein mass, and the protein coverage were shown in Fig. 2B–F. In Fig. 2B, most of the identified spectra contained fewer than ten spectra. Most of the identified proteins contained fewer than five peptides, and >43% of the proteins were mapped with one unique peptide (Fig. 2C). The length of the peptide was mainly distributed in 7–15 amino acids shown in Fig. 2D. In terms of protein mass distribution, we found good coverage (2–17% of total proteins in each molecular group) for a wide molecular weight range from 0 kDa to >100 kDa (Fig. 2E). The distribution of the peptide sequence coverage is shown in Fig. 2F. Peptide coverage of 0–20% accounts for 81% (3124) of the total proteins, while coverage levels >20% account for only 19% (722) of the total proteins.
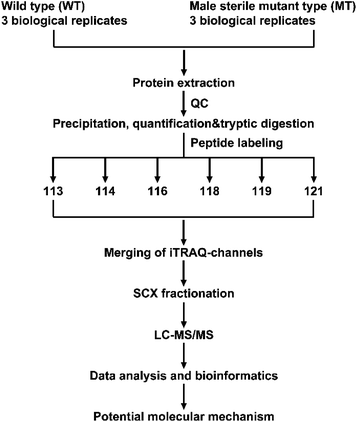 | ||
| Fig. 1 Workflow in this study to obtain the proteome expression profile of S. miltiorrhiza between WT and MT. | ||
3.2 Analysis of DAPs between MT and WT flower buds
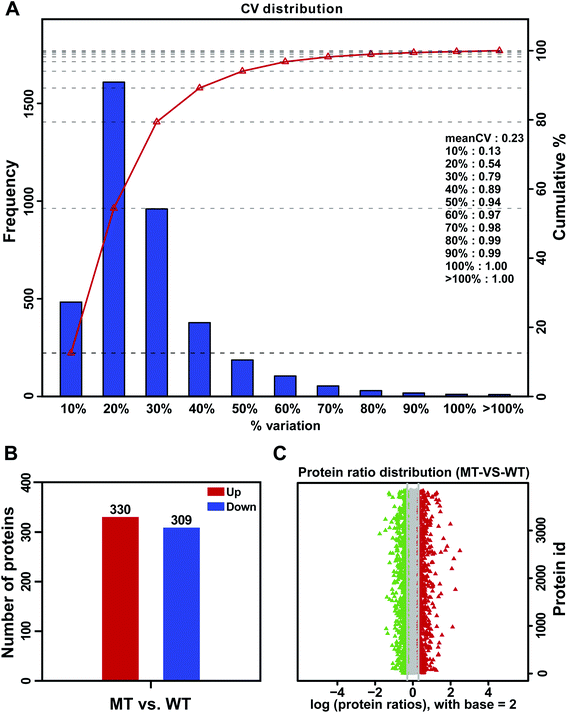
Analysis of DAPs between MT and WT flower buds can provide valuable information for studying the male sterility of S. miltiorrhiza. In this study, the average variation in three biological replicates of MT and WT was 23% (Fig. 3A). To ensure the accuracy of differential protein expression, the DAPs were identified by iTRAQ using the restrictive conditions of difference ratio > 1.2-fold change and p-value < 0.05. Based on these criteria, a total of 639 DAPs were obtained, which included 330 upregulated proteins and 309 downregulated proteins in MT compared with WT flower buds (Fig. 3B). The volcano plots of DAPs were shown in Fig. 3C.3.3 COG functional classification of DAPs
To obtain a deeper understanding of the functions of the DAPs, a cluster of orthologous groups of proteins (COG) analysis was performed.43 As shown in Fig. 4, 37.2% (238) of the DAPs didn't have COG or they belonged to the category with unknown function. A total of 389 DAPs were mainly classified into the categories of “general function prediction only”, “carbohydrate transport and metabolism”, “energy transport and metabolism”, “amino acid transport and metabolism”, “secondary metabolite biosynthesis, transport, and catabolism”, “lipid transport and metabolism”, “translation, ribosomal structure and biogenesis”, “posttranslational modification, protein turnover, and chaperones”, “signal transduction mechanisms” and “cytoskeleton”, accounting for 55, 45, 35, 34, 26, 25, 49, 76 and 20 proteins, respectively. Also, COG functions were largely enriched in the categories of carbohydrate transport and metabolism (11.1%); energy transport and metabolism (8.6%); translation, ribosomal structure and biogenesis (12.1%); and posttranslational modification, protein turnover, chaperone (18.7%). The analysis of these DAPs should improve our understanding of the mechanism behind male sterility in MT.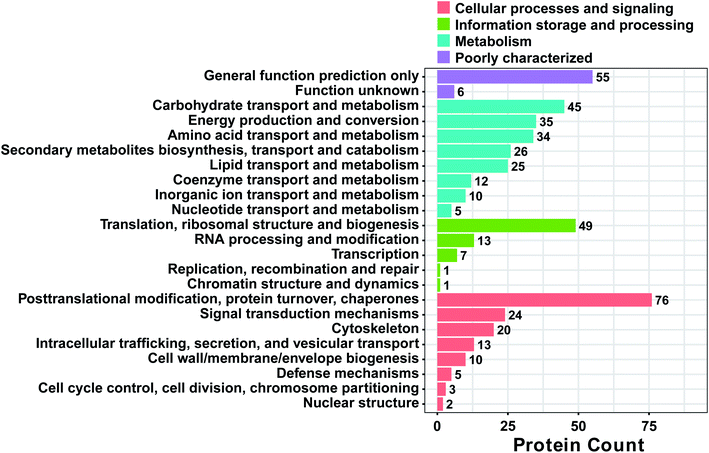 | ||
| Fig. 4 Functional classification of proteins between MT and WT flower buds of S. miltiorrhiza. All proteins aligned with the COG database were divided into 23 clusters. | ||
3.4 Gene ontology (GO) analysis of DAPs
To identify significantly enriched GO functional groups of DAPs, GO annotation was performed using Blast2GO.44 GO analysis for all identified proteins was carried out using three groups of protein functional annotation: cellular component, biological process, and molecular function and the results were provided (Fig. 5). The DAPs between MT and WT flower buds were classified into 42 functional groups, of which biological processes accounted for 19 GO terms (the most representative were “metabolic and cellular processes”), cellular components accounted for 15 GO terms (the most representative were “cell and cell parts”), and molecular functions accounted for 8 GO terms (the most representative were “catalytic activity and binding”).3.5 KEGG enrichment analysis of DAPs
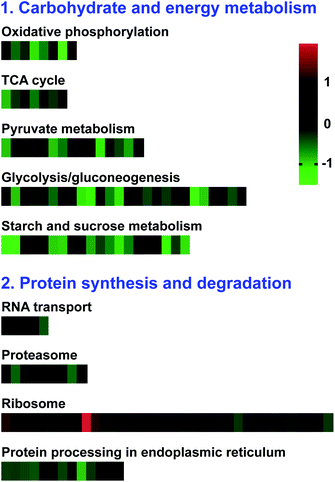
To investigate the metabolic pathways in which the DAPs were enriched, the pathway-based analysis was performed through the KEGG pathway database using the MAS molecular function annotation system.45 As a result, the involvement of these proteins in biological functions, 566 (88.6%) DAPs were mapped to 106 pathways in the KEGG database (ESI Excel S1†). “Metabolic pathways” was the most represented pathway (42.9%), followed by “biosynthesis of secondary metabolites” (24.7%) and “carbon metabolism” (11.5%). Among these subcategories, pyruvate metabolism (15 DAPs, 3.18%), TCA cycle (7 DAPs, 1.23%), glycolysis/gluconeogenesis (26 DAPs, 4.59%), starch and sucrose metabolism (20 DAPs, 3.53%), oxidative phosphorylation (8 DAPs, 1.41%), proteasome (9 DAPs, 1.59%), ribosome (37 DAPs, 6.71%), flavonoid biosynthesis (11 DAPs, 1.95%), and other glycan degradation (14 DAPs, 2.47%) were the most significantly enriched pathways (p-value < 0.05). The DAPs involved in the significantly enriched pathways may affect pollen development in S. miltiorrhiza (ESI Table S2†).In Fig. 6, the KEGG enrichment results showed that most of these DAPs were involved in carbohydrate and energy metabolic pathways, such as oxidative phosphorylation, TCA cycle, pyruvate metabolism, glycolysis/gluconeogenesis, and starch and sucrose metabolism, exhibited decreased accumulation in MT, indicating the potential roles of carbohydrate metabolism and energy supply in the regulation of male sterility S. miltiorrhiza. Besides, most DAPs involved in protein synthesis and degradation (RNA transport, proteasome, and protein processing in the endoplasmic reticulum) showed decreased accumulation in MT. Therefore, the future study on these DAPs will lay the foundation for investigating the molecular mechanism of male sterility in S. miltiorrhiza.
3.6 Possible protein interaction network between MT and WT of S. miltiorrhiza
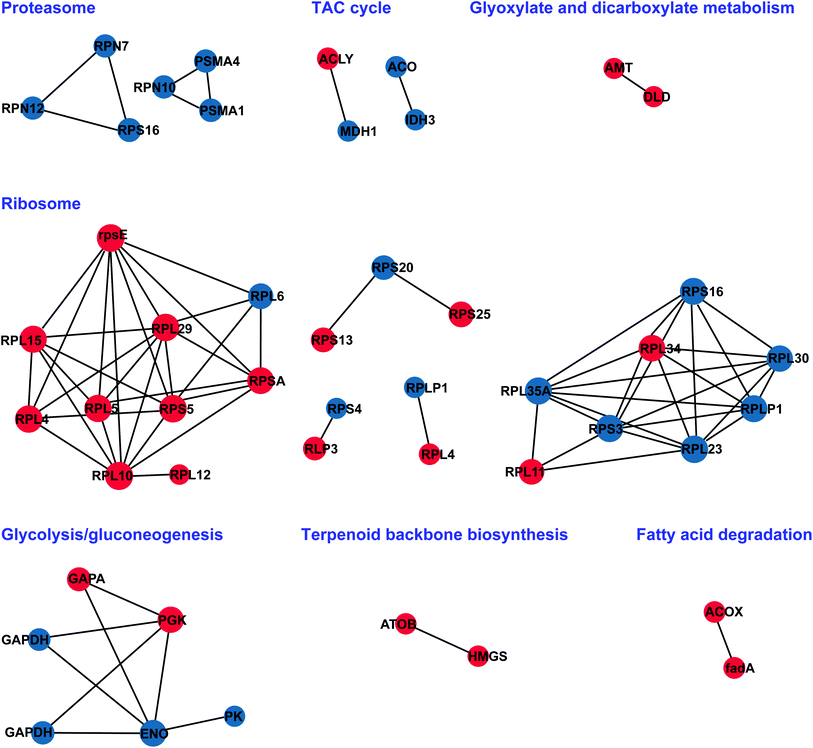
To better understand how floral bud developmental proteins are interrelated, we constructed a PPI (protein–protein interaction) network for all of the DAPs using STRING software.46 DAPs were grouped into functional classes according to the biological processes in which they are involved. STRING and BiNGO, which offer an upgrade of the functional analysis, were used to visualize the PPI, cellular component, and biological pathways. The STRING analysis revealed a protein association network in Fig. 7, in which proteins associated with the proteasome, TCA cycle, glyoxylate and dicarboxylate metabolism, glycolysis/gluconeogenesis, ribosome, terpenoid backbone biosynthesis, and fatty acid degradation were highly clustered. The network clusters obtained can provide a broader insight into the different roles of the identified proteins. These proteins are included in a wide range of biological pathways that are involved, either directly or indirectly, in male sterility of S. miltiorrhiza.3.7 Validation of genes encoding DAPs by RT-qPCR analysis
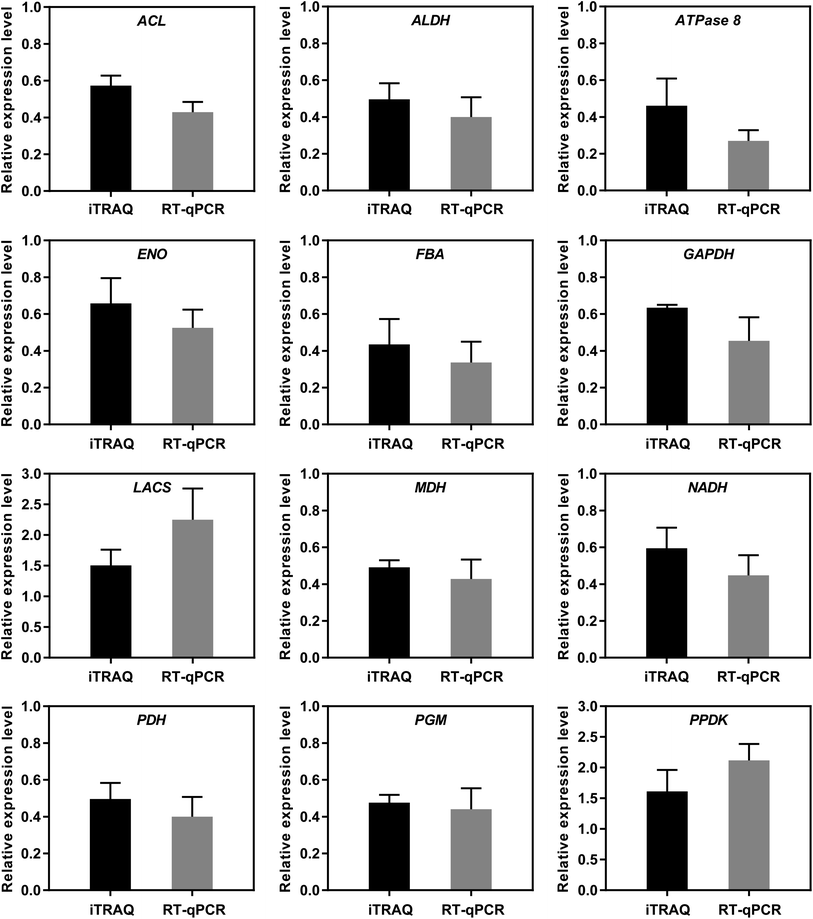
To further verify the reliability of the iTRAQ results, 12 DAPs potentially related to starch and sucrose metabolism were selected for RT-qPCR analysis (Fig. 8). The expression patterns determined by RT-qPCR were consistent with those obtained by iTRAQ for 12 DAPs, with 100% agreement between the RT-qPCR and iTRAQ results. The results indicated that the iTRAQ results in the present study was reliable.4. Discussion
The development of flower organs is a highly coordinated and irreversible phenomenon that involves a series of physiological, biochemical, and organoleptic changes. In the present study, proteome profiling was employed to investigate the differences between MT and WT by iTRAQ technologies, where there were 639 DAPs showing variations in abundance during pollen development. Based on KEGG enrichment analysis reveals that the carbohydrate and energy metabolism (pyruvate metabolism, glycolysis/gluconeogenesis, TCA cycle, oxidative phosphorylation and starch and sucrose metabolism), and the protein synthesis and degradation (proteasome, ribosome, RNA transport, protein processing in endoplasmic reticulum) are significantly enriched, which have been widely reported to involve in male sterility in plants.4.1 DAPs involved in carbohydrate and energy metabolism
As well known, the stamen and pollen development is a high-energy-requiring process. Carbohydrate and energy metabolism is one of the most basic metabolic pathways that provide energy and carbon sources for sustaining anther and pollen development in plants.47 As previously reported, the glycolysis/gluconeogenesis pathway is used as a respiratory substrate through the conversion of glucose to pyruvate.48 Moreover, the previous study has demonstrated that defects in the TCA cycle can lead to male sterility.49 In this study, the results found that the KEGG enrichment of DAPs was mainly classified into the categories of carbohydrate and energy metabolism shown in Fig. 6 and ESI Excel S1.† Our results showed that most of these proteins involved in carbohydrate and energy metabolism pathways (oxidative phosphorylation, TCA cycle, pyruvate metabolism, glycolysis/gluconeogenesis, and starch and sucrose metabolism) were significantly downregulated in MT compared with WT. The iTRAQ labeled proteomics approach identified many proteins that might be associated with male sterility in MT flower buds (ESI Table S2†). The proteins including malate dehydrogenase (MDH, SMil_00017025, 0.57-fold change), pyruvate kinase (PYR, SMil_00021286, 0.73-fold change) and phosphoglucomutase (PGM, SMil_00014010, 0.48-fold change) were downregulated in MT flower buds, which participate in the glycolysis or the citric acid cycles. PGM interconverts glucose-6-phosphate and glucose-1-phosphate and is a key enzyme in metabolism. It was reported that the loss of PGM compromised gametophyte development in arabidopsis.50 In a sterile line of cotton, PYR transcription was also found to be downregulated at the uninucleate microspore stage.51 Glyceraldehyde-3-phosphate dehydrogenase (GAPDH), an ancient and ubiquitously distributed enzyme of sugar–phosphate metabolism, significantly enriches in glycolysis/gluconeogenesis metabolic pathway, catalyzing the reversible interconversion of glyceraldehyde-3-phosphate and 3-phosphoglycerate and playing an important role in glycolysis/gluconeogenesis. As shown in Fig. 7, we found that GAPDH (SMil_00022823, 0.63-fold change) was significantly downregulated in MT flower buds. As previously reported, mitochondria fulfill a wide range of metabolisms and contain a large number of energy metabolism proteins involved in respiratory pathways (TCA cycle) and mitochondrial electron transport. The important role of TCA cycle activity has been confirmed by published work, which demonstrated that reduced levels of pyruvate dehydrogenase led to the failure of anther development in tobacco plants.52 In our iTRAQ data, the expression level of pyruvate dehydrogenase (SMil_00007194, 0.49-fold change, ESI Table S2†) related to pyruvate metabolism was significantly reduced, which was consistent with the previous reports. It is speculated that changes in the abundance of these proteins can cause abnormal carbohydrate and energy metabolism pathways and insufficient supply of critical substrates, which in turn reduces the efficiency of the energy supply during pollen development. Therefore, the disruption of carbohydrate and energy supply may be a key factor that affects the normal development of the tapetum in MT, leading to pollen sterility in S. miltiorrhiza.4.2 DAPs involved in protein synthesis and degradation
Proteins play essential roles in the development of cells, organs, or tissues through the interaction with other molecules or modifications, so protein synthesis and proteolysis are vital for the growth and development of the plant.53 Ribosomal proteins are a major component of the ribosome, which plays an important role in protein biosynthesis in cells.54 The changed abundance of these proteins may have disturbed the balance of proteins synthesis and proteolysis, which affect pollen development. Proteasomes are important proteases in eukaryotes and regulate many cellular processes, including metabolism, cell cycle, and proteolysis of regulatory proteins, and the activities of the optimal proteasome levels are required for plant development including anther development and male fertility. Moreover, the study showed that the 26S proteasome subunit may play a role in tapetum degeneration, and the delay or premature degeneration of the tapetum might lead to male sterility.55 In arabidopsis, floral buds of RPN5 (26S proteasome regulatory subunit RPN5) mutant fail to produce functional pollen grains, implying a defect in male gametogenesis.56 The results are similar to those of MT flower buds in our analysis. Six RPNs were significantly downregulated in our iTRAQ data (ESI Table S2†). The iTRAQ results in Fig. 6, all the DAPs involved in proteasome were found to be downregulated in MT flower buds. The downregulated expression of 26S proteasome in MT compared with WT might have disturbed the degradation of regulatory proteins in flower tissues, leading to programmed cell death (PCD) of the tapetum and male sterility. These results suggest that defects in proteasome activities may be related to abnormal anther and pollen development in MT flower buds. Also, the results showed that DAPs were assigned to four important pathways, including protein processing in the endoplasmic reticulum, ribosome, proteasome, and RNA transport (ESI Table S2†). These DAPs may disrupt the coordination of protein synthesis and degradation of metabolic processes during flower bud development, ultimately leading to abnormal development and pollen sterility in MT S. miltiorrhiza.5. Conclusions
The present work provided a comprehensive protein expression profile of MT and WT S. miltiorrhiza using an iTRAQ-based quantitative proteomics approach. A total of 639 differentially abundant proteins between MT and WT S. miltiorrhiza were identified in flower buds. The DAPs were mainly involved in (1) carbohydrate and energy metabolism (pyruvate metabolism, oxidative phosphorylation, glycolysis/gluconeogenesis, TCA cycle and starch and sucrose metabolism), and (2) protein synthesis and degradation (proteasome, ribosome, RNA transport, protein processing in endoplasmic reticulum). The DAPs in enriched processes could serve as biomarkers for further study of their roles in the male sterility of S. miltiorrhiza. Overall, this study enriched the understanding of the mechanisms regulated male sterility in S. miltiorrhiza and would facilitate the usage of male sterile lines in the hybrid breeding of S. miltiorrhiza. Further research will be required to reveal the regulatory mechanism of male sterility in Salvia miltiorrhiza. The results provide new information for the development and promotion of heterosis in hybrid S. miltiorrhiza.Table S2† The DAPs that may be involved in male sterility between MT and WT flower buds in S. miltiorrhiza.
Conflicts of interest
We declare that all authors agree with the content of the submitted manuscript and that there are no conflicts of interest.Acknowledgements
This study was financially supported by National Natural Science Foundation of Shaanxi (Grant No. 2016JM8108). We greatly appreciate Professor Min Duan and Dr Ningjuan Fan from the Biochemistry and Molecular Platform in College of Life Sciences, Northwest A&F University for help with providing experimental instruments and instructions.References
- G. A. Roth, C. Johnson, A. Abajobir, F. Abd-Allah, S. F. Abera and G. Abyu, et al., J. Am. Coll. Cardiol., 2017, 70, 1–25 CrossRef PubMed.
- N. Townsend, L. Wilson, P. Bhatnagar, K. Wickramasinghe, M. Rayner and M. Nichols, Eur. Heart J., 2016, 37, 3232–3245 CrossRef PubMed.
- S. Kohno, A. L. Keenan, J. M. Ntambi and M. Miyazaki, Biochem. Biophys. Res. Commun., 2018, 504, 590–595 CrossRef CAS PubMed.
- H. Xu, J. Song, H. Luo, Y. Zhang, Q. Li and Y. Zhu, et al., Mol. Plant, 2016, 9, 949–952 CrossRef CAS PubMed.
- T. Pei, P. Ma, K. Ding, S. Liu, Y. Jia, M. Ru, J. Dong and Z. Liang, J. Exp. Bot., 2018, 69, 1663–1678 CrossRef CAS PubMed.
- G. Zhang, Y. Tian, J. Zhang, L. Shu, S. Yang, W. Wang, J. Sheng, Y. Dong and W. Chen, Gigascience, 2015, 4, 62 CrossRef PubMed.
- A. Matkowski, S. Zielinska, J. Oszmianski and E. Lamer-Zarawska, Bioresour. Technol., 2008, 99, 7892–7896 CrossRef CAS PubMed.
- Y. Zhang, L. Guo, Z. Shu, Y. Sun, Y. Chen, Z. Liang and H. Guo, Int. J. Mol. Sci., 2013, 14, 6518–6528 CrossRef CAS PubMed.
- N. De Storme and D. Geelen, Plant, Cell Environ., 2014, 37, 1–18 CrossRef CAS PubMed.
- Y. Wu, T. W. Fox, M. R. Trimnell, L. Wang, R. J. Xu and A. M. Cigan, et al., Plant Biotechnol. J., 2016, 14, 1046–1054 CrossRef CAS PubMed.
- C. Xu, Z. Liu, L. Zhang, C. Zhao, S. Yuan and F. Zhang, Protoplasma, 2013, 250, 415–422 CrossRef PubMed.
- S. P. Singh, R. Srivastava and J. Kumar, Acta Physiol. Plant., 2014, 37 DOI:10.1007/s11738-014-1713-7.
- S. Mishra and V. Kumari, Int. J. Curr. Microbiol. Appl. Sci., 2018, 7, 3016–3034 CrossRef.
- H. Zhang, C. Xu, Y. He, J. Zong, X. Yang and H. Si, et al., Proc. Natl. Acad. Sci. U. S. A., 2013, 110, 76–81 CrossRef CAS PubMed.
- Z. Li, Y. Cheng, J. Cui, P. Zhang, H. Zhao and S. Hu, BMC Genomics, 2015, 16, 206 CrossRef PubMed.
- Z. Shu, Z. Wang, X. Mu, Z. Liang and H. Guo, PLoS One, 2012, 7, e50903 CrossRef CAS PubMed.
- R. Wang, H. Jiang, Z. Zhou, H. Guo and J. Dong, BMC Genomics, 2019, 20, 780 CrossRef PubMed.
- Z. B. Lippman and D. Zamir, Trends Genet., 2007, 23, 60–66 CrossRef CAS PubMed.
- Z. Shu, Z. Liang, Q. Sun, X. Zhang and L. Fu, Acta Botany Boreal., 2006, 26, 2202–2207 Search PubMed.
- A. Mishra and A. Bohra, Plant Cell Rep., 2018, 37, 177–191 CrossRef CAS PubMed.
- J. A. Shykoff, S. O. Kolokotronis, C. L. Collin and M. Lopez-Villavicencio, Oecologia, 2003, 135, 1–9 CrossRef PubMed.
- X. Geng, J. Ye, X. Yang, S. Li, L. Zhang and X. Song, Int. J. Mol. Sci., 2018, 19 DOI:10.3390/ijms19020324.
- M. Goetz, D. E. Godt, A. Guivarc'h, U. Kahmann, D. Chriqui and T. Roitsch, Proc. Natl. Acad. Sci. U. S. A., 2001, 98, 6522–6527 CrossRef CAS PubMed.
- I. V. N. Haddad, L. D. Ribeiro de Santiago-Fernandes and S. R. Machado, Aust. J. Bot., 2018, 66, 108 CrossRef.
- K. B. Saxena, A. Hingane, Plant Biology and Biotechnology, 2015, pp. 639–656 Search PubMed.
- J. Shan, Z. Cai, Y. Zhang, H. Xu, J. Rao, Y. Fan and J. Yang, Genomics, 2018, 1447–1455 Search PubMed.
- X. Wan, S. Wu, Z. Li, Z. Dong, X. An, B. Ma, Y. Tian and J. Li, Mol. Plant, 2019 DOI:10.1016/j.molp.2019.01.014.
- H. Tang, Y. Xie, Y. G. Liu and L. Chen, Plant Reprod., 2017, 30, 179–184 CrossRef CAS PubMed.
- L. Sun, G. Sun, C. Shi and D. Sun, BMC Genomics, 2018, 19, 333 CrossRef PubMed.
- Y. Wang, J. Bai, P. Wang, W. Duan, S. Yuan and F. Zhang, et al., Plant Growth Regul., 2018, 86, 133–147 CrossRef CAS.
- Z. Wang, X. Wu, Z. Wu, H. An, B. Yi and J. Wen, et al., Int. J. Mol. Sci., 2018, 19 DOI:10.3390/ijms19092689.
- W. Zhang, Y. Xie, L. Xu, Y. Wang, X. Zhu, R. Wang, Y. Zhang, E. M. Muleke and L. Liu, Front. Plant Sci., 2016, 7, 1054 Search PubMed.
- J. Liu, C. Pang, H. Wei, M. Song, Y. Meng, J. Ma, S. Fan and S. Yu, J. Proteomics, 2015, 126, 68–81 CrossRef CAS PubMed.
- X. Fang, H. F. Fu, Z. H. Gong and W. G. Chai, Sci. Rep., 2016, 6, 23357 CrossRef CAS PubMed.
- P. P. Das, G. M. Chua, Q. Lin and S. M. Wong, J. Proteomics, 2019, 196, 42–56 CrossRef CAS PubMed.
- D. Gayen, P. Barua, N. V. Lande, S. Varshney, S. Sengupta, S. Chakraborty and N. Chakraborty, Environ. Exp. Bot., 2019, 160, 12–24 CrossRef CAS.
- A. K. Malkawi, A. Masood, Z. Shinwari, M. Jacob, H. Benabdelkamel and G. Matic, et al., Int. J. Mol. Sci., 2019, 20, 3122 CrossRef CAS PubMed.
- S. P. Gygi, G. L. Corthals, Y. Zhang, Y. Rochon and R. Aebersold, Proc. Natl. Acad. Sci. U. S. A., 2000, 97, 9390–9395 CrossRef CAS PubMed.
- J. Li, X. Ding, S. Han, T. He, H. Zhang, L. Yang, S. Yang and J. Gai, J. Proteomics, 2016, 138, 72–82 CrossRef CAS PubMed.
- J. Liu, C. Pang, H. Wei, M. Song, Y. Meng, S. Fan and S. Yu, BMC Plant Biol., 2014, 14, 390 CrossRef PubMed.
- I. S. Sheoran, A. R. S. Ross, D. J. H. Olson and V. K. Sawhney, Plant Sci., 2009, 176, 99–104 CrossRef CAS.
- P. Pichler, T. Kocher, J. Holzmann, M. Mazanek, T. Taus, G. Ammerer and K. Mechtler, Anal. Chem., 2010, 82, 6549–6558 CrossRef CAS PubMed.
- A. Conesa, S. Gotz, J. M. Garcia-Gomez, J. Terol, M. Talon and M. Robles, Bioinformatics, 2005, 21, 3674–3676 CrossRef CAS PubMed.
- M. Y. Galperin, K. S. Makarova, Y. I. Wolf and E. V. Koonin, Nucleic Acids Res., 2015, 43, D261–D269 CrossRef CAS PubMed.
- M. Kanehisa, M. Araki, S. Goto, M. Hattori, M. Hirakawa and M. Itoh, et al., Nucleic Acids Res., 2008, 36, D480–D484 CrossRef CAS PubMed.
- D. Szklarczyk, A. Franceschini, S. Wyder, K. Forslund, D. Heller and J. Huerta-Cepas, et al., Nucleic Acids Res., 2015, 43, D447–D452 CrossRef CAS PubMed.
- Z. Wu, J. Cheng, C. Qin, Z. Hu, C. Yin and K. Hu, Int. J. Mol. Sci., 2013, 14, 22982–22996 CrossRef PubMed.
- P. Giege, J. L. Heazlewood, U. Roessner-Tunali, A. H. Millar, A. R. Fernie, C. J. Leaver and L. J. Sweetlove, Plant Cell, 2003, 15, 2140–2151 CrossRef CAS PubMed.
- Q. Sun, C. Hu, J. Hu, S. Li and Y. Zhu, Protein J., 2009, 28, 341–348 CrossRef CAS PubMed.
- B. Egli, K. Kolling, C. Kohler, S. C. Zeeman and S. Streb, Plant Physiol., 2010, 154, 1659–1671 CrossRef CAS PubMed.
- M. Wei, M. Song, S. Fan and S. Yu, BMC Genomics, 2013, 14, 97 CrossRef CAS PubMed.
- R. Yui, S. Iketani, T. Mikami and T. Kubo, Plant J., 2003, 34, 57–66 CrossRef CAS PubMed.
- B. B. Zheng, Y. N. Fang, Z. Y. Pan, L. Sun, X. X. Deng, J. W. Grosser and W. W. Guo, J. Proteome Res., 2014, 13, 2998–3015 CrossRef CAS PubMed.
- L. Jiang, T. Li, X. Zhang, B. Zhang, C. Yu and Y. Li, et al., Curr. Biol., 2017, 27, 1498–1505.e6 CrossRef CAS PubMed.
- I. S. Sheoran, A. R. Ross, D. J. Olson and V. K. Sawhney, J Proteomics, 2009, 71, 624–636 CrossRef CAS PubMed.
- A. J. Book, J. Smalle, K. H. Lee, P. Yang, J. M. Walker and S. Casper, et al., Plant Cell, 2009, 21, 460–478 CrossRef CAS PubMed.
Footnotes |
| † Electronic supplementary information (ESI) available: Fig. S1: External morphological characters in flower buds between male sterile and WT lines of S. miltiorrhiza. (A) The phenotype of sterile flower buds; (B) phenotype of WT flower buds and (C) morphological difference in flower buds between MT and WT; Table S1: Primer sequences of DAPs between MT and WT S. miltiorrhiza; Excel S1: The KEGG enrichment of differential abundant proteins between MT and WT flower buds in S. miltiorrhiza. See DOI: 10.1039/c9ra09240d |
| ‡ These two authors contributed equally to this work. |
| This journal is © The Royal Society of Chemistry 2020 |

