
 Open Access Article
 This Open Access Article is licensed under a Creative Commons Attribution-Non Commercial 3.0 Unported Licence
Simple, fast and environmentally friendly method to determine ciprofloxacin in wastewater samples based on an impedimetric immunosensor†
Rafaela Silva Lamarca *ab,
Ricardo Adriano Dorledo de Fariaac,
Maria Valnice Boldrin Zanonib,
Marcelo Nalind,
Paulo Clairmont Feitosa de Lima Gomesb and
Younès Messaddeqad
*ab,
Ricardo Adriano Dorledo de Fariaac,
Maria Valnice Boldrin Zanonib,
Marcelo Nalind,
Paulo Clairmont Feitosa de Lima Gomesb and
Younès Messaddeqad
aCenter for Optics, Photonics and Laser (COPL), Université Laval, Quebec, QC G1V0A6, Canada. E-mail: rafalamarca_uba@yahoo.com.br
bUNESP, National Institute for Alternative Technologies of Detection, Toxicological Evaluation and Removal of Micropollutants and Radioactives (INCT-DATREM), Institute of Chemistry, São Paulo State University – UNESP, P.O. Box 355, Araraquara, SP 14800-900, Brazil
cDepartment of Chemical Engineering, Universidade Federal de Minas Gerais (UFMG), Belo Horizonte, MG 31270-901, Brazil
dInstitute of Chemistry, São Paulo State University (UNESP), P.O. Box 355, Araraquara, SP 14800-060, Brazil
First published on 8th January 2020
Abstract
In this study an impedimetric immunosensor was developed in order to determine ciprofloxacin (CIP) in wastewater samples, an emergent contaminant widely found in wastewater. To achieve this, an anti-ciprofloxacin antibody was immobilized on the surface of a printed carbon electrode. Then, the developed immunosensor was applied in wastewater samples from Université Laval residences (Québec, Canada) through the load transfer resistance (Rct) using [Fe(CN)6]3−/4− as a redox probe, and the average CIP concentration was found to be 2.90 × 10⁻⁴ μg mL−1. The observed Rct changes presented a linear relationship from CIP concentrations of 10−5 to 1.0 μg mL−1, with detection and quantification limits of 2.50 × 10⁻⁶ and 7.90 × 10⁻⁶ μg mL−1, respectively. The immunosensor presented high selectivity and repeatability, as well as a good recovery rate in wastewater samples (97%). Significant interference with other compounds was not observed. The proposed method requires only 30 μL of sample without the use of organic solvents or preceding sample preparation and/or extraction techniques. Moreover, the method is fast: only 20 min of incubation followed by 2 min of analysis time was sufficient to obtain the CIP concentration. The method's estimated cost is U$ 2.00 per sample.
1. Introduction
In recent years, there has been growing concern about the effects of exposure to so-called emerging contaminants (EC). These ECs are compounds widely found in surface and groundwater, which may present some risk to the ecosystem and to humans, but are not yet routinely monitored in the environment. The main characteristics are the risk associated with exposure even at low concentrations and persistence in the environment without any established legislation for their control.1 Among them, the most prominent are pharmaceutical compounds, particularly antibiotics. Antibiotics are extensively used in human and animal therapy, followed by their excretion, which is an important source of the pollutants in surface water, groundwater and soil. The main consequence reported is the appearance of multi-resistant bacteria.2–5 This microbial resistance could be caused by the overuse of antibiotics in veterinary therapy or by the presence in the environment. Thus, antibiotics in the environment are considered as a major threat to human health and aquatic flora and fauna, even at the extremely low concentrations found in the environment, such as micrograms and nanograms per liter.6–8Currently, there is great concern about multi-resistant bacteria occurring in wastewater treatment plants (WWTPs), since these units were not designed to remove ECs and provide an environment that is favorable for microorganism multiplication.1,2,6,9–12 It is known from the literature2,13–17 that pharmaceutical compounds may be partially degraded (producing more toxic sub-products) or may remain unchanged during conventional treatment in WWTPs and then be released into water bodies. Within this perspective, ciprofloxacin (CIP) has received great attention owing to its multi-resistant bacteria effect.
Ciprofloxacin is an antibiotic from the fluoroquinolone family, widely used for the treatment of various diseases caused by gram (+) and gram (−) microorganisms, being prescribed for infections of soft, respiratory and bacterial tissues, sexually transmitted diseases and sinusitis.18,19 It is excreted mainly through feces and urine, with up to 72% excreted in the unmetabolized form.20,21 About 20% is eliminated through urine and feces in five metabolites, namely N-formyl-ciprofloxacin (<0.1%), diethylene-N-formyl-ciprofloxacin (1%), oxo-ciprofloxacin (7%), sulfo-ciprofloxacin (10%) and ethylene-ciprofloxacin (2%).22 Thus, both metabolites and unmetabolized CIP can be disposed of in the public sewage and reach WWTPs. Thereafter, it is fundamental to monitor CIP in wastewater samples using a fast, selective and easy handling method producing minimal chemical waste.
Nowadays, the most commonly used technique for the determination of pharmaceutical compounds in wastewater is chromatography, especially liquid chromatography coupled to mass spectrometry. However, the technique is expensive, uses large amounts of solvents (e.g., methanol and acetonitrile) and requires laborious pre-cleaning steps. Lindberg et al. measured ciprofloxacin in hospital sewage in Kalmar County Hospital (Sweden) using LC-MS and found CIP at concentrations of 3.6 to 101 μg L−1.23 Feitosa-Felizzola and Chiron detected a maximum ciprofloxacin concentration of 9.7 μg L−1 in the Arc River (France) using LC-MS/MS.24 Wang et al. analyzed antibiotics in swine sludge in China by UPLC-HRMS and found CIP at concentrations from 2.00 to 1118.89 μg kg−1.25 Mirzaei et al. analyzed antibiotics in urban effluents in rivers in Tehran, Iran by HPLC-MS/MS and found CIP in the range of 0.2487 to 0.2950 μg L−1.26
In this context, a biosensor could be an alternative method for CIP determination in wastewater samples offering fast, selective, sensitive, and low-cost detection that follows green chemistry principles. Biosensors convert a biological response from antibodies, antigens, nucleic acids or enzymes immobilized on the substrate into an electrical signal.27 Biosensors that achieve the biological recognition using antibodies are called immunosensors and present high binding specificity for their respective antigens.28
Among the various transduction techniques currently available, electrochemical impedance spectroscopy (EIS) has been widely applied in biosensor development in order to evaluate the interfacial properties of the modified electrodes.29–31 The physical, chemical and electric responses that arise from the modification of the antibodies' bonds by the target molecules are monitored by using redox probes and analysis of charge transfer resistance (Rct) on the electrode surface, as reported by several researchers, such as Aydin et al.,32 Ruecha et al.,33 Aydin et al.,34 and Fusco et al.35 The combination of an antigen with an antibody provides an analytical response with high sensitivity and selectivity, in addition to operational simplicity, low cost and a non-destructive electrochemical method, which are important characteristics for an analytical device.36,37
Thus, the present study describes the development of an immunosensor for CIP determination in wastewater samples using immunoglobulin G (IgG) immobilized on the surface of a carbon printed electrode and monitored by electronic impedance spectroscopy. To the best of our knowledge, there are no studies in the literature related to the development of an immunosensor for ciprofloxacin determination in wastewater samples.
2. Materials and methods
2.1 Reagents
Potassium hexacyanoferrate(III) (K3[Fe(CN)6]), ethanolamine (≥98%), N-hydroxysuccinimide (98%) (NHS), potassium hexacyanoferrate(II), phosphate-buffered saline (PBS), sulfuric acid (90–100%), 1-ethyl-3-(3-dimethylaminopropyl)carbodiimide (≥98%) (EDC) and ciprofloxacin (≥98%) were purchased from Sigma-Aldrich. Potassium chloride was obtained from Fisher Scientific. The anti-ciprofloxacin monoclonal antibody (IgG) (1 mg mL−1) was purchased from Creative Diagnostics.All solutions were prepared using a Milli-Q water system at 18.2 MΩ cm−1 and 298 K.
A stock solution of ciprofloxacin (1 mg mL−1) was prepared in methanol with 50 μL of acetic acid added. Subsequent dilutions were performed in 0.01 mol L−1 phosphate-buffered saline (pH 7.4). The antibody was diluted in PBS at a concentration of 100 μg mL−1.
2.2 Instrumentation
The electrochemical measurements were performed on a Princeton Applied Research VersaSTAT 3 potentiostat with VersaStudio software. EIS measurements were carried out in the frequency range from 10![[thin space (1/6-em)]](https://www.rsc.org/images/entities/char_2009.gif) 000 to 0.1 Hz under a 10 mV amplitude potential and using 600 s of previous stabilization at the equilibrium potential. Cyclic voltammetry (CV) was carried out with the screen-printed carbon electrodes (SPCE) before and after modification by cycling the potential from −0.7 to 0.8 V vs. Ag/AgCl at a scan rate of 50 mV s−1. The electrode performance was tested by using 0.01 mol L−1 PBS, 0.1 mol L−1 KCl as the supporting electrolyte and 0.005 mol L−1 potassium ferricyanide/ferrocyanide as the redox probe.
000 to 0.1 Hz under a 10 mV amplitude potential and using 600 s of previous stabilization at the equilibrium potential. Cyclic voltammetry (CV) was carried out with the screen-printed carbon electrodes (SPCE) before and after modification by cycling the potential from −0.7 to 0.8 V vs. Ag/AgCl at a scan rate of 50 mV s−1. The electrode performance was tested by using 0.01 mol L−1 PBS, 0.1 mol L−1 KCl as the supporting electrolyte and 0.005 mol L−1 potassium ferricyanide/ferrocyanide as the redox probe.
2.3 SPCE functionalization for ciprofloxacin recognition
The SPCE were purchased from Pine Research Instrumentation and consist of an Ag/AgCl reference electrode, a carbon working electrode (model RRPE1002C, 5 × 4 mm), and a carbon counter electrode on a polymeric substrate.Initially, the SPCE were electro-oxidized by chronoamperometry at +1.5 V vs. Ag/AgCl for 60 seconds in 0.05 mol L−1 H2SO4 solution to generate carboxylic groups on the surface. The electrodes were washed with Milli-Q water, dried under a N2 stream and immediately incubated in 1-ethyl-3-(3-dimethylaminopropyl)carbodiimide/N-hydroxysuccinimide (EDC/NHS) solution (at 5.0 and 8.0 mM, respectively) for 1 hour at room temperature, as described by Rocha et al.38 The EDC/NHS solution was prepared on the day of the experiment and used regularly over one week, then afterwards, it was re-prepared.
Afterwards, the electrodes were washed in water, dried in N2 and immersed in 100 μg mL−1 anti-ciprofloxacin antibody solution diluted in PBS for 1 hour. Finally, the electrodes were washed with PBS buffer, dried, and immersed in 0.1 mol L−1 ethanolamine solution for 1 hour to block the remaining sites in order to avoid nonspecific binding. Finally, the electrodes were washed in PBS to remove the excess ethanolamine. A volume of 30 μL was used in each of the described steps. Scheme 1 shows a schematic illustration of the process described above.
 | ||
| Scheme 1 Scheme of SPCE surface modification for ciprofloxacin determination. | ||
2.4 Morphology of the chemical immunosensor
The SPCE infrared spectrum was recorded after each functionalization step in the wavenumber range from 4000 to 400 cm−1 using attenuated total reflectance Fourier transform spectroscopy (ATR-FTIR) with a Frontier Infrared Spectrometer equipped with PerkinElmer Spectrum software version 10.03.05.Atomic force microscopy (AFM) images were obtained for the SPCE surface before and after modification by the anti-ciprofloxacin IgG. The measurements were performed using a Veeco Nanoscope V and the topographic images were collected in tapping mode with a 300 kHz tip.
2.5 Impedance measurements
EIS measurements were carried out in order to assess the ciprofloxacin response on the impedance sensor. The technique was performed over the frequency range from 10000 to 0.1 Hz at an AC potentiostatic pertubation with amplitude of 10 mV around the open circuit potential (OCP). All the measurements were performed after monitoring the OCP for 300 s in a solution containing 0.01 mol L−1 PBS (pH 7.4), 0.1 mol L−1 KCl as the supporting electrolyte and 0.005 mol L−1 K3[Fe(CN)6]/K4[Fe(CN)6] as the redox probe. The recorded EIS data were modelled to an electrical equivalent circuit using Zview 2.9b software.
The EIS measurements were made before and after exposing the sensor to 30 μL of lab-made sewage spiked with ciprofloxacin at concentrations varying from 10−7 to 1.0 μg mL−1.
The immunosensor selectivity was evaluated by spiking with 30 μL of carbamazepine (CBZ), norfloxacin (NOR) and venlafaxine (VLF) solutions individually and testing under the same conditions previously described.
2.6 Analytical parameters
The linearity was evaluated by spiking CIP in lab-made sewage at six calibration points (10−5 to 1.0 μg mL−1) and using least-squares linear regression. The Rct values in the EIS measurements after successive analyte additions were also evaluated. This sewage was prepared as described in the paper published by Martins et al.,39 the composition of which is detailed in Table 1.| Component | Concentration (mg L−1) |
|---|---|
| Cellulose | 47.0 |
| Sucrose | 98.0 |
| Starch | 149 |
| Beef extract | 262 |
| Sodium bicarbonate | 370 |
| NaCl | 250 |
| MgCl2 | 4.50 |
| CaCl2 | 7.00 |
| LAS (tensoactive) | 1.00 |
| Soybean oil | 79.0 |
The lab-made sewage was initially filtered on quantitative filter paper (Unifil, diameter 110 mm, thickness 0.20 mm), followed by 1:5 dilution in phosphate buffer (pH 7.4), then ciprofloxacin was spiked in the different concentrations levels in order to obtain the calibration curve.
The inter-day precision was also evaluated by comparing the calibration curves in the range of 10−5 to 1.0 μg mL−1 in triplicate (n = 3), prepared on alternate days and expressed as percentage relative standard deviation (RSD%). The limits of detection (LOD) and quantification (LOQ) were calculated using LOD = 3 × σ/m and LOQ = 10 × σ/m, with σ being the standard deviation of ten blank measurements and m the calibration curve slope.40
2.7 Analysis of sewage samples
Wastewater samples were collected in Québec City, QC, Canada from the Université Laval sewage treatment plant (46°46′43.7′′N 71°16′29.4′′W) during summer 2019.About 300 mL of wastewater was collected in a dry and clean 500 mL polypropylene bottle. Further, the samples were stored in a refrigerator at 5 °C for 1 day until analysis.
In order to minimize the matrix effect, the samples were analyzed by standard addition method. Initially, the samples were filtered on quantitative filter paper (Unifil, diameter 110 mm, thickness 0.20 mm), then diluted 1:5 in PBS buffer to a total volume of 25.00 mL, followed by spiking with 0, 250, 500, 750 and 1000 μL of a 1 × 10⁻² μg mL−1 CIP solution in triplicate (n = 3). After an incubation time of 20 min, the samples were analyzed. The recovery was tested in wastewater samples, also in triplicate (n = 3), with CIP spiked at a concentration of 1 × 10⁻³ μg mL−1 in samples diluted 1:5 in PBS buffer.
3. Results and discussion
3.1 Electrochemical behavior
Since electrochemical impedance spectroscopy is a well-established technique for characterization of the processes occurring at the electrode–solution interface, and the obtained spectra are related to the changes at the electrode–solution interface, it was therefore used to characterize surface modifications.41 Fig. 1 illustrates the performance of the modified SPCE assessed by CV and EIS by exposing the electrode to a solution containing 0.1 mol L−1 KCl, 0.01 mol L−1 PBS (pH 7.4) and 0.005 mol L−1 Fe(CN6)]3−/4−. The cyclic voltammograms (Fig. 1A) present a well-defined oxidation peak at 0.3 V vs. Ag/AgCl and a cathodic peak at 0.0 V vs. Ag/AgCl in the reverse scan owing to the electrochemical behavior of the [Fe(CN6)]3−/4− redox pair (bare immunosensor, red line). After modifying the SPCE surface with EDC/NHS (SPCE/EDC/NHS, gray line), the peak current decreased because of the insulating feature of these molecules, which hinders the electron transfer from the substrate to the redox couple in the electrolyte interface. After the attachment of the anti-ciprofloxacin antibody (SPCE/EDC/NHS/IgG, green line) to the surface by bonding IgG primary amino groups the NHS,42 there is successive diminishing of the peak intensity, suggesting that the electrochemical activity is diminished due to the insulating effect of these proteins. Finally, when ethanolamine (SPCE/EDC/NHS/IgG, black line) was attached to the modified SPCE as a blocking agent a stable voltammetric signal was seen, indicating that ethanolamine was not capable of providing a considerable steric hindrance effect owing to its small chain length. Moreover, the presence of the negatively charged (–OH) on the modifier can cause electrostatic repulsion in relation to the [Fe(CN6)]3−/4− anions as the analyte. Thus, the increase in the peak-to-peak separation (300 mV) in relation to the expected 59 mV for a reversible system also confirms the insulating effect of the functionalization molecules on the electrode surface, which reduces the electron transfer rate.43 | ||
| Fig. 1 (A) Cyclic voltammograms recorded for bare SPCE (red line) and SPCE modified by EDC/NHS (gray line); EDC/NHS + antibody (green line) and EDC/NHS + antibody + ethanolamine (black line) in 0.1 mol L−1 of KCl/[Fe(CN6)]3−/4− 0.005 mol L−1 in 0.01 mol L−1 PBS pH 7.4 as the supporting electrolyte. Scan rate from −0.7 to +0.8 V at 50 mV s−1. (B) Nyquist plots in the frequency range from 10000 to 0.1 Hz with 10 mV amplitude. | ||
The choice of supporting electrolyte [Fe(CN6)]3−/4− in this paper was based on the widely recognized electrochemical response, which demonstrates that the developed sensor is in agreement with previous studies described in the literature.38,44–46
The EIS behavior shown in Fig. 1B demonstrates that the electrode modification was successful since there is an increase in the Nyquist plot capacitive arc diameter after each modification step. In the Nyquist plot, the semicircle portion from high to intermediate frequencies refers to the kinetic charge transfer process whereas the straight line at low frequencies arises from the diffusional barrier regarding the redox couple mass-transfer.47 Thus, the enhancement of the semicircle diameter in the Nyquist plot could be attributed to the steric and resistive behavior of the molecules attached on the electrode surface, corroborating the performance observed previously in the cyclic voltammograms.
3.2 Morphology of the SPCE/EDC/NHS/IgG
Fig. 2 illustrates the characteristics of SPCE/EDC/NHS/IgG (in PBS at 100 μg mL−1) surface as obtained by infrared spectroscopy (FTIR) and AFM images.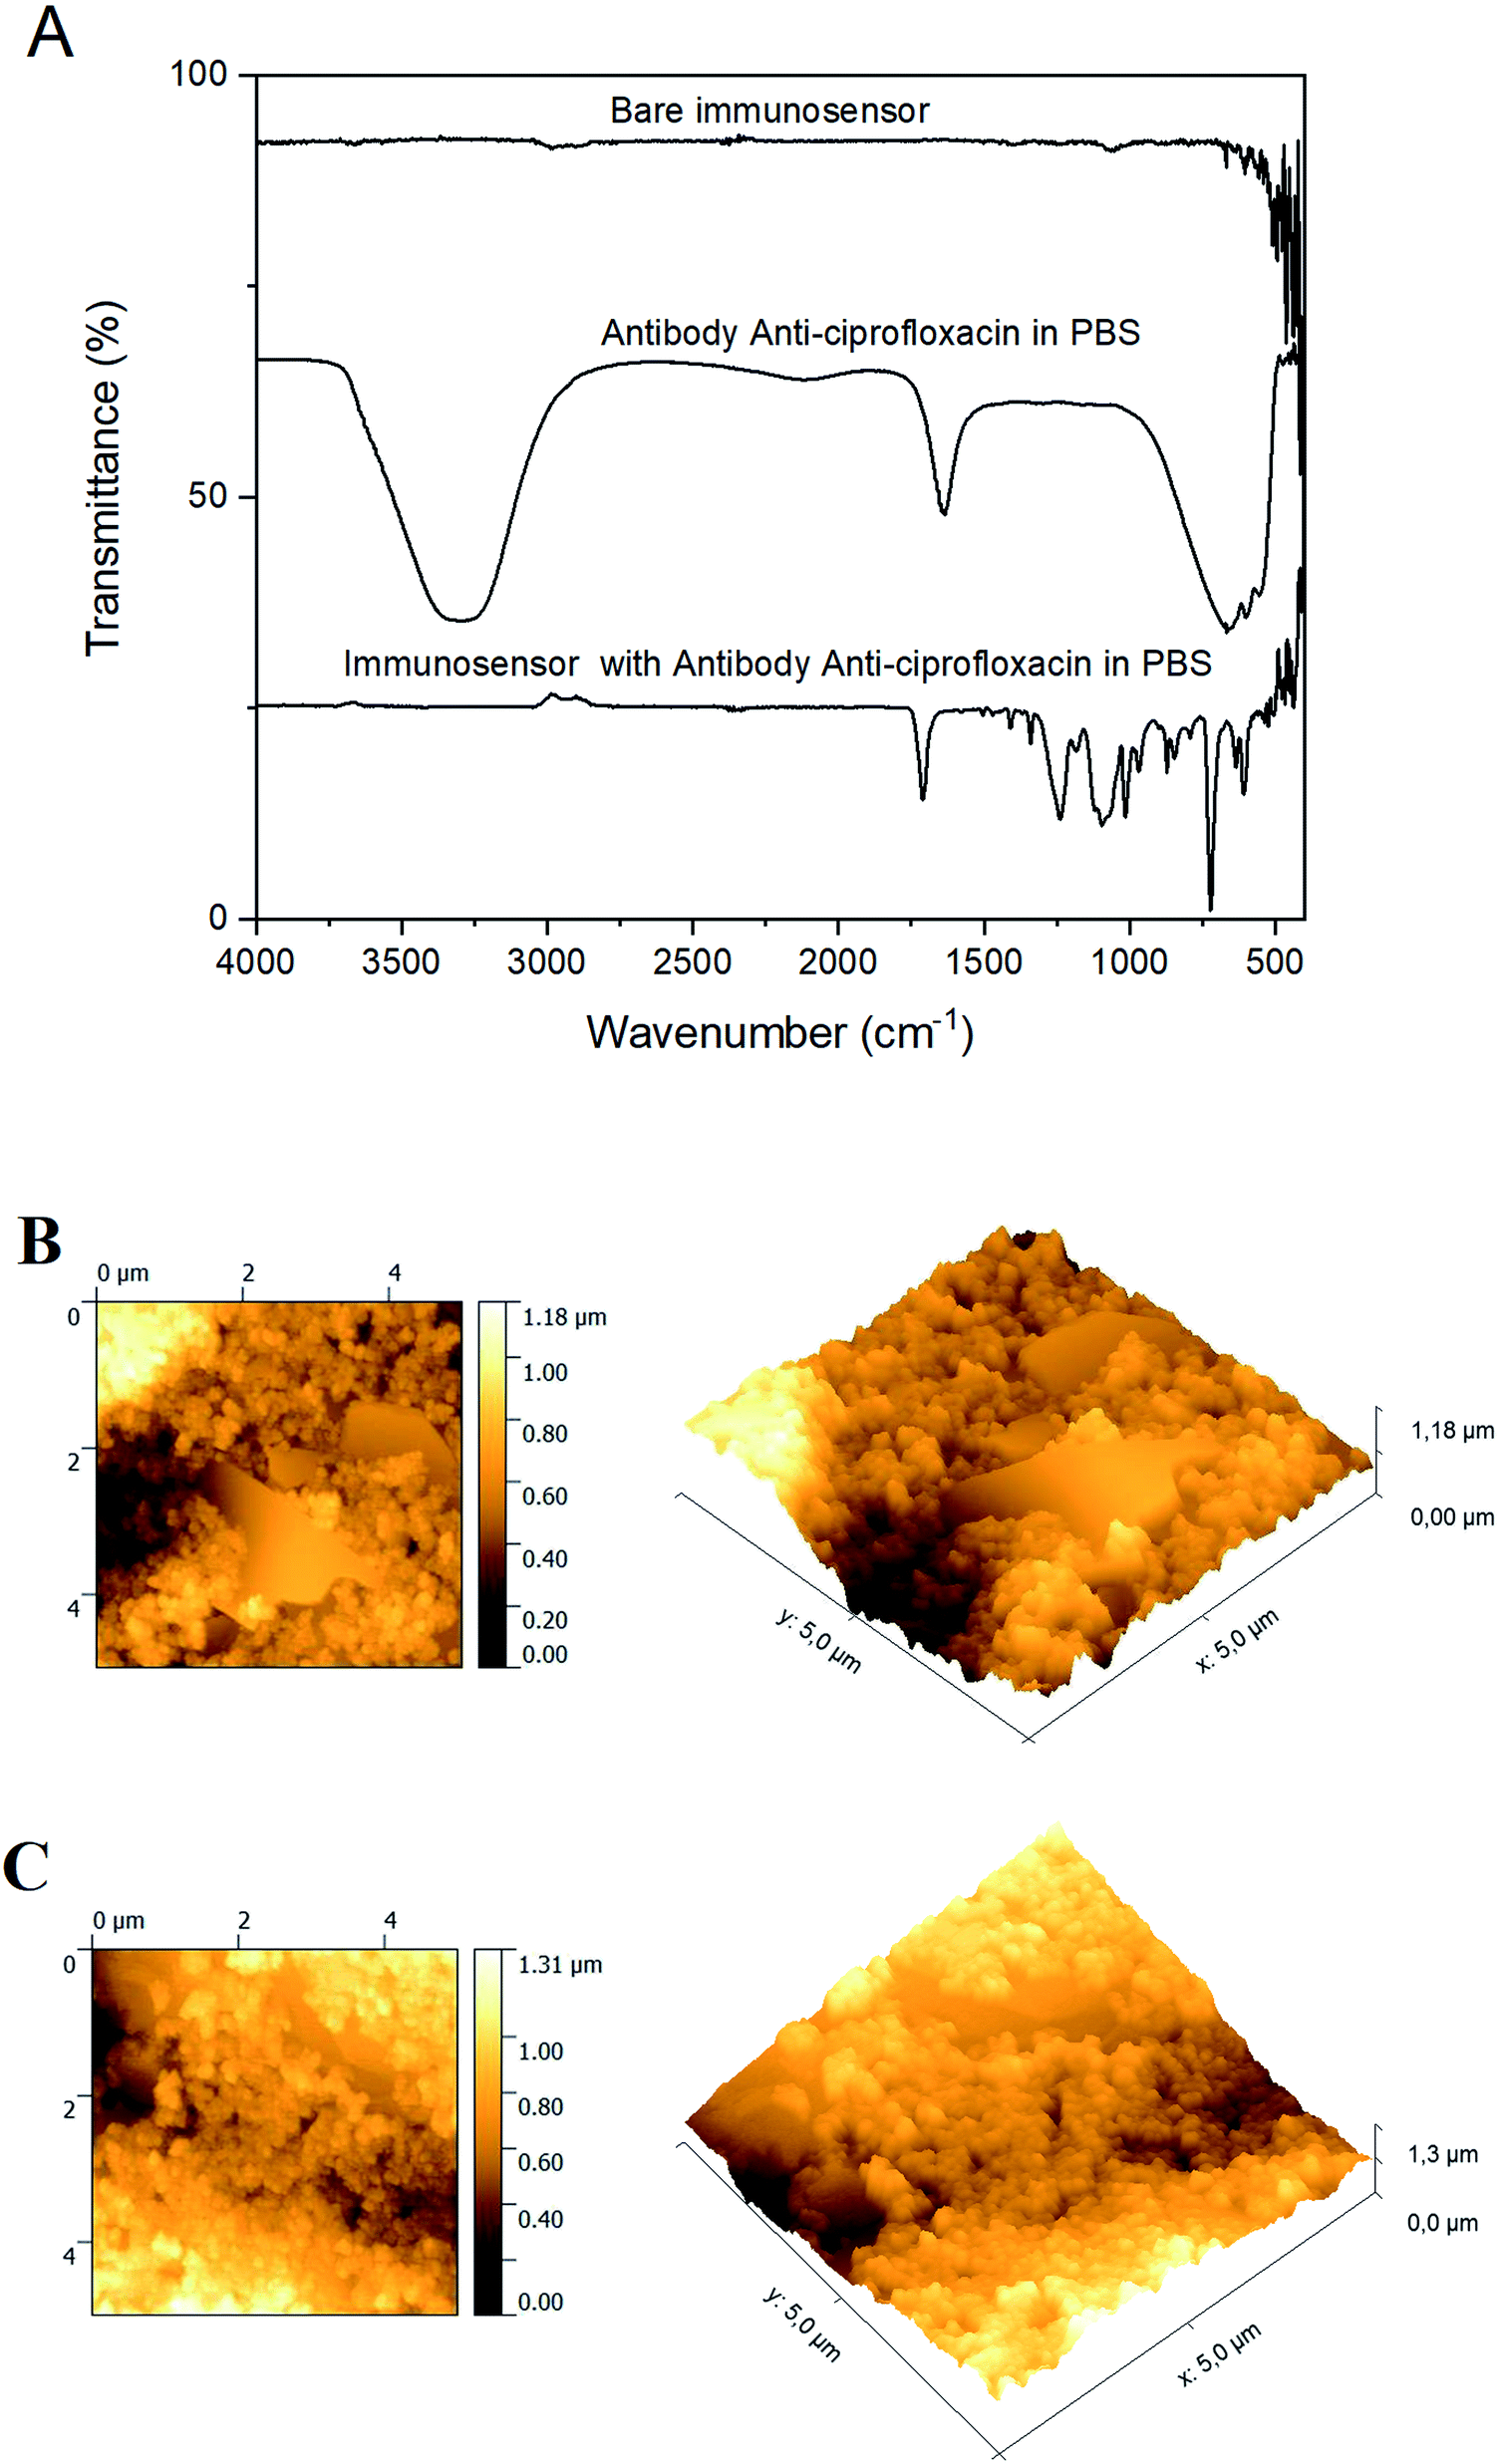 | ||
| Fig. 2 (A) Infrared spectra for bare SPCE electrode, anti-ciprofloxacin antibody prepared in PBS at 100 μg mL−1, and immunosensor after antibody immobilization (SPCE/EDC/NHS/IgG in PBS at 100 μg mL−1). AFM images (B) before and (C) after antibody immobilization. | ||
Fig. 2A shows the FTIR spectra for the bare immunosensor, the anti-ciprofloxacin antibody and the immunosensor with the anti-ciprofloxacin antibody. In terms of peak assignments, in Fig. 2A the FTIR spectrum for the bare immunosensor shows a low-intensity band at 1072 cm−1, which was assigned to the C–C vibration.48
The FTIR spectrum of the anti-ciprofloxacin antibody prepared in PBS at a concentration of 100 μg mL−1 presents three bands: a band at 3303 cm−1 for the stretching vibration of the O–H group of water; a band at 1641 cm−1, which was assigned to the bending vibration of the quinolone group (δ N–H); and a broad band at 680 cm−1 assigned to the aromatic compost (δ Ar-H).49–51 In the FTIR spectrum for the immunosensor with anti-ciprofloxacin antibody, there are four main bands: the band at 1711 cm−1 is assigned to the stretching vibration of the C![[double bond, length as m-dash]](https://www.rsc.org/images/entities/char_e001.gif) O group of carboxylic acid (δ CO); an intense band at 1241 cm−1 refers to the bending vibration of a hydroxyl group (δ O–H); the band at 1014 cm−1 corresponds to the stretching mode of a C–F bond; and the band at 720 cm−1 is assigned to the bending vibration (δ Ar-H).49–51
O group of carboxylic acid (δ CO); an intense band at 1241 cm−1 refers to the bending vibration of a hydroxyl group (δ O–H); the band at 1014 cm−1 corresponds to the stretching mode of a C–F bond; and the band at 720 cm−1 is assigned to the bending vibration (δ Ar-H).49–51
Morphological images of the electrode surface were obtained before and after the immobilization of the antibody.
AFM images of the bare working electrode (Fig. 2B) present an irregular surface but after immobilization (SPCE/EDC/NHS/IgG in PBS at 100 μg mL−1) the surface is more symmetrical and more homogenous (Fig. 2C). In addition, the average deposit height increased from 1.18 μm (clean electrode) to 1.31 μm (antibody electrode), resulting in a smoother topography, indicating that the modifications occurred and the antibody was evenly distributed over the analyzed area. The immunosensor surface roughness was calculated using the root mean square (RMS) values obtained from the bare immunosensor and the immunosensor with the anti-ciprofloxacin antibody. The values obtained for the bare immunosensor and the immunosensor with anti-ciprofloxacin antibody were 170.3 nm and 210.5 nm, respectively, which demonstrates an increase in roughness over the analyzed area, meaning that the antibody has been evenly distributed on the electrode surface.
3.3 Validity of the EIS data
A K–K transform was performed to validate the EIS data, comparing the theoretical and experimental impedance in the frequency domain in order to investigate the influence of external factors on the EIS data.52Fig. 3 compares the experimental data and the K–K plot in the Bode diagram of the phase angle (ϕ) and the magnitude of impedance (|Z|) obtained from the developed immunosensor. The overlapping of the plots indicates that the experimental impedance data agree with the theoretical values, and the agreement of the theoretical and experimental values indicates that the electrochemical response is causal, linear and stable. These features mean that the measured impedance exclusively corresponds to the small AC perturbation and the response does not alter as a function of time, returning to the original state after interrupting the AC application.53
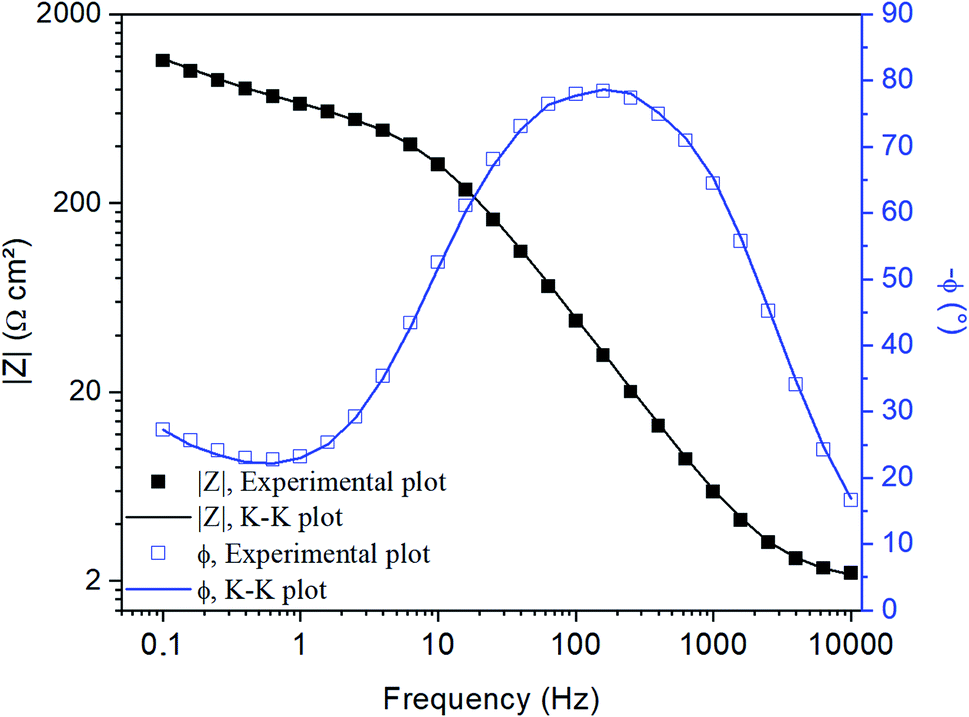 | ||
| Fig. 3 K–K and Bode plots obtained from the experimental EIS measurement using the bare electrode and the SPCE/EDC/NHS/IgG ciprofloxacin immunosensor in 0.1 mol L−1 of KCl and 0.005 mol L−1 K3[Fe(CN)6]/K4[Fe(CN)6] in 0.01 mol L−1 PBS. | ||
3.4 Impedimetric detection of ciprofloxacin
In order to evaluate the sensor performance, impedance measurements were carried out by using the electrode SPCE/EDC/NHS/IgG in the absence and presence of ciprofloxacin at concentrations from 10−7 to 1.0 μg mL−1 in a lab-made sewage solution. Fig. 4 displays the typical Nyquist plot consisting of a semicircle portion from high to intermediate frequencies referring to the [Fe(CN)6]3−/4− charge transfer kinetics in the electrode interface and the electrolyte. The redox probe diffusional processes are represented by straight lines. The EIS data were fitted to the equivalent circuit shown in the inset of Fig. 4, and the model quality ensured by the low resultant chi-squared values (χ2 around 10−5).37 The circuit consists of an electrolyte resistance (Re) connected in series with a constant phase element (CPE) in parallel to a charge transfer resistance (Rct) and a Warburg impedance (W). The Re is mostly influenced by the PBS and KCl conductivity and, as expected, it barely varied in each measurement since the same solution composition was used in all tests. The CPE is usually employed instead of a pure capacitor to fit EIS data because it takes into account the frequency dispersion that arises from the electrode surface heterogeneities, material porosity, fractal geometry, and other relevant factors.54 The CPE comprises the imaginary number , the angular frequency ω, a frequency-independent constant T and the exponent p, which is associated with the CPE deviation from the ideal capacitor as expressed in eqn (1). If p = 1, one assumes it refers to a pure capacitor.
 | (1) |
 | ||
| Fig. 4 Impedance spectrum for immunosensor exposed to ciprofloxacin at concentrations from 10−7 to 1.0 μg mL−1. The inset represents the equivalent circuit used to fit the EIS data. | ||
Regardless, the immunosensor was tested in different ciprofloxacin solutions and p = 0.949 ± 0.002, close to 1, indicating the electrode's surface homogeneity and the regular distribution of capacitance on the sensor's surface.
The Warburg impedance appears as an oblique line with an angle close to 45° in the Nyquist plot at low frequencies, which is related to mass-transfer limited processes.55
The Rct value can be estimated as the semicircle diameter, which represents the oxidative and reductive reactions kinetics involving the [Fe(CN)6]3−/4− ions, used by the electrode as an electron source. As demonstrated in Fig. 4, when the immunosensor was exposed to the target analyte solution, the semicircle diameter increased as the concentration increased, increasing the Rct value as the CIP concentration augmented. This fact indicates that CIP adhered to the antibody layer present on the sensor's surface and hindered the charge transfer involving the redox probe at the interface electrode/electrolyte.
The open circuit potential (OCP) was measured up to 300 s in a solution containing 0.01 mol L−1 PBS (pH 7.4) with 0.005 mol L−1 K3[Fe(CN)6]/K4[Fe(CN)6] as a redox probe at an amplitude potential of 10 mV, as shown in ESI Fig. 1.† The results indicate that CIP does not suffer oxidative or reductive reactions. Some authors have observed a single irreversible anodic peak for CIP only at the high oxidation potential of 1.1 V vs. Ag/AgCl owing to its oxidation to 1-cyclopropyl-5-fluoro-6-(piperazin-1-yl)indoline-2,3-dione.56,57 Therefore, there is an agreement that CIP is electroactive only under certain particular conditions of pH, buffer and scan rate.58,59
3.5 Calibration curve
The linearity of the immunosensor was assessed by spiking a lab-made sewage solution in the concentration range from 10−7 to 1.0 μg mL−1. Fig. 5 shows the Rct variation (ΔRct) calculated from the difference between the biosensor, Rct, before and after exposure to the target analyte solution. The ΔRct signal increased with the increase of the CIP concentration. The linear response varied from 1 × 10⁻⁵ to 1.0 μg mL−1 with a slope, intercept and R2 of 51.30, 1125 and 0.9914, respectively. At CIP concentrations of 1.0 × 10⁻⁷ μg mL−1 ≤ CCIP < 1.0 × 10⁻⁵ μg mL−1, the immunosensor was able to detect but not quantify the analyte. The LOD and LOQ were 2.50 × 10⁻⁶ μg mL−1 and 7.90 × 10⁻⁶ μg mL−1, respectively. The inter-day precision varied from 5.80 to 14.5%, demonstrating suitable precision according to FDA validation guidelines.60 The average method recovery was assessed by standard addition method in wastewater samples. CIP was spiked in wastewater samples to reach the concentration of 1 × 10⁻³ μg mL−1; after the analysis, the found CIP concentration was 9.70 × 10⁻⁴ μg mL−1, which represents a recovery of 97%. | ||
| Fig. 5 CIP immunosensor calibration curve obtained in lab-made sewage samples. | ||
The curve obtained through standard addition (y = 1.57 × 10⁵ [CIP] + 9.20; R2 = 0.998) enabled us to determine the CIP concentration in the wastewater samples. Considering the dilution performed previously, the CIP concentration in the wastewater sample was 2.90 × 10⁻⁴ μg mL− 1. The choice of analyte determination by standard addition curve was based on FDA guidelines, which indicates the use of this calibration method in samples with complex matrix compositions.60 The results clearly show that the SPCE/EDC/NHS/IgG electrode presents a stable modifier on the surface, allowing the detection of the antibiotic at low concentrations in complex samples without any pre-treatment and the method could be an attractive way to monitor CIP using an environmentally friendly detection method.
3.6 Immunosensor selectivity
The immunosensor response was evaluated in the presence of other contaminants, such as venlafaxine (VEN), carbamazepine (CBZ) and norfloxacin (NOR). The choice of interfering species was based on the high occurrence of these compounds in wastewater1,61–63 and also due to the chemical structure of norfloxacin being similar to that of CIP, since both are fluoroquinolone antibiotics. The compounds were spiked individually at 1.0 μg mL−1 in the lab-made sewage solution at room temperature and submitted for analysis after 20 min of exposure to the immunosensor. The EIS measurements were performed in two replicates and the results are shown in Fig. 6. The signal obtained for each potential interferent was compared to the CIP signal at the same concentration (assumed as 100%). The measured signals for the interferents were CBZ-1.84%, NOR-8.61% and VEN-3.14%, demonstrating that there is no interference from these compounds. The Rct did not increase after the biosensor had been exposed to each of the potential interferents, indicating that the antibody on the working electrode presented high selectivity for CIP and did not bind to CBZ, VEN and NOR present in the samples. This shows that the proposed method presents high selectivity, even in the presence of other antibiotics with similar chemical structures. | ||
| Fig. 6 Relative signal intensities for CIP, CBZ, NOR and VLF during sample analysis at 1.0 μg mL−1. | ||
Table 2 presents the results obtained in this study in comparison to those for other methods applied for CIP determination reported in the literature.
| Probe | Transducer | Method | Sensitivity | LOD [μM] | Sample | Reference |
|---|---|---|---|---|---|---|
| a Ampere.b Cyclic voltammetry. | ||||||
| Anti-ciprofloxacin IgG | SPCE | EIS | 51.30 Ω A mol−1 L | 7.5 × 10⁻⁶ | Wastewater samples | Proposed |
| Molecularly imprinted polymer (MIP) | Magnetic carbon nanotubes | CVb and differential pulse voltammetry | 0.0228 Aa mol L−1 | 0.0017 | Human serum, human urine and tablets | 64 |
| MIP | Micromechanical cantilever | Dynamic optical sensing | 2.60 pg Hz−1 | 0.80 | Water resources | 65 |
| Custom transducer | Gold nanoparticles and chitosan | CVb | — | 0.0010 | Biological samples | 66 |
| Multiwalled carbon nanotube, β-cyclodextrin and polyaniline | Glassy carbon | CVb | 0.257 Aa mol L−1 | 0.050 | Water samples | 67 |
| DNA | Graphene/SPCE | Square-wave voltammetry | 0.136 A mol L−1 | 0.10 | Human serum, human urine | 68 |
| Spinel structured Ba0.5Co0.5Fe2O | Glassy carbon | CVb | 0.0102 Aa mol L−1 | 0.0058 | Pharmaceutical formulations | 69 |
These data indicate that the proposed electrode presents higher sensitivity and a lower detection limit than several other methods, and does not undergo poisoning during consecutive tests. Furthermore, the proposed sensor is precise, presenting low intraday variability and high selectivity, even in complex samples such as sewage.
4. Conclusion
The present study illustrates an easy way to modify a screen-printed carbon electrode with an anti-ciprofloxacin monoclonal antibody (IgG) and monitoring by EIS. The array was used in the development of a sensitive, selective and low-cost impedimetric immunosensor for analysis of ciprofloxacin in wastewater samples, allowing determination at extremely low concentrations. The presented method has been applied to wastewater samples, demonstrating high recovery (97%) and accuracy even in a complex sample, being a rapid alternative method for monitoring of CIP in wastewater samples. The analysis was fast, taking about 2 minutes per analysis, and no sample preparation procedure was required, only a 1:5 dilution in PBS buffer was sufficient. Moreover, the method requires only 30 μL of sample and has an estimated total cost of U$ 2.00 per analysis considering the SPCE electrode. The proposed method generates a small amount of chemical residues, making it an environmentally friendly method.
Conflicts of interest
There are no conflicts to declare.Acknowledgements
The authors are thankful to Wagner Rafael Correr from the COPL for AFM measurement; Professor Dra. Céline Vaneeckhaute for providing the wastewater samples; Université Laval (Québec, Canada); Canada Excellence Research Chair in Photonic Innovations (CERCP), FAPESP process no. 2018/22393-8, 2015/22828-6, 2013/07793-6 and 2014-50945-4; Coordenação de Aperfeiçoamento de Pessoal de Nível Superior (Capes) and IQ-Unesp-Araraquara.References
- A. M. Botero-Coy, et al., Sci. Total Environ., 2018, 642, 842–853, DOI:10.1016/j.scitotenv.2018.06.088.
- J. Glady-Croue, et al., Sci. Total Environ., 2018, 626, 1005–1011, DOI:10.1016/j.scitotenv.2018.01.101.
- B. Petrie, R. Barden and B. Kasprzyk-Hordern, Water Res., 2015, 72, 3–27, DOI:10.1016/j.watres.2014.08.053.
- E. Marti, E. Variatza and J. L. Balcazar, Trends Microbiol., 2014, 22, 36–41, DOI:10.1016/j.tim.2013.11.001.
- L. A. Brunton, et al., Sci. Total Environ., 2019, 687, 1344–1356, DOI:10.1016/j.scitotenv.2019.06.134.
- C. A. Oliveira, et al., J. Hazard. Mater., 2018, 365, 34–43, DOI:10.1016/j.jhazmat.2018.10.077.
- C. X. Hiller, et al., Sci. Total Environ., 2019, 685, 596–608, DOI:10.1016/j.scitotenv.2019.05.315.
- J. Bengtsson-Palme, et al., Water Res., 2019, 162, 437–445, DOI:10.1016/j.watres.2019.06.073.
- A. Pruden, et al., Environ. Sci. Technol., 2006, 40, 7445–7450, DOI:10.1021/es060413l.
- A. Pruden, et al., Environ. Health Perspect., 2013, 121(8), 878–885, DOI:10.1289/ehp.1206446.
- T. T. Thanh-TinNguyen, et al., Bioresour. Technol., 2019, 273, 573–580, DOI:10.1016/j.biortech.2018.11.058.
- M. Harrabi, et al., Environmental Nanotechnology, Monitoring & Management, 2018, 10, 163–170, DOI:10.1016/j.enmm.2018.05.006.
- D. B. Hernández-Uresti, C. Alanis-Moreno and D. Sanchez-Martinez, Mater. Sci. Semicond. Process., 2019, 102, 104585, DOI:10.1016/j.mssp.2019.104585.
- T. Lu, et al., Environ. Int., 2019, 126, 268–278, DOI:10.1016/j.envint.2019.02.050.
- Y. Yang, Z. Liu, S. Xing and X. Liao, Ecotoxicol. Environ. Saf., 2019, 182 DOI:10.1016/j.ecoenv.2019.109452.
- X. Yu, et al., Chem. Eng. J., 2019, 374, 316–327, DOI:10.1016/j.cej.2019.05.177.
- J. Bengtsson-Palme and D. G. J. Larsson, Environ. Int., 2016, 86, 140–149, DOI:10.1016/j.envint.2015.10.015.
- C. ChenLiu, et al., Water Res., 2012, 46(16), 5235–5246, DOI:10.1016/j.watres.2012.07.005.
- S. Muthumariappan, J. Pharm. Res., 2013, 6(4), 437–441, DOI:10.1016/j.jopr.2013.04.009.
- Z. Liu, et al., Bioresour. Technol., 2013, 144, 644–651, DOI:10.1016/j.biortech.2013.07.031.
- C. G. Daughton and T. A. Ternes, Environ. Health Perspect., 1999, 107, 907–938, DOI:10.1289/ehp.99107s6907.
- M. Rusch, A. Spielmeyer, H. Zorn and G. Hamscyang, Appl. Microbiol. Biotechnol., 2019, 103, 6933–6948, DOI:10.1007/s00253-019-10017-8.
- R. Lindberg, et al., Chemosphere, 2004, 57, 1479–1488, DOI:10.1016/j.chemosphere.2004.09.015.
- J. Feitosa-Felizzola and S. Chiron, J. Hydrol., 2009, 364, 50–57, DOI:10.1016/j.jhydrol.2008.10.006.
- R. Wang, et al., Sci. Total Environ., 2019, 660, 1542–1554, DOI:10.1016/j.scitotenv.2019.01.12.
- R. Mirzaei, et al., Chemosphere, 2019, 221, 55–66, DOI:10.1016/j.chemosphere.2018.12.187.
- P. K. Singh, et al., J. Food Sci. Technol., 2016, 53(4), 1759–1765, DOI:10.1007/s13197-015-2041-7.
- P. Mehrotra, Journal of Oral Biology and Craniofacial Research, 2016, 6(2), 153–159, DOI:10.1016/j.jobcr.2015.12.002.
- Y. Ma and X. Yang, J. Electroanal. Chem., 2005, 580(2), 348–352, DOI:10.1016/j.jelechem.2005.03.027.
- F. Lisdat and D. Schäfer, Anal. Bioanal. Chem., 2008, 391, 1555–1567, DOI:10.1007/s00216-008-1970-7.
- E. Katz and I. Willner, Electroanalysis, 2003, 15, 913–947, DOI:10.1002/elan.200390114.
- M. Aydin, E. B. Aydin and M. K. Sezgintürk, Biosens. Bioelectron., 2019, 126, 230–239, DOI:10.1016/j.bios.2018.10.051.
- N. Ruecha, K. Shin, O. Chailapakul and N. Rodthongkum, Sens. Actuators, B, 2019, 279, 298–304, DOI:10.1016/j.snb.2018.10.024.
- M. Aydın, E. B. Aydın and M. K. Sezgintürk, Biosens. Bioelectron., 2018, 107, 1–9, DOI:10.1016/j.bios.2018.02.017.
- G. Fusco, et al., Biosens. Bioelectron., 2017, 93, 52–56, DOI:10.1016/j.bios.2016.10.016.
- W. Wen, et al., Anal. Chem., 2017, 89(1), 138–156, DOI:10.1021/acs.analchem.6b04281.
- R. A. D. Faria, et al., Biosens. Bioelectron., 2018, 9(4), 1–7, DOI:10.4172/2155-6210.1000264.
- C. G. Rocha, A. A. P. Ferreira and H. Yamanaka, Sens. Actuators, B, 2016, 236, 52–59, DOI:10.1016/j.snb.2016.05.040.
- G. S. Martins, et al., Scientia Chromatographica, 2017, 9(4), 253–264, DOI:10.4322/sc.2017.020.
- A. M. Santos, et al., J. Braz. Chem. Soc., 2015, 26(10), 2159–2168, DOI:10.5935/0103-5053.20150203.
- C. Thunkhamrak, et al., Talanta, 2020, 208 DOI:10.1016/j.talanta.2019.120389 , .
- N. Verdoodt, C. R. Basso, B. F. Rossi and V. A. Pedrosa, Food Chem., 2017, 221, 1792–1796, DOI:10.1016/j.foodchem.2016.10.102.
- L. Sun, et al., Int. J. Electrochem. Sci., 2017, 12, 6170–6179, DOI:10.20964/2017.07.72.
- D. Lima, et al., Biosens. Bioelectron., 2019, 133, 86–93, DOI:10.1016/j.bios.2019.02.063.
- C. Garcia-Hernandez, et al., Sens. Actuators, B, 2018, 277, 365–372, DOI:10.1016/j.snb.2018.09.023.
- J. Yang, et al., Talanta, 2015, 142, 183–189, DOI:10.1016/j.talanta.2015.04.042.
- R. A. D. Faria, L. G. D. Heneine, T. Matencio and Y. Messaddeq, International Journal of Biosensors & Bioelectronics, 2019, 5(1), 29–31, DOI:10.15406/ijbsbe.2019.05.00148.
- V. Ţucureanu, A. Matei and A. M. Avram, Crit. Rev. Anal. Chem., 2016, 46, 502–520, DOI:10.1080/10408347.2016.1157013.
- S. Sahoo, et al., Int. J. Pharm. Pharm. Sci., 2011, 3, 165–170 CAS.
- S. Sahoo, et al., Trop. J. Pharm. Res., 2011, 10(3), 273–280, DOI:10.4314/tjpr.v10i3.14.
- S. M. Dizaj, et al., Artif. Cells, Nanomed., Biotechnol., 2017, 45, 535–543, DOI:10.3109/21691401.2016.1161637.
- A. Gündoğdu, E. B. Aydın and M. K. Sezgintürk, Anal. Biochem., 2017, 537, 84–92, DOI:10.1016/j.ab.2017.08.018.
- S. Cruz-Manzo, R. Chen and P. Greenwood, Insights in Analytical Electrochemistry, 2015, 1(1), 1–12, DOI:10.21767/2470-9867.100003.
- S. Bhand and G. Bacher, Environmental, Chemical and Medical Sensors, 2017, pp. 67–85, DOI:10.1007/978-981-10-7751-7_4.
- T. C. Pimenta, C. C. Santos, R. L. Thomasini and L. F. Ferreira, Biomed. Microdevices, 2018, 20(3), 1–9, DOI:10.1007/s10544-018-0324-2.
- A. R. Rahmani, et al., J. Electroanal. Chem., 2018, 808, 82–89, DOI:10.1016/j.jelechem.2017.11.067.
- L. Fotouhi and M. Alahyari, Colloids Surfaces B Biointerfaces, 2010, 81(1), 110–114, DOI:10.1016/j.colsurfb.2010.06.030.
- M. P. Kingsley, P. K. Kalambate and A. K. Srivastava, RSC Adv., 2016, 6, 15101–15111, 10.1039/c5ra19861e.
- G. S. Garbellini, R. C. Rocha-Filho and O. Fatibello-Filho, Anal. Methods, 2015, 7, 3411–3418, 10.1039/c5ay00625b.
- FDA validation guidelines, available https://www.fda.gov/regulatory-information/search-fda-guidance-documents/process-validation-general-principles-and-practices, acessed 08/28/19.
- F. O. Agunbiade and B. Moodley, Environ. Toxicol. Chem., 2016, 35, 36–46, DOI:10.1002/etc.3144.
- S. Fekadu, et al., Sci. Total Environ., 2019, 654, 324–337, DOI:10.1016/j.scitotenv.2018.11.072.
- E. A. Serna-Galvis, et al., Water Res., 2019, 154, 349–360, DOI:10.1016/j.watres.2019.01.045.
- H. Bagheri, H. Khoshsafar, S. Amidi and Y. Hosseinzadeh Ardakani, Anal. Methods, 2016, 8(16), 3383–3390, 10.1039/c5ay03410h.
- M. Okan, E. Sari and M. Duman, Biosens. Bioelectron., 2017, 88, 258–264, DOI:10.1016/j.bios.2016.08.047.
- K. R. Reddy, P. K. Brahman and L. Suresh, Measurement, 2018, 127, 175–186, DOI:10.1016/j.measurement.2018.05.078.
- M. P. J. Garrido, et al., J. Environ. Sci. Health, Part A: Toxic/Hazard. Subst. Environ. Eng., 2016, 1–7, DOI:10.1080/10934529.2016.1258864.
- S. A. Lim and M. U. Ahmed, Anal. Sci., 2016, 32, 687–693, DOI:10.2116/analsci.32.687.
- N. S. E. Osman, et al., J. Mater. Sci.: Mater. Electron., 2015, 26(7), 5097–5105, DOI:10.1007/s10854-015-3036-x.
Footnote |
| † Electronic supplementary information (ESI) available. See DOI: 10.1039/c9ra09083e |
| This journal is © The Royal Society of Chemistry 2020 |