 Open Access Article
Non-destructive broadband terahertz spectroscopy for investigating degradation of poly(2-ethylcyanoacrylic) adhesive
Seiichiro Ariyoshi *a,
Budi Setyawana,
Satoru Hashimotoa,
Shun Negishia,
Hikaru Mikamia and
Nobuya Hiroshiba*b
aToyohashi University of Technology, 1-1 Hibarigaoka, Tempaku-cho, Toyohashi, Aichi 441-8580, Japan. E-mail: ariyoshi@tut.jp
bNational Institute of Technology, Maizuru College, 234 Shiroya, Maizuru, Kyoto, 625-8511, Japan. E-mail: n.hiroshiba@maizuru-ct.ac.jp
First published on 28th February 2020
Abstract
We apply Fourier-transform terahertz spectroscopy to investigate the deformation of poly(2-ethylcyanoacrylic) adhesive (PECA) on a polyethylene substrate. The terahertz absorption spectra of the PECA samples were measured over the frequency range 1–10 THz, and absorption peaks from the adhesive layer were identified at 5.70, 6.23, and 7.55–9.12 THz. The PECA samples were then degraded via a hydration reaction, with the terahertz spectra showing a decrease in the intensity of the main peaks of PECA with increasing water degradation time. This study demonstrates the potential of terahertz spectroscopy for the continuous monitoring of the degradation of an adhesive layer.
Introduction
The purpose of this study was to demonstrate the applicability of THz spectroscopy for adhesive polymer materials. The role of adhesive polymer materials in bonding technologies continues to increase in importance. For example, biocompatible polymer adhesive materials are used in medical applications, such as surgical closure procedures and medical device assembly.1,2 In the aerospace industry, adhesive polymer materials are intensively applied to achieve optimum bonding strength in the manufacture of fibre-reinforced composites.3 These novel applications pose questions regarding the mechanical, chemical, and long-term stability of adhesive polymer materials in unconventional environments. It is important to clarify the adhesion, solidification, and degradation mechanisms of adhesive polymer materials on biological surfaces such as skin or on aerospace materials. Recently, researchers have sought to find a direct correlation between the adhesive properties at joints and the entangled structure of the molecular chains.4 For this purpose, a non-destructive method of evaluating the higher-order structures of adhesive polymer materials is crucial. Destructive methods that have been reported in past studies, such as pressing, shearing, and cleaving, are not suitable for in situ observations or continuous testing in unconventional environments. X-ray testing is a non-destructive and effective method for testing small samples; however, it is not suitable for large-scale applications and can only be used in certain measurement environments. Here, we focus on terahertz (THz) spectroscopy, which has the potential to advance the non-destructive investigation of adhesive polymer materials.THz spectroscopy offers many advantages as a non-destructive testing tool for the comprehensive study of polymers,5,6 including thermosetting and/or UV-curable adhesive polymer materials. In the THz or far-infrared regime, which loosely comprises frequencies from 0.1 THz to 10 THz, many polymers evidence high transparency. Electromagnetic waves in this region interact with the collective kinetic modes of large molecules, including both the intra- and inter-molecular vibrations of polymer chains, especially in crystalline polymers.7 Consequently, THz spectroscopy has been used in a variety of polymer studies, including analyses of water absorption in composite polymers,8 the orientation of glass fibres in reinforced plastics,9 and the tacticity of polymers.10 In recent years, the high-order structures of amorphous polymers have also been investigated using boson peak model analysis of the low-frequency region of their THz spectra.11,12
Adhesive systems undergo polymerisation to become polymer materials. While some THz spectroscopic investigations have been carried out on adhesives under limited conditions, there have been no systematic investigations of adhesives systems and their degradation processes using broadband THz spectroscopy.
In this paper, we introduce the use of broadband THz spectroscopy to quantitatively study the polymerisation and degradation of adhesive joints and their degradation, which enables continuous in situ inspection. We utilised polyethylene (PE) as a substrate and poly(2-ethylcyanoacrylic) adhesive (PECA). PECA is a commercially available polymer adhesive material that is used for surgical closure procedures and as a liquid bandage for medical applications. To perform an initial analysis of the correlation between sample degradation and the spectral changes in the THz range, we measured the THz spectra of PECA on a PE substrate to characterise the peaks of the adhesive layer. Subsequently, we degraded the adhesive by immersing it in water. To analyse the spectral changes induced by the deformation of the PECA structure, we calculated the full width at half-maximum (FWHM) and peak height values of the PECA peaks in the spectra of the degraded PECA samples.
Experimental
Sample preparation
The adhesive substrates were fabricated from PE pellets purchased from Sigma-Aldrich. The pellets were first heated above the fusion temperature (>135 °C) and then pressed into a discoid shape with a thickness of 2 mm and diameter of 20 mm under nitrogen purging conditions to prevent oxygen or water vapour from becoming trapped in the sample. After five minutes, the pellets were completely melted, as indicated by their translucent white appearance. The temperature was decreased to the crystallisation temperature (115 °C) at a cooling rate of 1 °C min−1 rate and held at 115 °C for five minutes to complete the crystallisation process. The samples were then abruptly immersed in liquid nitrogen (−196 °C) to ensure a similar PE crystal structure in every sample. Two types of PE discoids were prepared: high-density polyethylene (HDPE) and low-density polyethylene (LDPE) discoids. Each was fabricated for a specific purpose; the HDPE discoids served as substrates and LDPE discoids were used as lids. The substrates were subjected to THz spectroscopy, while the lids were only used as templates for PECA films.The PECA adhesive system is widely known as the commercially available Loctite 480. The main component of Loctite 480 is the monomer, ethyl cyanoacrylate. Single-layer PECA films and PE-PECA samples were prepared for measurement. The former was fabricated by first coating an LDPE lid with PECA and then curing and toughening the PECA film using one of two treatments: the air-exposure treatment, in which the PECA layer was completely exposed to the atmosphere, and the air-protected treatment, in which an LDPE lid was placed onto the PECA layer to protect it from excess interaction with the atmosphere. After the complete curing of PECA (24 h), the LDPE layer was removed to obtain a PECA-only film approximately 10 μm in thickness. The PE-PECA samples were fabricated with the same thickness as the PECA film samples by dispensing PECA adhesive liquid onto an HDPE substrate and placing an LDPE lid over it. After the PECA had cured, the LDPE lid was peeled off to obtain the stratified PE-PECA sample. Note that in this sample type, PE always refers to HDPE, and the air-exposed curing method was not utilised due to spectral characteristics explained in the Results and discussion section.
THz spectrometer
THz spectra (1–10 THz) of the samples were measured using a Fourier-transform terahertz spectrometer (FT-TS) with a frequency resolution of 0.015 THz. The measurements were conducted at room temperature using a FARIS-S (JASCO Corporation) spectrometer equipped with a deuterated triglycine sulphate (DTGS) detector and a Martin–Puplett interferometer system, which enables a signal that is twice as strong as that obtained using conventional systems. The samples were placed horizontally and perpendicular to the THz wave propagation during the measurements, and the sample and interferometer spaces were evacuated to a pressure of less than 100 Pa to minimise absorption of the THz waves by oxygen gas or water vapour in the atmosphere.To investigate water deterioration of PECA, a PECA sample was immersed in distilled water with a pH of 7 and isolated from the ambient atmosphere to minimise the increase in acidity of the water due to reaction with carbon dioxide in the air.13 The sample was dried and its THz spectrum was obtained. Subsequently, the sample was again immersed in the water. After 24 h, the sample was dried and measured. These procedures were repeated for 15 d to follow the degradation process.
Results and discussion
Adhesive curing
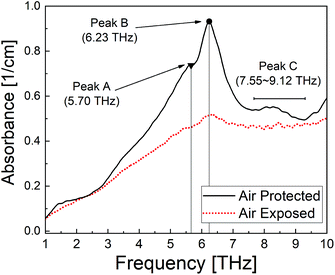
To investigate the relationship between the polymerisation process14 and the THz spectral features, measurements were conducted on two PECA films cured under different conditions. The THz spectra of the samples were significantly different; the air-exposed film showed almost no peaks compared to the air-protected one (Fig. 1). The air-protected sample showed clear crystalline peaks at 5.70 THz and 6.23 THz and a broad absorption peak over the range 7.55–9.12 THz. In contrast, the air-exposed sample showed only a broad absorption curve in the THz region. Such absorption curves have been observed for various amorphous polymers, thus demonstrating the low crystallinity of the air-exposed sample.7,15 These results indicated that the cured PECA product was more amorphous when the sample was cured in complete contact with the atmosphere (i.e. in the presence of excess water molecules) than with limited exposure to air (i.e. less contact with water molecules). This observation was consistent with the polymerisation mechanism of PECA, in which the presence of water molecules both initiates and terminates chain propagation (Fig. 2). Under the air-exposed curing conditions, an excess of water molecules is present; as a result, the frequency of initiation and termination events increases. This directly affects the propagation reaction, leading to the formation of short molecular chains with a low molecular weight. The high entropy of the short PECA chains resulted in a randomly arranged overall structure. Furthermore, it is difficult for these short chains to crystallise, as the crystallisation of PECA involves a chain-folding process that requires a longer chain length. In contrast, in the air-protected sample, water molecules were only supplied at the edge of the discoid sample, leading to longer propagation because termination was less frequent. As a result, the final molecular chains were longer, and the formation of a crystalline structure via the folding process was more favourable. This fact agrees well with the spectral characteristics shown in Fig. 1.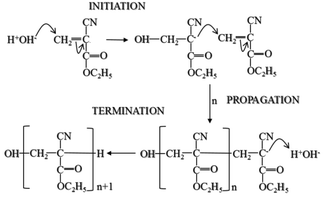 | ||
| Fig. 2 Curing mechanism of 2-ethylcyanoacrylate (ECA).14 | ||
In addition, a clear difference was observed between the air-exposed and air-protected spectra in the low frequency region below 2 THz, which is attributed to the amorphous and nanosized entanglement structure of the PECA samples. The lack of observable spectral bands in the low frequency region due to our instrumental setup prevents in-depth discussion of the fine nanostructure of the amorphous structure based on the boson peaks.11,12 However, we believe that the differences in this region should be considered in further investigations to provide a wider understanding of the curing processes and nanostructures of adhesive polymer materials.
Absorption spectra of the PECA and PE-PECA samples
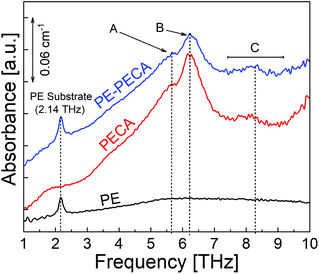
In the previous section, the THz spectrum of the air-protected crystalline PECA was analysed. The THz spectrum of PECA coated on a PE substrate using the same curing method was measured to confirm that the spectral features of the substrate and the adhesive layer could be visually distinguished. The spectra of PE-PECA, the PECA film, and the PE substrate are presented in Fig. 3, which demonstrates that the spectral features corresponding to each component of the assembled sample can be distinguished. In the PE-PECA spectrum, the PE substrate peak is clearly observed at 2.14 THz, while the PECA peaks (A, B and C) are found above 5 THz.Water deterioration of PECA
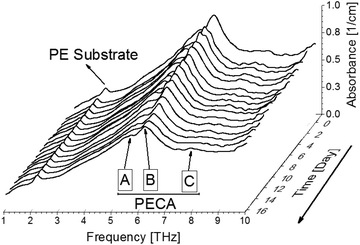
After identifying the THz spectral characteristics of PECA and the stratified PE-PECA samples, adhesive degradation experiments were performed on the PE-PECA sample to identify the correlation between the molecular changes that occurred during the degradation of the cured PECA and the resulting changes in the THz spectra. This investigation assumed that the PECA was depolymerised due to water molecules.16As shown in Fig. 4, the baselines of the THz spectra became lower as the adhesive degradation progressed. The peak of the PE substrate remained constant, indicating that the structure of PE was not affected by exposure to water. The decrease in the height of the PECA peaks can be explained in terms of the depolymerisation reaction presented in Fig. 5, in which a PECA chain is cleaved into two shorter fragments by the water molecule until the shortest fragment is obtained, which undergoes tautomerisation with water to produce formaldehyde. Decreasing the chain length of PECA directly affects its high-order structure, reducing the crystallinity of the overall PECA layer. Thus, as the PECA was degraded, the overall high-order structure became more amorphous, giving rise to the observed changes in the THz spectra.
 | ||
| Fig. 5 Depolymerisation reaction of PECA.16 | ||
To quantitatively analyse the changes in the spectral features of PECA, FWHM and peak height calculations17,18 were performed on peaks A and B for each of the spectra presented in Fig. 4. As an example, the peak analysis of the PECA spectrum obtained after one day is shown in Fig. 6. As peak C was a broad peak with no clear location, it was not analysed. However, peaks A and B had relatively constant positions throughout the degradation experiments. These two peaks were separated using Gaussian fitting functions, expressed as:
 | (1) |
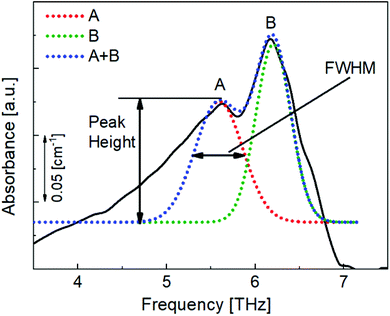 | ||
| Fig. 6 Gaussian approximation method used to separate peaks A and B and to obtain the FWHM and heights of these peaks for each spectrum. | ||
Here, xp is the peak frequency, σ is the standard deviation, S is the area below the curve, and y0 is the offset of the absorbance spectrum, with the baseline for this calculation being calculated from the right edge of the PE substrate peak (2.5 THz) and the left edge of peak C (7.5 THz) in the spectra of the PE-PECA samples. The peak height at x = xp can be directly obtained from the area divided by  and the FWHM
  can then be obtained after separating peaks A and B.
Peak heights and FWHM were plotted as a function of time, as shown in Fig. 7. This calculation provided a clearer and more detailed description of the spectral changes in peaks A and B; peak heights were found to decrease with time, while the FWHM increased. Hence, the peaks themselves became flatter, indicating that the degradation of PECA led to decreased crystallinity and a more amorphous nature.
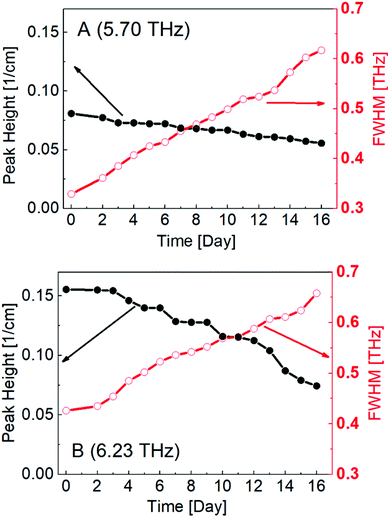 | ||
| Fig. 7 Calculated peak height and FWHM values of peak A (a) and peak B (b) plotted against degradation time. | ||
Thus, we clearly demonstrated the ability to analyse spectral changes in the THz region of an adhesive element (PECA) on a PE substrate, which is extremely advantageous and valuable for investigating and monitoring the adhesive degradation process. Water degradation is a critical process in adhesive elements, as it directly affects the joint strength, and adhesive systems are often exposed to humid atmospheres in real-world applications. THz spectroscopy could be used to provide direct information regarding the quality of an adhesive joint and its water degradation status. Moreover, by investigating the degradation of other polymer-adhesive systems and adhesive degradation induced by other sources, such as UV-exposure and high-temperature conditions, the proposed method could allow for even broader non-destructive testing of adhesive layers.
Conclusions
We have demonstrated that THz spectroscopy is a promising technique for the quality control and analysis of adhesive layer degradation. We also identified the THz peaks of PECA, which appeared at 5.70, 6.23, and 7.55–9.12 THz, and showed that the THz peaks of PE and PECA can be distinguished in the stratified substrate-adhesive system (PE-PECA). Using this technique, we analysed the degradation of PECA via water depolymerisation. The THz peaks exhibited decreased peak height and increased FWHM values with increasing PECA degradation. Consequently, THz spectroscopy is capable of monitoring degradation and ageing inside an adhesive joint, which could enable non-destructive testing to be widely implemented.Conflicts of interest
There are no conflicts of interest to declare.Acknowledgements
This study was partly supported by a Grant-in-Aid for Scientific Research (B) (No. 17H02809) from the Ministry of Education, Culture, Sports, Science and Technology of Japan.References
- J. Schultz and M. Nardin, in Handbook of Adhesive Technology, ed. A. Pizzi and K. L. Mittal, Marcel Dekker, Inc., New York, 2nd edn, 2003, ch. 3, pp. 53–68 Search PubMed.
- S. Ebnesajjad and A. H. Landrock, Adhesives Technology Handbook, Elsevier, 3rd edn, 2015 Search PubMed.
- D. Driver, in High Performance Materials in Aerospace, ed. H. M. Flower, Springer Science+Business Media, Dordrecht, 1995, ch. 11, pp. 318–339 Search PubMed.
- R. D. Adams, P. Cawley and C. C. H. Guyott, J. Adhes., 1987, 21, 279–290 CrossRef CAS.
- S. Wietzke, C. Jördens, N. Krumbholz, B. Baudrit, M. Bastian and M. Koch, J. Eur. Opt. Soc. Rapid Publ., 2007, 2, 07013 CrossRef.
- S. Wietzke, C. Jansen, M. Reuter, T. Jung, D. Kraft, S. Chatterjee, B. M. Fischer and M. Koch, J. Mol. Struct., 2011, 1006, 41–51 CrossRef CAS.
- V. A. Bershtein and V. A. Ryzhov, in Advances in Polymer Science, Springer-Verlag, Heidelberg, 1994, vol. 114, pp. 43–122 Search PubMed.
- C. Jördens, S. Wietzke, M. A. Scheller and M. Koch, Polym. Test., 2010, 29, 209–215 CrossRef.
- C. Jördens, M. Scheller, S. Wietzke, D. Romeike, C. Jansen, T. Zentgraf, K. Wiesauer, V. Reisecker and M. Koch, Compos. Sci. Technol., 2010, 70, 472–477 CrossRef.
- S. Ariyoshi, N. Hiroshiba, Y. Tanzawa, Y. Ichikawa and J. Bae, Mater. Res. Express, 2014, 1, 045303 CrossRef.
- W. Terao, T. Mori, Y. Fujii, A. Koreeda, M. Kabeya and S. Kojima, Spectrochim. Acta, Part A, 2018, 192, 446–450 CrossRef CAS PubMed.
- Y. Hashimoto, T. Mori and S. Kojima, Mol. Cryst. Liq. Cryst., 2016, 629, 258–263 CrossRef CAS.
- H. Li, A. Shi, M. Li and X. Zhang, J. Chem., 2013, 434012 Search PubMed.
- S.-L. Liu, Y.-Z. Long, Y.-Y. Huang, H.-D. Zhang, H.-W. He, B. Sun, Y.-Q. Sui and L.-H. Xia, Polym. Chem., 2013, 4, 5696–5700 RSC.
- H. Hoshina, Y. Morisawa, H. Sato, H. Minamide, I. Noda, Y. Ozaki and C. Otani, Chem. Phys., 2011, 13, 9173–9179 CAS.
- F. Leonard, R. K. Kulkarni, G. Brandes, J. Nelson and J. J. Cameron, J. Appl. Polym. Sci., 1966, 10, 259–272 CrossRef CAS.
- M. Vashista and S. Paul, Philos. Mag., 2012, 92, 4194–4204 CrossRef CAS.
- J. He and Q. Zhang, J. Opt. A: Pure Appl. Opt., 2007, 9, 565–568 CrossRef.
| This journal is © The Royal Society of Chemistry 2020 |

