 Open Access Article
Construction of H4xK2xSn2−xS4+x/TiO2 nanocomposites with enhanced visible light-driven photocatalytic performance
Rongjing Wang ,
Yaru Li,
Qianyi Sun,
Kaihua Gao,
Yufu Pan,
Meng Li,
Feitian Zhang and
Ping Na
 *
*
School of Chemical Engineering and Technology, Tianjin University, Tianjin 300354, P. R. China. E-mail: naping@tju.edu.cn
First published on 24th March 2020
Abstract
In this paper, a new photocatalyst with TiO2 nanospheres decorated on ultrathin layered thiostannate H4xK2xSn2−xS4+x (X = 0.5–0.6, HKTS) nanosheets was successfully synthesized by a facile solvothermal method combined with the hydrolysis of tetrabutyl titanate and it was denoted as HKTS/TiO2. By adjusting the content of tetrabutyl titanate, composites with different Sn/Ti molar ratios were prepared. The composites were applied for RhB degradation under visible light irradiation, and the optimum proportion of HKTS/TiO2 was obtained. The results of X-ray diffraction, Raman spectroscopy, Fourier transform infrared spectroscopy and scanning electron microscopy confirmed that TiO2 was successfully decorated on HKTS nanosheets. The combination of TiO2 and HKTS extended the absorption wavelength of TiO2 from UV to visible light range, and the separation efficiency of photoexcited electron–hole pairs was also enhanced. The photocatalytic degradation rate of RhB over HKTS/TiO2-1.0 was almost 97.9% after 60 min illumination, which was higher than those of HKTS and pure TiO2. The photocatalyst exhibited excellent reusability and stability as the degradation rate of RhB was 95.7% even after three cycles. The photocatalytic mechanism experiment indicated that ·O2− and h+ played a dominant role in the photocatalytic process. All these results indicate that the newly fabricated HKTS/TiO2 composites provide a high-performance photocatalyst for waste water treatment, and the application of thiostannate can be extended to the field of photocatalytic materials.
1. Introduction
In recent years, the emerging waste water with organic pollutants has caused great damage to the environment as the economy develops rapidly. Thus, it is imperative to develop a sort of high-performance environmentally functional material. Among these environmental remediation strategies, photocatalysis is considered an environmentally friendly technology.1,2 TiO2, serving as an important semiconductor, is widely used in fields of solar cell processing, water splitting, and photocatalysis due to its advantages such as long-term stability, non-toxicity, low cost and strong oxidation ability.3,4 However, the respense of TiO2 is limited to ultraviolet region due to the wide band gap (3.2 eV). Moreover, there are 4–5% ultraviolet rays and 40% visible light in the solar spectra.5 The low utilization of solar light restricts TiO2 applications in photocatalytic degradation. Furthermore, the high recombination rate of photoexcited electron–hole pairs also weakens the photocatalytic activity.6,7Studies have found that strategies such as heterojunction construction, elemental doping, and noble metal deposition can ameliorate the photocatalytic performance of TiO2 by refraining the recombination of electrons and holes8,9 and extending the light absorption. The successful synthesis and application of commercial Degussa P25 demonstrated that TiO2-based mixed-phase photocatalysts show greater performance than their single phase counterparts.10 Based on the aforementioned theory, Zhu et al. developed a new efficient TiO2(B) nanofiber with a shell of anatase nanocrystals, the photocatalytic performance of which was as good as that of commercial Degussa P25.11 Additionally, diverse methods including hydrothermal, solvothermal, sol–gel, and template-assisted methods have been used to fabricate TiO2-based materials for visible light photocatalysis.12 Over the past decades, considerable efforts have been made to modify the photocatalytic performance of one-dimensional TiO2 nanotubes.13,14 Various noble metals (Au, Ag, Pt, and Pd) were selected to decorate TiO2 to utilize the surface plasmon resonance effect as a result of optical excitation upon visible light irradiation.15 Qiu et al. made branched double-shelled TiO2 nanotubes using TiO2 nanotubes as backbones and fluorine-doped tin oxide as substrates, respectively, to enlarge the active surface.16 Besides, transition metal cation doping can also optimize the photoelectron transform efficiency. Su et al. doped Fe into TiO2 to form Fe/TiO2 NTA, which possessed improved acid orange II photocatalytic degradation activity. A large body of evidence proved that the {001} facet possesses superexcellent photocatalytic activity owing to its large amount of unsaturated Ti atoms and large Ti–O–Ti bond angles. Lu et al. used TiF4 as a raw material to prepare anatase with the exposed {001} facet by a hydrothermal method.17
Semiconducting layered chalcogenides have been increasingly attracting researcher's attention toward the environment and energy-related applications, and a recent study has found that the heterojunction fabricated with TiO2 and chalcogenides could enhance the separation efficiency of electron–hole pairs.18 Metal sulfide materials possess photoelectric properties and are applied in a wide array of potential devices including electrodes and batteries and in photocatalytic hydrogen production.19–21 Generally, structures coupled by CdS2/SnS2/MoS2 (ref. 22–24) with another semiconductor have been reported to obtain improved photocatalytic activities due to efficient charge separation, and they were applied in the field of toxic and carcinogenic pollutant decomposition. Similar to graphene sheets, the H4xK2xSn2−xS4+x (X = 0.5–0.6) nanosheet (HKTS), a kind of thiostannate material with a large ultrathin surface area and a feasible band gap,25,26 is considered an ideal semiconductor to fabricate composites with TiO2. Hence, this work proposes a novel strategy for decorating TiO2 nanospheres on layered HKTS nanosheets to prepare HKTS/TiO2. The composites, eventually, extend the photo response into a wide visible range, which boosts the photocatalytic performance.
Herein, HKTS/TiO2 composites were prepared by a facile two-step method. Layered HKTS nanosheets were first prepared by a solvothermal method. Then composites with different Sn/Ti rates were synthesized by decorating TiO2 on HKTS nanosheets by hydrolysis. Besides, the surface morphology, crystal structure and photocatalytic mechanism were studied by an array of characterizations. Furthermore, the photocatalytic performance and stability of HKTS/TiO2 driven by visible light were evaluated using photocatalytic experiments in which RhB was used as a probe.
2. Materials and methods
2.1. Materials
Tetrabutyl titanate (TBOT, AR), potassium carbonate (K2CO3, 99%, Aladdin), sulfur powder (99%, Aladdin), and tin powder (99.5%, Aldrich, <150 mm) were purchased from Aladdin Reagent Company. Hydrochloric acid (HCl, 36–38%) was kindly supplied by Kermel Chemical Reagent Co. Ltd (Tianjin, China). Rhodamine B (RhB, AR) and anhydrous ethanol were obtained from Tianjin Yuanli Chemical Company. All the reagents were analytically pure, and there is no need for further purification.2.2. Synthesis of H4xK2xSn2−xS4+x (X = 0.5–0.6, HKTS) nanosheets
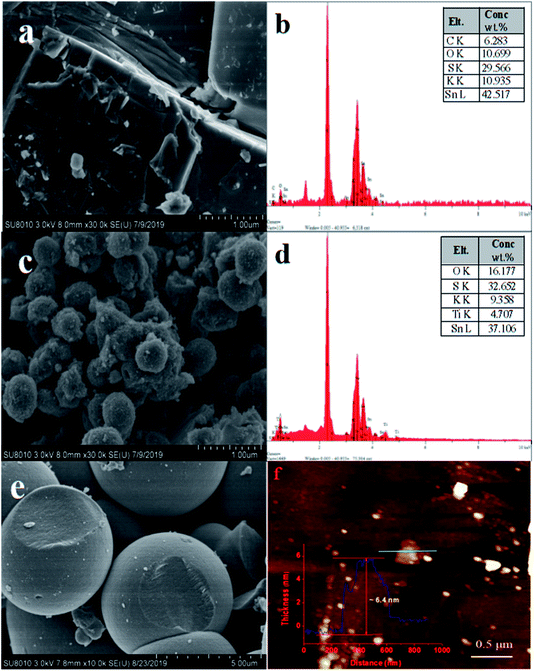
The HKTS nanosheets were prepared as reported previously,19 reacting tin powder, sulfur powder and potassium carbonate under solvothermal conditions in a Teflon-lined stainless autoclave. First, 6 mmol potassium carbonate (99%, Aladdin), 30 mmol sulfur powder (99%, Aladdin) and 9 mmol tin powder (99.5%, Aldrich, <150 mm) were soaked in hydrochloric acid (36–38%) for 1 min, and then 4 mL of deionized water, acting as a solvent, was added to the above mixture. The autoclave was put into an oven at 478 K for 15 h. Subsequently, the product was washed several times with absolute ethanol and deionized water until the scrubbing solution was clear and transparent. The solid composites were obtained by centrifugation and were dried in a vacuum oven at 338 K for 12 h. The average chemical formula of HKTS nanosheets was analyzed through the conservation of charge and energy-dispersive spectroscopy (EDS, Fig. 1(b)), which was denoted as H2.24K1.12Sn1.44S4.56 (X = 0.56).2.3. Exfoliation of HKTS nanosheets
The mono- or few-layered HKTS nanosheets were obtained by a liquid exfoliation method.27 The HKTS nanosheets were dispersed into anhydrous ethanol and cesium chloride solution was added as an expansion reagent. Then, the nanosheets were exfoliated by sonication for about 30 min. The products were collected by centrifugation, washing and drying. Finally, graphene-like nanosheets were obtained.2.4. Synthesis of HKTS-TiO2
HKTS/TiO2 composites were synthesized by a facile method. First, 1.0 g as-prepared HKTS was ultrasonically dissolved in 25 mL anhydrous ethanol. Then, 1 mL tetrabutyl titanate and 2 mL deionized water were added to the mixture solution for hydrolysis reaction with magnetic stirring for 1 h. After the reaction was complete, the mixture was centrifuged and the solid samples obtained were washed several times with deionized water. Following this, the composites were placed in an oven at 338 K for 6 h. Finally, composites with different Sn/Ti ratios were synthesized by adjusting the tetrabutyl titanate content, and composites with Sn/Ti ratios of 5![[thin space (1/6-em)]](https://www.rsc.org/images/entities/char_2009.gif) :
:![[thin space (1/6-em)]](https://www.rsc.org/images/entities/char_2009.gif) 1, 2
1, 2![[thin space (1/6-em)]](https://www.rsc.org/images/entities/char_2009.gif) :
:![[thin space (1/6-em)]](https://www.rsc.org/images/entities/char_2009.gif) 1, 1
1, 1![[thin space (1/6-em)]](https://www.rsc.org/images/entities/char_2009.gif) :
:![[thin space (1/6-em)]](https://www.rsc.org/images/entities/char_2009.gif) 1, 1
1, 1![[thin space (1/6-em)]](https://www.rsc.org/images/entities/char_2009.gif) :
:![[thin space (1/6-em)]](https://www.rsc.org/images/entities/char_2009.gif) 5, and 1
5, and 1![[thin space (1/6-em)]](https://www.rsc.org/images/entities/char_2009.gif) :
:![[thin space (1/6-em)]](https://www.rsc.org/images/entities/char_2009.gif) 10 were denoted as HKTS/TiO2-5.0, HKTS/TiO2-2.0, HKTS/TiO2-1.0, HKTS/TiO2-0.2, and HKTS/TiO2-0.1, respectively.
10 were denoted as HKTS/TiO2-5.0, HKTS/TiO2-2.0, HKTS/TiO2-1.0, HKTS/TiO2-0.2, and HKTS/TiO2-0.1, respectively.
2.5. Characterization
A transmission electron microscope (TEM; JEOL JEM-2100F, Japan) and a scanning electron microscope (SEM; Hitachi S-4800) were used to observe the morphology and crystal structure of the as-prepared materials. In conjunction with SEM, energy-dispersive spectroscopic (EDS) analyses were carried out to measure the atom species and weight percentage. X-ray diffraction (XRD) was performed using a diffractometer (Bruker AXS D8 Focus, Germany) with Cu Kα radiation to explore the crystalline phases of the solid samples. The scanning range was from 10° to 80°, and the scanning speed was 5° min−1. Raman spectra were investigated in the region from 50 to 600 cm−1 using a Raman spectrometer (Renishaw, InVia). A Fourier transform infrared spectrometer (FTIR), equipped with FTIR-Nicolet 6700 (Thermo Fisher Scientific), was scanned from 4000 to 500 cm−1. UV-visible diffuse reflectance spectra (UV-vis DRS) were recorded at room temperature using a Shimadzu UV-2550 spectrophotometer, in which BaSO4 powder was used as a reference. UV-vis absorption spectra of solution samples irradiated by visible light were recorded using a UV-vis spectrophotometer (Lambda 35, PerkinElmer). Photoluminescence (PL) spectra were recorded using a fluorescence spectrophotometer (HORIBA Jobin Yvon company). X-ray photoelectron spectroscopy (XPS, ThermoFisher Scientific, K-Alpha+) was conducted using an Al Kα X-ray source with normalized binding energies of C 1s peak at 284.8 eV. The Brunauer–Emmett–Teller (BET) specific surface area and pore-size distribution were measured using a volumetric gas sorption instrument (Mike 2020 HD88). The real amount of TiO2 loaded on the HKTS sheets were determined using an inductively coupled plasma optical emission spectrometer (ICP-OES, PE, ICP8000). Atomic force microscope images (AFM) were obtained to measure the height of the exfoliated HKTS nanosheets.2.6. Photocatalytic degradation experiments
In photocatalytic degradation experiments, RhB was used as a target organic pollutant to evaluate the photocatalytic performance of HKTS/TiO2 composites. A 300 W xenon lamp was used to simulate visible light in which a filter was placed to cut off 420 nm wavelengths. The light luminated vertically was 10 cm higher than that of the reaction solution. In a glass vessel equipped with a water-cooling system, 10 mg of photocatalyst was dispersed in 50 mL RhB solution (20 mg L−1) and magnetically stirred. Before the light irradiation, the suspensions were stirred in the dark for 30 min to establish the adsorption–desorption equilibrium. Then, the lamp was turned on and the photocatalytic reaction was performed. In the process of the reaction, 5 mL liquid sample was collected every 10 min and then centrifuged at 1000 rpm for 3 min. The upper supernatant was taken to test the concentration of RhB using a UV-vis absorption spectrophotometer. Compared with HKTS/TiO2, the photocatalytic performances of pure TiO2 and HKTS were tested under the same conditions.2.7. Photocatalyst reusability experiments
In reusability experiments, the photocatalyst was recycled and then washed with anhydrous ethanol and deionized water for the second photocatalytic degradation experiment. Recycle experiments were conducted 3 times, in which the concentration of RhB was recorded to evaluate the reusability of the HKTS/TiO2.3. Results and discussion
3.1. Crystal structure and morphology
The SEM and the corresponding EDS images of layered HKTS, pure TiO2 and HKTS/TiO2-1.0 composites are depicted in Fig. 1. As shown in Fig. 1(a), for HKTS, many nanosheets are stacked to form the layered structure with a large ultrathin surface area. Its corresponding EDS spectrum is depicted in Fig. 1(b), from which the chemical formula of HKTS can be obtained. Pure TiO2 [Fig. 1(e)], shaped like spherical microparticles, can be seen clearly with a diameter of 4 μm. There are nanospheres on the surface of HKTS/TiO2-1.0 [Fig. 1(c)], whose morphology are the same with pure TiO2 in Fig. 1(e), suggesting that TiO2 dispersed successfully on the surface of layered HKTS. However, the diameter is decreased to 500 nm, which may be ascribed to the limitation of HKTS. The corresponding EDS spectrum of HKTS/TiO2-1.0 is presented in Fig. 1(d), demonstrating that O, Ti, S, K and Sn simultaneously exist in HKTS/TiO2-1.0 composites. The contents of Sn and Ti were about 37.1% and 4.7%, respectively, which indicate that the ratio of Sn to Ti is about 3![[thin space (1/6-em)]](https://www.rsc.org/images/entities/char_2009.gif) :
:![[thin space (1/6-em)]](https://www.rsc.org/images/entities/char_2009.gif) 1 rather than 1
1 rather than 1![[thin space (1/6-em)]](https://www.rsc.org/images/entities/char_2009.gif) :
:![[thin space (1/6-em)]](https://www.rsc.org/images/entities/char_2009.gif) 1, derived from the fact that the result of the corresponding EDS spectrum is only on behalf of the partial constituents of HKTS/TiO2-1.0 composites. Therefore, ICP-OES was conducted to determine the real TiO2 amount loaded on HKTS nanosheets, and the results are displayed in Table 1.
1, derived from the fact that the result of the corresponding EDS spectrum is only on behalf of the partial constituents of HKTS/TiO2-1.0 composites. Therefore, ICP-OES was conducted to determine the real TiO2 amount loaded on HKTS nanosheets, and the results are displayed in Table 1.
| Samples | Element concentrations (mg L−1) | |
|---|---|---|
| Sn | Ti | |
| HKTS/TiO2-5.0 | 375 | 29 |
| HKTS/TiO2-2.0 | 277 | 56 |
| HKTS/TiO2-1.0 | 157 | 63 |
| HKTS/TiO2-0.2 | 58.5 | 116 |
| HKTS/TiO2-0.1 | 54.1 | 216 |
Table 1 depicted the Sn and Ti concentrations of HKTS/TiO2 over different Sn/Ti ratios, and the real content of TiO2 loaded on HKTS was just as much as the amount added.
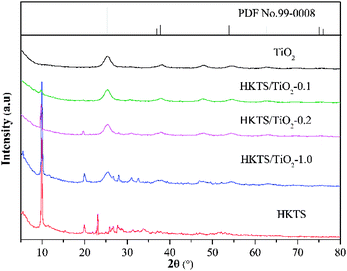
Furthermore, AFM images of HKTS nanosheets after liquid exfoliation were obtained, and they are depicted in Fig. 1(f). Actually, the height profile of HKTS nanosheets was acquired through tapping-mode. It can be seen that the thickness is about 6.4 nm. However, the thickness calculated by this method was higher than that of the real height because of the absorption of solvent molecules when exfoliated in the liquid.28 The crystal structure and the composition of the solid samples were explored by XRD. Fig. 2 shows the phase patterns of pure TiO2, HKTS and HKTS/TiO2 composites. For HKTS, the dominant diffraction peaks appeared at 2θ = 9.8° and 19.9°, which could be attributed to the (020) and (040) planes,25 respectively. The phase of pure TiO2 is anatase (JCPDS no. 99-0008), whose peaks are located at 25.3°, 37.7°, 48°, 53.8°, 62.6° and 75°, corresponding to the (101), (004), (200), (105), (204) and (215) planes. These typical peaks of TiO2 can also be observed in TiO2-containing composites, conforming to the conclusion that TiO2 was indeed decorated on the surface of HKTS. What is worth mentioning is that with the content of TiO2 in HKTS/TiO2 increased and the peak located at 9.8° and 19.9° decreased, which was due to the decorated TiO2 on the surface of HKTS nanosheets.
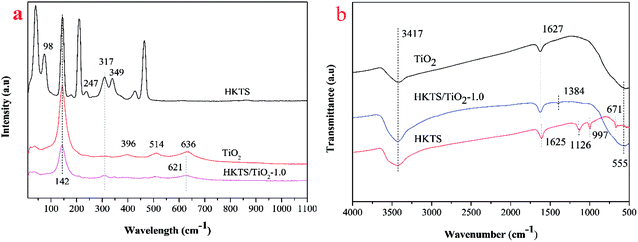
In order to characterize the chemical structure of pure TiO2, HKTS and HKTS/TiO2-1.0, Raman spectra were obtained. As shown in Fig. 3(a), pure TiO2 had typical peaks at 142 cm−1, 396 cm−1, 514 cm−1, and 636 cm−1, corresponding to the Eg(1), B1g(1), A1g + B1g and Eg(2) vibration modes, respectively,29 which indicated that the phase of TiO2 is anatase. As for HKTS, the peaks at 317 cm−1 and 349 cm−1 are attributed to the Sn–S bending vibration in the [SnS6] octahedron and the peak at 381 cm−1 is assigned to the Sn–S bending vibration in the [SnS4] tetrahedron.30 Vibrations at 98 cm−1 and 247 cm−1 may be attributed to potassium ions and hydrogen ions, revealing that potassium and hydrogen were both involved in the structure of HKTS.31 Other sharp bonds may be ascribed to collective lattice vibrations. HKTS/TiO2-1.0 possesses peaks of both HKTS and TiO2, which proved that TiO2 was successfully decorated on the surface of HKTS nanosheets. Furthermore, the new peak of HKTS/TiO2-1.0 at 621 cm−1 confirmed the tight combination between HKTS and TiO2.32
The FTIR spectral images of pure TiO2, HKTS and HKTS/TiO2-1.0 are shown in Fig. 3(b), from which the bonding structures and the functional groups can be learned. As can be seen, all of the samples have a strong absorption peak at 3417 cm−1, which is considered the O–H stretching vibration of the hydroxyl groups or proton bonding.33 The H–O–H bending vibration from H2O absorbed on the surface of samples accounts for the absorption peak at 1627 cm−1.33 Besides, the broad vibration peak at around 555 cm−1 can be seen in both TiO2 and HKTS/TiO2-1.0, which could be attributed to Ti–O–Ti bonds.34 Absorption peaks at 1125 cm−1, 997 cm−1 and 671 cm−1 are typical to HKTS, corresponding to the K–S bending vibration.35 What is more, there is a new peak in HKTS/TiO2-1.0 at 1384 cm−1, which may arise from the interaction between TiO2 and HKTS in the composites,36 suggesting that TiO2 combined with HKTS sheets through chemical bonds.
In order to further inquiry the interactions between HKTS and TiO2 and the chemical states of HKTS/TiO2, XPS measurements were conducted. As shown in Fig. 4(a), the full spectrum revealed that there are Sn, S, Ti, and O elements in HKTS/TiO2 composites. In Fig. 4(d), two peaks can be observed at 464.45 eV and 458.69 eV, respectively, in accordance with Ti 2p1/2 and Ti 2p3/2. The separation binding energy is about 5.76 eV, which elaborates a normal state of Ti4+ in TiO2 (ref. 37) O 1s at 529.9 eV in HKTS/TiO2 composites attributed to the Ti–O band.38 In Fig. 4(b), the binding energies of Sn 3d3/2 (494.5 eV) and Sn 3d5/2 (486.1 eV) of HKTS indicate that the chemical state of Sn is Sn4+.39 However, the binding energies of Sn 3d3/2 and Sn 3d5/2 of HKTS/TiO2 shifted about 0.5 eV to the lower energy direction. The shift of the peaks ascribed to the heterostructure effort between TiO2 and HKTS nanosheets.40 S 2p1/2 (162.2 eV) and S 2p3/2 (160.9 eV) in Fig. 4(c) indicate the existence of divalent sulfide ions in HKTS. Compared with that of HKTS, a new peak appears in HKTS/TiO2 composites at around 162.8 eV. This phenomenon could further prove a special chemical bond, rather than a physical contact between TiO2 and HKTS nanosheets in HKTS/TiO2 composites.37
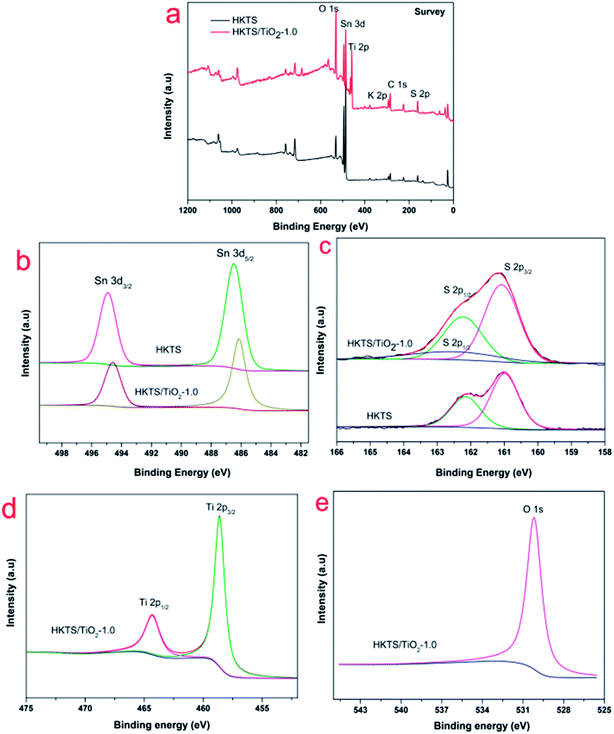 | ||
| Fig. 4 XPS spectra of HKTS/TiO2 and HKTS: (a) full scan; high-resolution XPS spectra of (b) Sn; (c) S; (d) Ti; (e) O. | ||
The nitrogen adsorption–desorption isotherms and pore-size distribution plots of pure TiO2, HKTS and HKTS/TiO2-1.0 are displayed in Fig. 5, from which the surface areas and pore size can be analyzed. As can be seen, the isotherm of HKTS is IV type with a hysteresis loop at a relative pressure (P/P0) between 0.4 and 1.0, which demonstrates the existence of mesopores.41 The surface area of HKTS is about 3.21 m2 g−1. The surface area of HKTS/TiO2-1.0 sharply increased compared with that of TiO2, which facilitates the adsorption ability for dye pollutants to improve the photocatalytic performance.
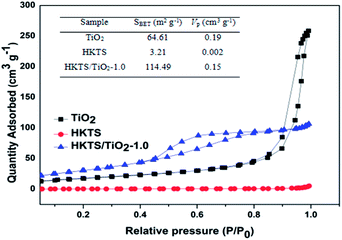 | ||
| Fig. 5 N2 adsorption–desorption isotherms and pore size distribution curves (inset) of pure Ti O2, HKTS and HKTS/TiO2-1.0. | ||
3.2. Optical properties
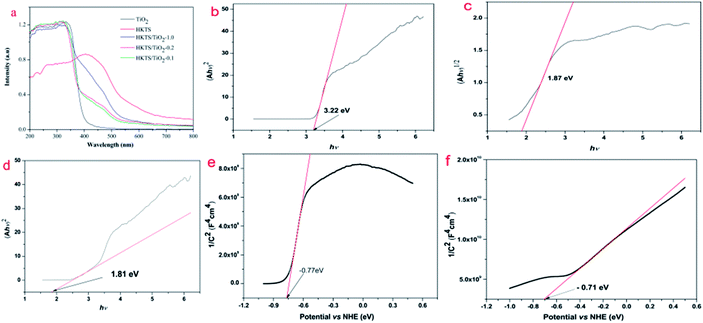
The optical property of HKTS/TiO2 was determined by UV-vis diffuse reflectance spectra with TiO2 and HKTS as comparison. As shown in Fig. 6(a), pure TiO2 display a good light absorption performance in the region from 200 nm to 400 nm and nearly no absorption in the visible region, coinciding with the fact that TiO2 can only respond to the ultraviolet light. The absorption region of HKTS includes both UV and visible light, ranging from 200 nm to 800 nm. The optical adsorption edges of TiO2 and HKTS were found to be 400 nm and 585 nm, respectively. In comparison with TiO2, which could only be excited by UV light, HKTS can be generated under visible light irradiation. Compared with TiO2, the visible light absorption spectrum of HKTS/TiO2 composites displays an obvious red shift and the absorption intensity was enhanced. The optical adsorption edge sequence of HKTS/TiO2 composites is as follows: HKTS/TiO2-1.0 > HKTS/TiO2-0.2 > HKTS/TiO2-0.1, which was consistent with the photocatalysis activity under visible light irradiation. These results proved that the participation of HKTS is beneficial for the visible light absorption. To deeply prove that HKTS help extend the response region of TiO2 from UV to visible light, the band gaps of HKTS, TiO2 and HKTS-TiO2-1.0 composites were calculated using the following formula:42| (αhν)1/n = A(hν − Eg). | (1) |
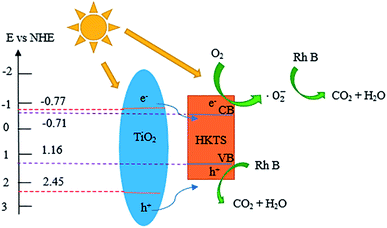
The Mott–Schottky curves were measured to estimate the conduction band (CB) of TiO2 and HKTS, and the results are displayed in Fig. 6(e and f). The CB of TiO2 and HKTS are −0.77 eV and −0.71 eV, respectively. Thus, according to the empirical formula EVB = ECB + Eg,45,46 the VB of TiO2 (2.45 eV) and HKTS (1.16 eV) can be obtained.
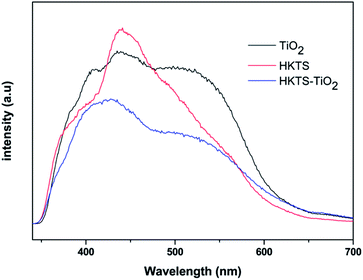
The PL spectra of pure TiO2, HKTS and HKTS/TiO2-1.0 were obtained to confirm the separation efficiency of photoexcited electrons and holes. It is well known that the PL intensity increased with the increase in the recombination rate of electrons and holes. From Fig. 7, we can see clearly that the intensity of HKTS/TiO2-1.0 composites is lower than that of either TiO2 or HKTS in the range of 350 nm to 700 nm. HKTS/TiO2-1.0 exhibits the lowest intensity, indicating the most efficient charge carrier separation rate, which helps suppress the recombination of electrons and holes.
3.3. Photocatalytic degradation measurements
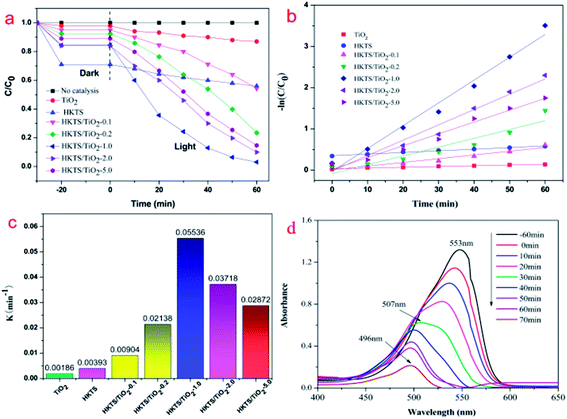
To evaluate the photocatalytic property of HKTS/TiO2 composites, photocatalytic degradation experiments of RhB were conducted under visible light irradiation. As shown in Fig. 8(a), an RhB degradation experiment with no photocatalyst was carried out to eliminate the influence of its self-degradation. The adsorption capacity and the photocatalytic performance of pure commercial TiO2 were both low. Among all the photocatalysts, HKTS materials showed the highest adsorption capacity, of which 29% of RhB were absorbed in 10 min, but the photocatalytic property was unsatisfying. Compared with HKTS, the adsorption–desorption equilibrium of RhB was also established in 10 min, but the adsorption ability decreased, when TiO2 were added to HKTS, which could be resulting from the reduced adsorption points on the HKTS surface because of the existence of TiO2. However, under the same condition, HKTS/TiO2 exhibited better photocatalytic properties than pure TiO2 and HKTS. As for HKTS/TiO2 photocatalysts, the photocatalytic performance sequence is as follows: HKTS/TiO2-1.0 > HKTS/TiO2-2.0 > HKTS/TiO2-5.0 > HKTS/TiO2-0.2 > HKTS/TiO2-0.1. The degradation rate of RhB over HKTS/TiO2-0.1, HKTS/TiO2-0.2, HKTS/TiO2-2.0 and HKTS/TiO2-5.0 were 46.7%, 77.5%, 90% and 85.3%, respectively, while HKTS/TiO2-1.0 showed the highest photocatalytic performance with approximately 97.9% RhB removed in 60 min. The photocatalytic degradation process was conducted on the interface of the composites, and it consists of two steps: RhB were first absorbed and then degraded under visible light irradiation. Thus, the excellent adsorption is of great importance to optimize the photocatalytic activity.As illustrated in Fig. 8(b), −ln(C/C0) was in proportion to the irradiation time, demonstrating that the degradation progress of RhB fitted the first-order kinetic model (C0 is the initial concentration of RhB, C is the concentration of residual RhB, k is the degradation rate constant, and t is the irradiation time, respectively).
The constants of all catalysts are displayed in Fig. 8(c). HKTS/TiO2-1.0 (k = 0.05536) has the highest degradation rate constant, which is 14 times higher than that of HKTS materials (k = 0.00393) and 29 times higher than that of pure TiO2 (k = 0.00186). For HKTS/TiO2-2.0 and HKTS/TiO2-5.0, the constants were 0.03718 and 0.02872, respectively, which were a little higher but still lower than those of HKTS/TiO2-1.0. Fig. 8(d) depicts the UV-vis absorption spectra of RhB over HKTS/TiO2-1.0. The absorption intensity decreased as the irradiation time increased, suggesting that the concentration of RhB decreased. Moreover, the absorption peak shifted from 553 nm to 496 nm, causing a blue-shift. The phenomenon can be assigned to the generation of some N-de-ethylated intermediates in the degradation process. These N-de-ethylated intermediates were further decomposed into smaller molecular fragments until the structure of RhB was totally decomposed.47
3.4. Reusability and stability experiments
The reusability and stability of photocatalysts are extremely important index to evaluate. For this, photocatalytic cycle experiments were conducted to test the stability of HKTS/TiO2-1.0. As illustrated in Fig. 9(a), the photocatalytic activity of HKTS/TiO2-1.0 could remain extremely effective after three cycles, in spite of a slight decrease from 97.9% to 95.7%. The photocatalytic activity was seldom decreased compared to the original one, which confirms that the reusability and stability of HKTS/TiO2-1.0 are totally good. Besides, the XRD pattern of HKTS/TiO2-1.0 after three cycles in Fig. 9(b) was the same as the one used before, supporting the idea that the structure of the photocatalyst was not changed.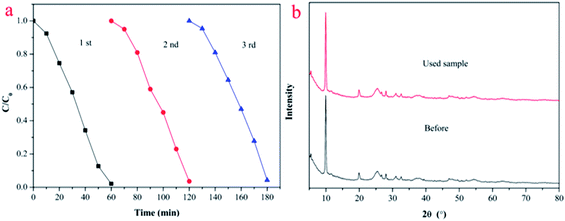 | ||
| Fig. 9 (a) Reusability of HKTS/TiO2-1.0 after three runs. (b) XRD patterns of HKTS/TiO2-1.0 before and after three runs. | ||
3.5. Photocatalytic mechanism studies
In order to elucidate the photocatalytic mechanism of RhB degradation, an array of active species trapping experiments over HKTS/TiO2-1.0 were performed. In these experiments, K2Cr2O7, disodium ethylenediaminetetraacetate (EDTA-2Na), tert-butyl alcohol (TBA), and dissolved N2 acted as scavengers for the species of e−, h+, ·OH, and ·O2−, respectively. Besides, an experiment with no scavenger was also conducted as a comparison. As shown in Fig. 10, the degradation activity was badly hindered in the presence of N2 and EDTA-2Na, which supported the idea that ·O2− and h+ played a dominate role in photocatalytic degradation. The photocatalytic ability was slightly weakened with the addition of TBA, indicating that ·OH seldom influences the photocatalytic process. When K2Cr2O7 was added, still 41.1% RhB degraded and further indicated that h+ was another active species except ·O2−.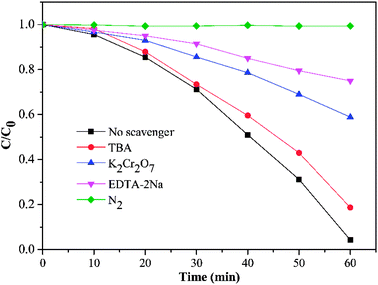 | ||
| Fig. 10 Effect of four different scavengers on degradation of RhB using HKTS/TiO2-1.0 as a photocatalyst (K2Cr2O7 and EDTA-2Na dosage is 0.1 g, and TBA dosage is 2 mL). | ||
Based on the experiment results and all the characterizations, a rational photocatalytic degradation mechanism of RhB under visible light over HKTS/TiO2 composites was proposed. The following are major reactions of the photocatalytic degradation.
| HKTS/TiO2 + hν → e− + h+, | (2) |
| e− + O2 → ·O2−, | (3) |
| ·O2−/h+ + RhB → CO2 + H2O. | (4) |
As depicted in Fig. 11, the photoinduced electrons (e−) in valence band (VB) of HKTS and TiO2 are excited and transferred to conduction band (CB) under visible light irradiation, generating holes (h+) in VB [eqn (2)]. As estimated, for TiO2, the ECB and EVB are −0.77 eV and 2.45 eV, respectively, while for HKTS, they are −0.71 eV and 1.16 eV, respectively. Therefore, the CB level of TiO2 is more negative than that of HKTS, while the VB level of TiO2 is more positive than that of HKTS. The electrons in TiO2 migrate to HKTS and holes in TiO2 migrate to HKTS on account of the potential difference. Thus, e− and h+ are separated effectively. The ECB of TiO2 is more negative than E0 (O2/·O2−) (−0.046 eV),48,49 so O2 dissolved on the surface of composites are reduced to ·O2− by e− on CB of the HKTS [eqn (3)]. Meanwhile, the EVB of HKTS is lower than E0 (·OH/H2O) (+2.68 eV),43,46,50 so h+ on VB of HKTS oxidizes RhB to CO2 and H2O directly [eqn (4)]. Finally, the ·O2− and h+ act as the main active species to decompose RhB.
4. Conclusion
In conclusion, a new kind of HKTS-TiO2 composite with excellent photocatalytic activity has been successfully synthesized and applied in RhB photocatalytic degradation. A series of characterization experiments proved that TiO2 was loaded on the surface of the layered HKTS nanosheets. In comparison with pure TiO2 and HKTS, HKTS-TiO2 composites were of enhanced RhB photocatalytic degradation performance under visible light irradiation, which attributed to high separation efficiency of photoinduced electron–hole pairs and the effect of the improvement on light-harvesting ability. Besides, ·O2− and h+ were tested to play a dominate role in RhB photocatalytic degradation. Most importantly, the reusability of HKTS-TiO2 was highly superior, so that it can be used several times with the performance degradation rate just decreased from 97.9% to 95.7%. This work provides insights into the degradation treatment of RhB and other organic dye waste water over the HKTS/TiO2 photocatalyst. Moreover, it could serve as a reference for the potential application of thiostannate.Conflicts of interest
There are no conflicts to declare.Acknowledgements
This work was supported by the National High Technology Research and Development Program of China (863 Program) (No. 2012AA063504), the National Science Foundation of China (No. U1407116, 21511130020, 21276193), and the Tianjin Municipal Natural Science Foundation (No. 13JCZDJC35600).References
- A. Houas, H. Lachheb, M. Ksibi, E. Elaloui, C. Guillard and J. Herrmann, Appl. Catal., B, 2001, 31, 145–157 CrossRef CAS.
- Y. Wu, Z. Liu, Y. Li, J. Chen, X. Zhu and P. Na, Chin. J. Catal., 2019, 40, 60–69 CrossRef CAS.
- M. Kapilashrami, Y. Zhang, Y. Liu, A. Hagfeldt, J. Guo, V. Teknisk-naturvetenskapliga, F. K. Å. Institutionen, U. Uppsala, S. Kemiska and K. Fysikalisk, Chem. Rev., 2014, 114, 9662–9707 CrossRef CAS PubMed.
- B. Dai, H. Tao, Y. Lin and C. Chang, Nano, 2016, 11, 1650106 CrossRef CAS.
- S. Ghosh, N. A. Kouame, S. Remita, L. Ramos, F. Goubard, P. Aubert, A. Dazzi, A. Deniset-Besseau and H. Remita, Sci. Rep., 2016, 5, 18002 CrossRef PubMed.
- J. Lei, Y. Chen, L. Wang, Y. Liu and J. Zhang, J. Mater. Sci., 2015, 50, 3467–3476 CrossRef CAS.
- A. Bumajdad, M. Madkour, Y. Abdel-Moneam and M. El-Kemary, J. Mater. Sci., 2014, 49, 1743–1754 CrossRef CAS.
- Y. Liu, T. Cai, L. Wang, S. Zhang, G. Zhang and X. Xia, Nano, 2017, 12, 1750076 CrossRef CAS.
- M. I. Litter, Appl. Catal., B, 1999, 23, 89–114 CrossRef CAS.
- Y. Zhang, Z. Jiang, J. Huang, L. Y. Lin and Z. Chen, RSC Adv., 2015, 5, 79479 RSC.
- D. Yang, H. Liu, Z. Zheng, Y. Yuan, J. Zhao, E. R. Waclawik, X. Ke and H. Zhu, J. Am. Chem. Soc., 2009, 131, 17885–17893 CrossRef CAS PubMed.
- J. Cai, J. Shen, X. Zhang, Y. H. Ng, J. Huang, W. Guo, C. Lin and Y. Lai, Small Methods, 2019, 3, 1800184 CrossRef.
- M. Ge, Q. Li, C. Cao, J. Huang, S. Li, S. Zhang, Z. Chen, K. Zhang, S. S. Al-Deyab and Y. Lai, Adv. Sci., 2017, 4, 1600152 CrossRef PubMed.
- M. Ge, C. Cao, J. Huang, S. Li, Z. Chen, K. Zhang, S. S. Al-Deyab and Y. Lai, J. Mater. Chem. A, 2016, 4, 6681–6772 Search PubMed.
- M. Z. Ge, C. Y. Cao, J. Y. Huang, S. H. Li, S. N. Zhang, S. Deng and Q. S. Li, Nanotechnol. Rev., 2016, 5, 75 CAS.
- J. Qiu, X. Li, X. Gao, X. Gan, B. Weng, L. Li, Z. Yuan, Z. Shi and Y. Hwang, J. Mater. Chem., 2012, 22, 23411 RSC.
- H. G. Yang, C. H. Sun, S. Z. Qiao, J. Zou, G. Liu, S. C. Smith, H. M. Cheng and G. Q. Lu, Nature, 2008, 453, 638–641 CrossRef CAS PubMed.
- P. Ilanchezhiyan, G. M. Kumar, C. Siva, G. D. Venkatasubbu, T. W. Kang and D. Y. Kim, Appl. Surf. Sci., 2019, 489, 943–951 CrossRef CAS.
- L. K. Dhandole, M. A. Mahadik, H. Chung, W. Chae, M. Cho and J. S. Jang, Appl. Surf. Sci., 2019, 490, 18–29 CrossRef CAS.
- N. S. Chaudhari, A. P. Bhirud, R. S. Sonawane, L. K. Nikam, S. S. Warule, V. H. Rane and B. B. Kale, Green Chem., 2011, 13, 2500 RSC.
- C. Yao, B. Wei, L. Meng, H. Li, Q. Gong, H. Sun, H. Ma and X. Hu, J. Power Sources, 2012, 207, 222–228 CrossRef CAS.
- T. Zhai, X. Fang, Y. Bando, Q. Liao, X. Xu, H. Zeng, Y. Ma, J. Yao and D. Golberg, ACS Nano, 2009, 3, 949–959 CrossRef CAS PubMed.
- G. Li, R. Su, J. Rao, J. Wu, P. Rudolf, G. R. Blake, R. A. de Groot, F. Besenbacher and T. T. M. Palstra, J. Mater. Chem. A, 2016, 4, 209–216 RSC.
- W. Zhou, Z. Yin, Y. Du, X. Huang, Z. Zeng, Z. Fan, H. Liu, J. Wang and H. Zhang, Small, 2013, 9, 140 CrossRef CAS PubMed.
- D. Sarma, C. D. Malliakas, K. S. Subrahmanyam, S. M. Islam and M. G. Kanatzidis, Chem. Sci., 2016, 7, 1121 RSC.
- M. J. Manos, K. Chrissafis and M. G. Kanatzidis, J. Am. Chem. Soc., 2006, 128, 8875 CrossRef CAS PubMed.
- X. Gu, Y. Zhao, K. Sun, C. L. Z. Vieira, Z. Jia, C. Cui, Z. Wang, A. Walsh and S. Huang, Ultrason. Sonochem., 2019, 58, 104630 CrossRef PubMed.
- P. Jiang, J. Jing, Y. Wang, H. Li, X. He, Y. Chen and W. Liu, J. Alloys Compd., 2020, 812, 152114 CrossRef CAS.
- S. Zhu, Y. Dong, X. Xia, X. Liu and H. Li, RSC Adv., 2016, 6, 23809–23815 RSC.
- R. G. Iyer and M. G. Kanatzidis, Inorg. Chem., 2002, 41, 3605–3607 CrossRef CAS PubMed.
- D. J. Jones, J. Roziere, J. Tomkinson and J. Penfold, J. Mol. Struct., 1989, 197, 113–121 CrossRef CAS.
- X. Zhang, P. Zhang, L. Wang, H. Gao and J. Zhao, Appl. Catal., B, 2016, 192, 17–25 CrossRef CAS.
- H. M. Jeffrey, D. G. Eric, W. S. Richard, H. I. Nathan, C. A. Richard, C. Jun, M. M. Evgeniy, D. A. Michael, J. A. Mark and J. D. Kenneth, Science, 2005, 308, 1765–1769 CrossRef PubMed.
- K. Zhou, Y. Zhu, X. Yang, X. Jiang and C. Li, New J. Chem., 2011, 35, 353–359 RSC.
- N. Ding and M. G. Kanatzidis, Nat. Chem., 2010, 2, 187 CrossRef CAS.
- F. Yang, G. Han, D. Fu and Z. Liu, Mater. Lett., 2013, 99, 24–27 CrossRef CAS.
- L. Deng, H. Liu, X. Gao, X. Su and Z. Zhu, Ceram. Int., 2016, 42, 3808–3815 CrossRef CAS.
- C. Hu, L. E, K. Hu, L. Lai, D. Zhao, W. Zhao and H. Rong, J. Mater. Sci., 2020, 55, 151–162 CrossRef CAS.
- P. Ilanchezhiyan, G. M. Kumar, C. Siva, G. D. Venkatasubbu, T. W. Kang and D. Y. Kim, Appl. Surf. Sci., 2019, 489, 943–951 CrossRef CAS.
- W. Zhou, Z. Yin, Y. Du, X. Huang, Z. Zeng, Z. Fan, H. Liu, J. Wang and H. Zhang, Small, 2013, 9, 140–147 CrossRef CAS.
- H. Liu, Y. Su, P. Chen and Y. Wang, J. Mol. Catal. A: Chem., 2013, 378, 285–292 CrossRef CAS.
- C. Liu, L. Wang, Y. Tang, S. Luo, Y. Liu, S. Zhang, Y. Zeng and Y. Xu, Appl. Catal., B, 2015, 164, 1–9 CrossRef CAS.
- Y. Song, Y. Lei, H. Xu, C. Wang, J. Yan, H. Zhao, Y. Xu, J. Xia, S. Yin and H. Li, Dalton Trans., 2015, 44, 357–366 Search PubMed.
- S. Gedi, V. R. Minnam Reddy, S. Alhammadi, P. Reddy Guddeti, T. R. R. Kotte, C. Park and W. K. Kim, Sol. Energy, 2019, 184, 305–314 CrossRef CAS.
- X. Zhang, L. Zhang, T. Xie and D. Wang, J. Phys. Chem. C, 2009, 113, 7371–7378 CrossRef CAS.
- R. Tang, H. Su, Y. Sun, X. Zhang, L. Li, C. Liu, S. Zeng and D. Sun, J. Colloid Interface Sci., 2016, 466, 388–399 CrossRef CAS PubMed.
- Y. Wu, Z. Liu, Y. Li, J. Chen, X. Zhu and P. Na, Chin. J. Catal., 2019, 40, 60–69 CrossRef CAS.
- J. Gao, C. Liu, F. Wang, L. Jia, K. Duan and T. Liu, Nanoscale Res. Lett., 2017, 12, 1750076 Search PubMed.
- L. Ye, J. Liu, C. Gong, L. Tian, T. Peng and L. Zan, ACS Catal., 2012, 2, 1677–1683 CrossRef CAS.
- Q. Ma, H. Zhang, Y. Cui, X. Deng, R. Guo, X. Cheng, M. Xie and Q. Cheng, J. Ind. Eng. Chem., 2018, 57, 181–187 CrossRef CAS.
| This journal is © The Royal Society of Chemistry 2020 |

