 Open Access Article
Biodegradation of carbon tetrachloride from groundwater in an upflow solid-phase biofilm system
Benhua Liu *a,
Hao Zhana,
Xuchun Lua,
Yiran Liub,
Linxian Huanga and
Zhengrun Weic
aSchool of Water Conservancy and Environment, University of Jinan, Jinan 250022, PR China. E-mail: liubenhua272678@126.com; Tel: +86 531 8276 9035
bSchool of Water Resources and Environment, China University of Geosciences (Beijing), Beijing 100083, PR China
cShandong Institute of Geological Survey, Jinan, 250013, PR China
First published on 19th February 2020
Abstract
In the present study, an upflow solid-phase denitrification biofilm reactor (US-DBR) was applied for simultaneous carbon tetrachloride (CT) and nitrate removal from groundwater by using poly(butylene succinate) (PBS) as carbon source and biocarrier. After 80 days continuous operation, the nitrate and CT removal efficiencies in the biofilm reactor were high of 98% and 94.3%, respectively. After PBS-biofilm formation, protein (PN) content in loosely bound extracellular polymeric substances (LB-EPS) and tightly bound EPS (TB-EPS) significantly increased 2.6 and 4.0 times higher in the presence of CT than those of absence of CT, while PS increased 1.9 and 2.0 times higher. According to excitation-emission matrix (EEM), CT exposure contributed to the increased fluorescent intensities of the aromatic PN-like and tryptophan PN-like substances. Along with the height of US-DBR, the denitrification activity was inhibited by the CT exposure, and most of CT was significant transformed accompanied by nitrate removal. Two components of soluble microbial products (SMP) were identified, including humic-like substances for component 1 and PN-like substances for component 2, respectively. It was found from high-throughput 16S rRNA gene sequencing analysis that significant differences were observed at genus level by taxonomic assignments to CT exposure. Thiobacillus, Thauera, Candidatus_Competibacter and Hydrogenophaga were the main genus in the presence of CT at the proportion of 6.77%, 5.47%, 3.59% and 3.17%, respectively.
1. Introduction
With the development of global economy, a wide range of organic compounds are applied in chemical and industrial production processes. As an important chlorinated organic solvent, carbon tetrachloride (CT) has been widespread applied as a pesticide, refrigerant, and aerosol propellant in chemical industries.1 In the past decade, the improper disposal and emission of CT has led to significant contamination in soil and groundwater sites worldwide.2 However, CT is difficult to be eliminated in groundwater through self-purification, which is of great concern as a significant environmental problem for healthy drinking water.3 The CT concentration in the Environmental Protection Agency's (EPA) drinking water standard is only 5 μg L−1.In the recent years, many physicochemical methods have been developed for CT treatment from groundwater, such as sorption, air stripping, advanced oxidation and zero-valent iron reduction etc.4–8 In comparation to physicochemical methods, CT bioremediation under anoxic or anaerobic conditions is one of high-efficiency and cost-effective methods for completely transforming CT into harmless end products.9 CT has been anaerobic biotransformed under sulfate-reducing, methanogenic, nitrate-reducing, iron-reducing, fermenting, and mixed electron acceptor conditions.10 M. F. Azizian11 et al. reported that the simultaneous anaerobic transformation of tetrachloroethene (PCE) and CT in a continuous flow column that was bioaugmented with the Evanite culture (EV). Additionally, CT biodegradation under denitrification conditions is of particular interest because of the simultaneous occurrence of both CT and nitrate in groundwater.12
However, groundwater has limited carbon source for biological denitrification to achieve simultaneous CT and nitrate removal. Hence, liquid carbon sources, such as ethanol, glucose, acetate, and methanol etc., is commonly applied to denitrification for treating various nitrate containing wastewaters, bringing in the problems of complex operation, high-cost, and secondary pollution of effluent quality.13 As a novel type of heterotrophic biological denitrification process, solid-phase denitrification has been alternatively drawn researchers' attention for nitrate removal by using biodegradable polymers as biofilm carrier and carbon source.14,15 Shen et al.16 reported the biological denitrification using cross-linked starch/PCL blends as solid carbon source and biofilm carrier, finding that more than 90% NO3−–N was removed with the denitrification rate at 26.86 mg NO3−–N/(L h). Moreover, solid-phase denitrification biofilm has more stability and toxicity degradation capacity than that of sludge system. A number of studies has been focused on CT biodegradation under nitrate reduction environment. The occurrence of reductive transformations of CT in groundwater is related to both the electron donor (acetate) and electron acceptor (nitrate).17 Therefore, it is expected that the simultaneous degradation of nitrate and CT in a solid-phase denitrification reactor under an anoxic environment. However, little information could be found regarding to this point.
Herein, the feasibility of simultaneous CT and nitrate treatment in an upflow solid-phase denitrification biofilm reactor (US-DBR) was investigated in the present study. To evaluate the biofilm formation performance, the variations of loosely bound extracellular polymeric substances (LB-EPS) and tightly bound EPS (TB-EPS) were qualitatively and quantitatively analyzed in the absence and presence of CT by using chemical and spectroscopic approaches. The production of soluble microbial products (SMP) was evaluated under the steady stage of reactor via excitation emission matrix (EEM) fluorescence spectroscopy combined with parallel factor analysis (PARAFAC). The microbial community in the absence and presence of CT in an US-DBR were investigated by using 16S rDNA amplicon sequencing. The obtained result could provide a novel approach for simultaneous organic matter and nitrate treatment from groundwater via biofilm system.
2. Methods and materials
2.1. Upflow solid-phase denitrification biofilm reactor
An upflow solid-phase denitrification biofilm reactor (US-DBR) was used in the present study. The working volume of the reactor was 3.46 L with the inner diameter and height of 7 and 90 cm, respectively. The US-DBR was filled with 80 cm PBS granules as solid carbon source and biofilm carrier for simultaneous biological denitrification and CT degradation. The diameter and height of each PBS carrier were 3 and 5 mm, respectively. Influent groundwater was introduced from a prepared water tank (60 L) into the bottom of the US-DBR through a peristaltic pump. After each groundwater distribution, 10 minutes of nitrogen aeration was carried out to remove the dissolved oxygen (DO) in the water tank, and the reactor was kept in a state of anoxic condition during whole operation. The reactor had a total of 9 sampling ports in every 10 cm height. The hydraulic retention time (HRT) of the reactor was at 8 h through controlling the influent water flow rate. The operation of the whole reactor was controlled at room temperature (25–28 °C).2.2. Groundwater quality and seed sludge
Seed sludge was obtained from an anoxic tank in a municipal wastewater treatment plant (WWTP) with treatment capacity of 50![[thin space (1/6-em)]](https://www.rsc.org/images/entities/char_2009.gif) 000 m3 d−1. The initial mixed liquor suspended solids (MLSS) concentration in US-DBR was set at 3.0 g L−1. The main compositions of the simulated groundwater for the influent of US-DBR were as follows (mg L−1): NO3−–N, 25 mg L−1, CT, 5 and 50 μg L−1. The influent pH value was adjusted to 7.5 by addition of NaHCO3.
000 m3 d−1. The initial mixed liquor suspended solids (MLSS) concentration in US-DBR was set at 3.0 g L−1. The main compositions of the simulated groundwater for the influent of US-DBR were as follows (mg L−1): NO3−–N, 25 mg L−1, CT, 5 and 50 μg L−1. The influent pH value was adjusted to 7.5 by addition of NaHCO3.
2.3. EPS and SMP extraction and analysis
Extracellular polymeric substance (EPS) and soluble microbial product (SMP) are two kinds of microbial products that have a significant correlation with microbial activity of biologically based systems. Both types of EPS, LB-EPS and TB-EPS from PBS biofilm, were extracted by using a two-step heat extraction method as described elsewhere.18 The SMP samples were collected from each sampling port of the reactor by centrifugation at 4000 rpm and filtrated at 0.45 μm membrane filter.19 3D-EEM was obtained by subsequent scanning excitation from 200 to 400 nm at 10 nm increments, and the emission wavelength from 280 to 550 nm with a slit-width of 10 nm. PARAFAC decomposed N-way arrays into N loading matrices was applied for the further analysis of SMP fluorescence data, as similarly reported by Yu et al.202.4. Analytical methods
NO2−–N and NO3−–N concentrations were determined by using their standard methods.21 The polysaccharide (PS) and protein (PN) content were determined by using anthrone–sulfuric acid and modified Lowry methods with glucose and bovine serum albumin (BSA) as the standard, respectively. 3D-EEM spectra were characterized by using a Luminescence spectrometer (LS-55, PerkinElmer Co., USA).3. Results and discussion
3.1. Long-term performance of CT and nitrate removal from US-DBR
According to the influent CT concentrations, three experimental conditions (0, 5, 50 μg L−1 CT) were tested in the present study to evaluate the simultaneous removal of nitrate and CT. Fig. 1A shows the long-term performance of CT and nitrogen removal in the US-DBR during the whole operation. In the absence of CT (Stage I, days 1 to 29), the US-DBR expressed excellent nitrate removal efficiency in the start-up days. Generally, solid-phase heterotrophic denitrification process can be realized quickly after inoculation of sludge, consistent with the literature reported by Han et al.22 The influent and effluent nitrate concentrations were average at 28.3 and 0.48 mg L−1, respectively, resulting in the removal efficiency of nitrate was high of 98.3%. In the same time, the effluent nitrite concentration was always at low level (below 2 mg L−1). After increasing the influent CT concentration at 5 μg L−1 (Stage II, days 30 to 50), a temporary fluctuation of effluent nitrate at 3.48 mg L−1 was observed at the beginning of Stage II and quickly recovered to normal value (0.68 mg L−1 with 2 days). The result suggested the CT addition had a certain influence on the activity of denitrifying bacteria in short exposure. After successive 80 days' operation, seed sludge was successfully attached onto the PBS surface and formed biofilm for more stable treatment effect. Although the CT loading was stabilized at approximately 50 μg L−1 (Stage III, days 51–80), the system remained in a good denitrification performance with nitrate removal efficiency higher than 98%, suggesting that the activity of denitrifying bacteria was not affected by high concentration CT.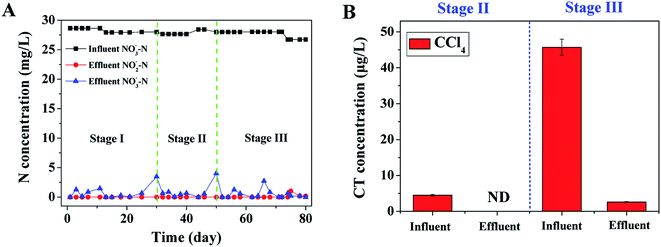 | ||
| Fig. 1 Long-term performance of CT and nitrogen removal in the US-DBR during the whole operation: (A) influent and effluent nitrogen compounds; (B) CT removal efficiencies. | ||
In order to gradually adapt to influent CT, the US-DBR system was firstly performed under a low CT influent (Stage II, average at 4.5 μg L−1), and the effluent CT was not detected and CT removal efficiency reached almost 100% (Fig. 1B). At Stage III, the PBS biofilm had been gradually applied to the toxic environment of CT, and demonstrated good organic matter removal performance under anoxic condition. After the adaptation stage, the influent and effluent CT concentrations were average at 45.7 and 2.6 μg L−1, respectively, suggesting the CT was well removed under anoxic denitrification environment by using solid carbon source as electronic donor. Takeuchi et al.23 also investigated the anaerobic transformation of chlorophenols in methanogenic sludge, suggesting that the chlorine atom at the ortho-position was the most easily dechlorinated. Several authors have also reported removals of other complex chlorinated phenols under aerobic system.24 For example, Wang et al.25 found aerobic granules could be successfully cultivated in an SBR for 2,4-DCP biodegradation using a strategy involving the addition of glucose as a co-substrate, resulting in 2,4-DCP removal efficiency was high of 94%.
3.2. Changes in EPS for PBS-biofilm formation
As a complex high-molecular-weight mixture of polymers, the presence of EPS plays an essential role for the formation and stability of biofilm. Generally, EPS exhibits a dynamic double-layer-like structure, which was composed of LB-EPS and TB-EPS.26 It is necessary to investigate the composition and structure of EPS to understand the formation and operation characteristics of biofilm. Fig. 2 shows the LB-EPS and TB-EPS contents extracted from the biofilm in the whole operation of the US-DBR in the absence and presence of CT. It was found that PN and PS contents in TB-EPS in both biofilm samples were much higher than those of LB-EPS, suggesting that TB-EPS were the main fraction of the extracellular organic matter for microbial biofilm aggregation. After microorganism grown onto PBS surface, the amount of EPS (sum of LB-EPS and TB-EPS) increased from 16.1 to 46.4 mg g−1, implying EPS production played a positive relation to the formation of biofilm, as similarly reported by Czaczyk et al.27 Additionally, PN content in LB-EPS and TB-EPS increased 2.6 and 4.0 times higher in the presence of CT than those of absence of CT, while PS increased 1.9 and 2.0 times higher, suggesting that the biofilm secreted more PN for self-protection against toxic CT substances. The result implied that PN was more sensitive to the CT exposure than that of PS, especially in TB-EPS. Similar observation of increased EPS production after toxicity exposure has been well reported in the previous literatures. Zheng et al.28 explored the EPS property of sludge for treating 4-chlorophenol synthetic wastewater in an SBR, suggesting that the compositions of PN, PS and DNA increased with the injection of 4-CP during one SBR circle. Miao et al.29 reported the response of biofilm EPS to CuO nanoparticle exposure, implying that more LB-EPS was produced in wastewater biofilm exposed to CuO NPs with a higher content of PN compared to PS.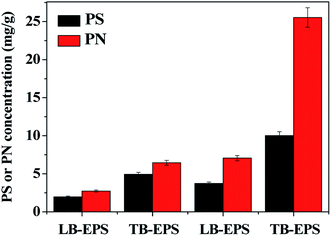 | ||
| Fig. 2 LB-EPS and TB-EPS contents extracted from the PBS biofilm in the whole operation of the US-DBR in the absence and presence of CT. | ||
Fig. 3 shows the EEM spectra of LB-EPS and TB-EPS from biofilm in the absence and presence of CT. It was found from Fig. 3 that two main peaks (A and B) were identified in LB-EPS and TB-EPS at excitation/emission wavelengths (Ex/Em) of 290/347–351 and 220/347–360 nm, regardless of the absence and presence of CT. The fluorescent peaks were assigned to aromatic protein-like and tryptophan protein-like substances, respectively.30 The fluorescent intensities of Peak A and Peak B in TB-EPS were much higher than those of LB-EPS, suggesting that protein was rich in TB-EPS. It was also found that Peak A and Peak B expressed higher fluorescent intensities in PBS biofilm in the presence of CT than those of in the absence of CT, suggesting that CT contributed to the EPS secretion in the toxicity exposure process. The fluorescent data were consistent with the observation of chemical analysis. Wang et al.31 also evaluated that the responses of biofilm from moving bed biofilm reactor to antibiotics exposure, suggesting that EPS could serve as reservoirs for tested antibiotics, especially proteins dominated the EPS-antibiotic interactions.
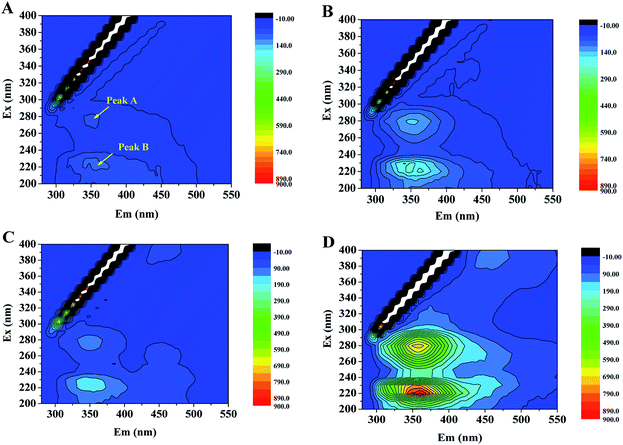 | ||
| Fig. 3 EEM spectra of LB-EPS and TB-EPS from biofilm in the absence and presence of CT: (A) LB-EPS and (B) TB-EPS in the absence of CT; (C) LB-EPS and (D) TB-EPS in the presence of CT. | ||
3.3. Variations of CT and nitrate compounds removal in one typical cycle
Fig. 4 shows the variations of nitrogen compounds in the absence (A), presence of CT (B), and CT concentrations (C) along with the height of US-DBR. It is clearly observed that nitrate reduction varied with the height of the sampling points in the PBS biofilm reactor. In the absence of CT at day 15 (Fig. 4A), the NO3−–N concentration was significantly reduced from 28.0 to 11.5 mg L−1 by using solid carbon source in the first 10 cm. A temporary nitrite peak was observed at 10 cm height with the concentration of 8.9 mg L−1, and quickly reduced to 0.57 mg L−1 in the 50 cm weight. Most of nitrogen compounds were removed in the 50 cm height of the US-DBR, suggesting that the denitrification activity was high in the bottom of system. The result proved that PBS was ideal carbon source and biofilm carrier for denitrification. Zhu et al.32 also evaluated the biological denitrification performance using PBS as carbon source and biofilm carrier for recirculating aquaculture system effluent treatment, finding that nitrite concentration was maintained below 1 mg L−1.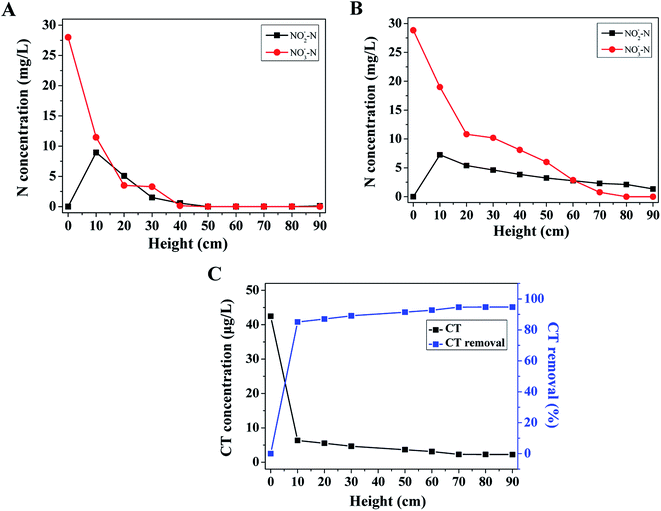 | ||
| Fig. 4 Variations of nitrogen compounds in the absence (A), presence of CT (B), and CT concentrations (C) along with the height of US-DBR. | ||
In comparison with absence of CT, the NO3−–N concentration only decreased from 28.8 to 10.8 mg L−1 in the first 20 cm of reactor in the presence of CT (Fig. 4B), resulting in the NO3−–N removal rate was reduced approximately 28.5% than that of control experiment. Besides, the influent NO3−–N concentration was reduced to 0.78 mg L−1 at 70 cm of the reactor, implying that the denitrification activity was inhibited by the CT exposure. Although the nitrate removal efficiency was not significantly decreased, the effluent NO2−–N concentration of the reactor was remained at 1.35 mg L−1, suggesting that the reactor still had good denitrification capacity. A similar trend of toxicity on autotrophic and heterotrophic denitrification also was observed in various bioreactors. Chen et al.33 evaluated the toxic effects of vanadium(V) on a combined autotrophic denitrification system using sulfur and hydrogen as electron donors, finding that the nitrate removal efficiency decreased from 94.3% to 52.1% with the initial V(V) concentration increased from 30 to 100 mg L−1. Kiskira et al.34 investigated the effect of Cu, Ni and Zn on Fe(II)-driven autotrophic denitrification, suggesting that Cu was averagely the most inhibitory metal for all the microbial cultures.
Fig. 4C shows the CT concentration and removal efficiency as function of height in the reactor. The influent and effluent CT concentration was found at 42.5 and 2.23 μg L−1 with the CT total removal efficiency high of 94.8%. Correspondingly, it was found that the CT removal efficiency was consisted of 85.1 and 9.6% in the first 10 cm and 20–90 cm, respectively. Based on the above result, it can be concluded that most of CT was significant transformed accompanied by the lowered nitrate concentration under influent nitrate of 50 mg L−1 (Fig. 4B). A variety of dechlorination processes may be also involved during the degradation of CT by using unadapted sludge. Eekert et al.35 investigated the degradation and CT in an unadapted methanogenic granular sludge reactor, finding that dechlorination of CT was carried out without prior adaptation and leaded to nonhazardous products.
3.4. SMP production from US-DBR system at stable stage
As a myriad of soluble organic matter, SMP are produced by mixed bacterial populations as results of microbial metabolism, which are of significant importance for bioreactor effluent quality and treatment efficiency in wastewater treatment system.36 Fig. 5 shows the changes in EEM of SMP in US-DBR for simultaneous CT and nitrate removal during stable operation at different height conditions. According to Fig. 5A, two obvious peaks, including Peak A and B, were observed at Ex/Em wavelengths of 280/350 and 340/440 nm, which were assigned to tryptophan protein-like substances and humic-like substances, respectively. Generally, the metabolism of microorganisms in solid-phase denitrification system included three processes: CT removal, biopolymer degradation and biological denitrification. The fluorescent intensities of Peak A and B were much higher in the first 30 cm of US-DBR than those of other height, suggesting the higher microbial activity in the degradation of influent CT and nitrate concentrations. There was a dramatic decrease of the SMP intensities in the effluent, which may be caused by a reduced microbial activity with the degradation of nitrate at HRT of 8 h, leading to a lower SMP release from biofilm.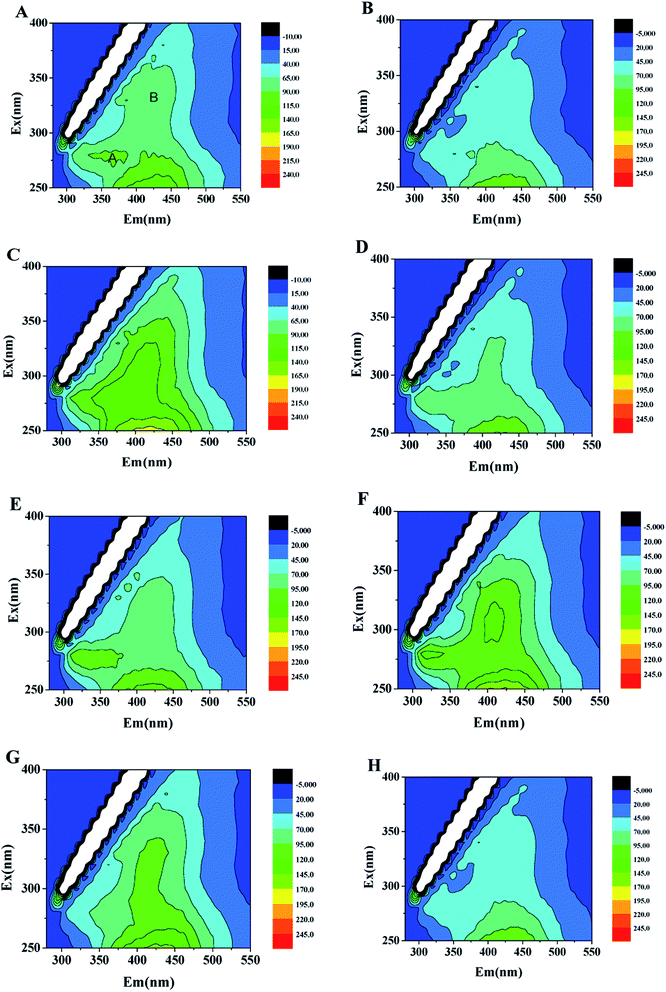 | ||
| Fig. 5 EEM of SMP in US-DBR in the presence of CT exposure at different height conditions: (A) 10 cm; (B) 20 cm; (C) 40 cm; (D) 50 cm; (E) 60 cm; (F) 70 cm; (G) 80 cm; (H) 90 cm. | ||
To deconvolute complex 3D-EEMs into independent fluorescent components, PARAFAC method was used for quantitative comparison of 3D-EEM samples for better understand the microbial metabolism in CT and nitrate treatment process.37 Fig. 6 shows the two components as well as fluorescence intensity scores of SMP identified by PARAFAC based on EEM spectra. According to core consistency, two components of SMP identified by PARAFAC were suitable in the presence of CT. A peak located at Ex/Em of 330/434.5 was found in component 1 (Fig. 6A), representing to the presence of humic-like substances, whereas component 2 associated with PN-like substances at Ex/Em of 280/345.5 (Fig. 6B). Similar two components was also identified in the activated sludge process, which are usually the major effluent from biological treatment process.19 According to Fig. 6C, the fluorescence intensity scores of components 1 and 2 expressed similar tendencies in the US-DBR, and much higher fluorescence intensity scores were observed at 30 cm height of the system, meaning that the stronger microbial activity in this area. Humic-like substances and PN-like substances were also regarded as non-biodegradable and biodegradable substances in wastewater treatment process.38
 | ||
| Fig. 6 Two components and fluorescence intensity scores of SMP identified by PARAFAC based on EEM spectra: (A) humic-like substances; (B) PN-like substances; (C) fluorescence intensity scores. | ||
3.5. Bacterial community composition and shift
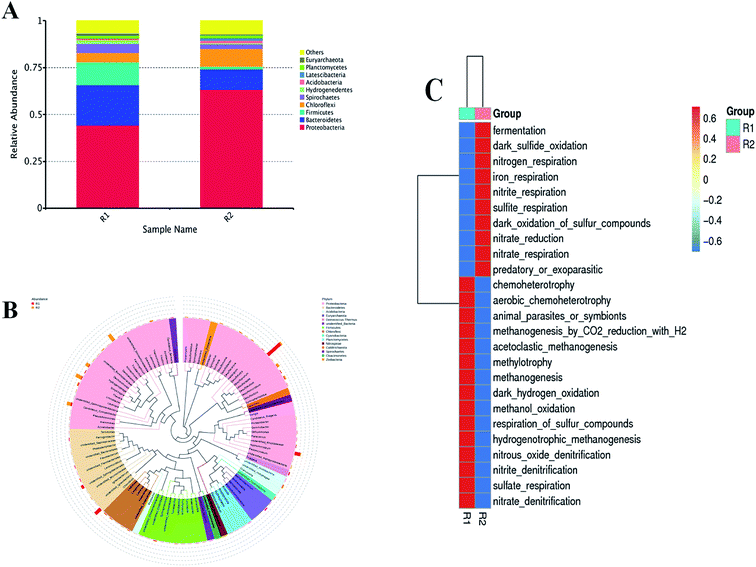
Fig. 7 shows the taxonomic compositions of microbial community in the absence and presence of CT at phylum (A), and genus (B) level and their function prediction (C). It was found that significant differences were observed at two levels by taxonomic assignments to CT exposure. Fig. 7A shows that Proteobacteria, Bacteroidetes, and Firmicutes were the predominant phylum in the biofilm in the absence of CT, with respective relative abundances of 44.4%, 21.3% and 12.6%, respectively, and changed to 63.4%, 10.6% and 1.6% in the presence of CT. Proteobacteria and Bacteroidetes are typical for the activated sludge process in wastewater treatment process, responsible for biological nitrogen removal.39 At genus level (Fig. 7B), the prominent genus in the PBS biofilm samples in the absence of CT were Desulfoprunum, Chlorobium, Hyphomicrobium at the proportion of 15.1%, 6.57% and 5.19%, whereas in the presence of CT were Thiobacillus, Thauera, Candidatus_Competibacter, Hydrogenophaga at the proportion of 6.77%, 5.47%, 3.59% and 3.17%, respectively. The abundancy of Desulfoprunum significantly declined from 15.1% to 1.35% in response to CT exposure, which was possibly attributed to presence of CT exposure. Yu et al.40 found that Thiobacillus could utilize poised electrodes directly as sole electron donors for autotrophic denitrification in bioelectrochemical systems. It is well accepted that Thauera as the predominant genus has the ability to heterotrophically reduce nitrate or nitrite in the denitrification reactor.41
4. Conclusions
In summary, CT and nitrate were simultaneously removed from groundwater in an US-DBR by using PBS as carbon source and biocarrier. After biofilm stable operation, nitrate and CT removal efficiencies were high of 98% and 94.3%, respectively. The main compositions of LB-EPS and TB-EPS, including PS and PN contents, significantly increased to the CT exposure and biofilm formation. Microbial analysis suggested that Thiobacillus, Thauera, Candidatus_Competibacter, Hydrogenophaga were dominant genus in the denitrification reactor. The obtained result could provide novel information for the simultaneous CT and nitrate removal from groundwater under anoxic environment.Conflicts of interest
The authors declare no conflict of interest.Acknowledgements
The Project of Shandong Province Higher Educational Science and Technology Program (J17KA191) and the Project of Shandong Provincial Natural Science Foundation (ZR2019MD029).References
- A. L. Teel and R. J. Watts, J. Hazard. Mater., 2002, 94(2), 179–189 CrossRef CAS.
- M. L. TÁmara and E. C. Butler, Environ. Sci. Technol., 2004, 38(6), 1866–1876 CrossRef PubMed.
- H. N. Altalyan, B. Jones, J. Bradd, L. D. Nghiem and Y. M. Alyazichi, Journal of Water Process Engineering, 2016, 9, 9–21 CrossRef.
- T. A. Saleh, K. R. Alhooshani and M. S. A. Abdelbassit, J. Taiwan Inst. Chem. Eng., 2015, 55, 159–169 CrossRef CAS.
- A. Buchholz, C. Laskov and S. B. Haderlein, Environ. Sci. Technol., 2011, 45, 3355–3360 CrossRef CAS.
- S. Bae and W. Lee, Geochim. Cosmochim. Acta, 2012, 85, 170–186 CrossRef CAS.
- H. W. Wu and Q. Y. Feng, J. Environ. Sci., 2017, 54, 346–357 CrossRef PubMed.
- M. H. Xu, X. G. Gu, S. G. Lu, Z. F. Qiu, Q. Sui, Z. W. Miao, X. K. Zang and X. L. Wu, J. Hazard. Mater., 2015, 286, 7–14 CrossRef CAS PubMed.
- K. E. Vickstrom, M. F. Azizian and L. Semprini, Chemosphere, 2017, 182, 65–75 CrossRef CAS PubMed.
- R. Boopathy, Bioresour. Technol., 2002, 84(1), 69–73 CrossRef CAS PubMed.
- M. F. Azizian and L. Semprini, J. Contam. Hydrol., 2016, 190, 58–68 CrossRef CAS PubMed.
- J. Hansen, D. Johnstone, J. Fredrickson and T. Brouns, Bioremediation of chlorinated and polycyclic aromatic hydrocarbon compounds, 1993, p. 293 Search PubMed.
- W. Z. Wu, L. H. Yang and J. L. Wang, Environ. Sci. Pollut. Res., 2013, 20(1), 333–339 CrossRef CAS.
- Z. Q. Shen, Y. X. Zhou, J. Hu and J. L. Wang, J. Hazard. Mater., 2013, 250, 431–438 CrossRef PubMed.
- J. Wang and L. Chu, Biotechnol. Adv., 2016, 34(6), 1103–1112 CrossRef CAS PubMed.
- Z. Q. Shen and J. L. Wang, Bioresour. Technol., 2011, 102(19), 8835–8838 CrossRef CAS.
- R. S. Skeen, K. M. Amos and J. N. Petersen, Water Res., 1994, 28(12), 2433–2438 CrossRef CAS.
- X. Y. Li and S. F. Yang, Water Res., 2007, 41(5), 1022–1030 CrossRef CAS PubMed.
- B. J. Ni, R. J. Zeng, F. Fang, W. M. Xie, G. P. Sheng and H. Q. Yu, Water Res., 2010, 44(7), 2292–2302 CrossRef CAS PubMed.
- G. H. Yu, Y. H. Luo, M. J. Wu, Z. Tang, D. Y. Liu, X. M. Yang and Q. R. Shen, Bioresour. Technol., 2010, 101(21), 8244–8251 CrossRef CAS PubMed.
- C. Association and D. Washington, American Physical Education Review, 1995, 24, 481–486 Search PubMed.
- F. Han, D. Wei, H. H. Ngo, W. S. Guo, W. Y. Xu, B. Du and Q. Wei, J. Environ. Manage., 2018, 227, 375–385 CrossRef CAS PubMed.
- R. Takeuchi, Y. Suwa, T. Yamagishi and Y. Yonezawa, Chemosphere, 2000, 41(9), 1457–1462 CrossRef CAS PubMed.
- H. Vashi, O. T. Iorhemen and J. H. Tay, Environmental Technology & Innovation, 2018, 9, 265–274 Search PubMed.
- S. G. Wang, X. W. Liu, H. Y. Zhang, W. X. Gong, X. F. Sun and B. Y. Gao, Chemosphere, 2007, 69(5), 769–775 CrossRef CAS PubMed.
- Z. W. Liang, W. H. Li, S. Y. Yang and P. Du, Chemosphere, 2010, 81(5), 626–632 CrossRef CAS PubMed.
- K. Czaczyk and K. Myszka, Pol. J. Environ. Stud., 2007, 16(6), 799–806 CAS.
- B. Zheng, X. R. Chen, J. G. Zhao, F. K. Lin, J. H. Li and Y. Y. Zhang, Int. Biodeterior. Biodegrad., 2016, 110, 24–31 CrossRef.
- L. Z. Miao, C. Wang, J. Hou, P. F. Wang, Y. H. Ao, Y. Li, Y. Yao, B. W. Lv, Y. Y. Yang and G. X. You, Sci. Total Environ., 2017, 579, 588–597 CrossRef CAS PubMed.
- G. P. Sheng and H. Q. Yu, Water Res., 2006, 40(6), 1233–1239 CrossRef CAS PubMed.
- L. F. Wang, Y. Li, L. Wang, M. J. Zhu, X. X. Zhu, C. Qian and W. W. Li, Bioresour. Technol., 2018, 254, 268–277 CrossRef CAS PubMed.
- S. M. Zhu, Y. L. Deng, Y. J. Ruan, X. S. Guo, M. M. Shi and J. Z. Shen, Bioresour. Technol., 2015, 192, 603–610 CrossRef CAS PubMed.
- D. Chen, Z. X. Xiao, H. Y. Wang and K. Yang, Bioresour. Technol., 2018, 264, 319–326 CrossRef CAS PubMed.
- K. Kiskira, S. Papirio, C. Fourdrin, E. D. van Hullebusch and G. Esposito, J. Environ. Manage., 2018, 218, 209–219 CrossRef CAS.
- M. H. Van Eekert, T. J. Schröder, A. J. Stams, G. Schraa and J. A. Field, Appl. Environ. Microbiol., 1998, 64(7), 2350–2356 CrossRef CAS.
- S. Liang, C. Liu and L. F. Song, Water Res., 2007, 41(1), 95–101 CrossRef CAS PubMed.
- J. Wu, H. Zhang, P. J. He and L. M. Shao, Water Res., 2011, 45(4), 1711–1719 CrossRef CAS PubMed.
- L. X. Huang, M. L. Li, G. C. Si, J. L. Wei, H. H. Ngo, W. S. Guo, W. Y. Xu, B. Du, Q. Wei and D. Wei, J. Colloid Interface Sci., 2018, 527, 87–94 CrossRef CAS PubMed.
- D. Wei, H. H. Ngo, W. Guo, W. Y. Xu, B. Du and Q. Wei, Bioresour. Technol., 2018, 269, 25–31 CrossRef CAS PubMed.
- L. P. Yu, Y. Yuan, S. S. Chen, L. Zhuang and S. G. Zhou, Electrochem. Commun., 2015, 60, 126–130 CrossRef CAS.
- W. T. Qian, B. Ma, X. Y. Li, Q. Zhang and Y. Z. Peng, Bioresour. Technol., 2019, 278, 444–449 CrossRef CAS PubMed.
| This journal is © The Royal Society of Chemistry 2020 |

