DOI:
10.1039/C9RA08540H
(Paper)
RSC Adv., 2020,
10, 524-532
Nano-zirconia supported by graphitic carbon nitride for enhanced visible light photocatalytic activity
Received
18th October 2019
, Accepted 17th December 2019
First published on 2nd January 2020
Abstract
Graphitic carbon nitride (g-C3N4) was prepared by high-temperature calcination of urea. A mixture of g-C3N4 and nano-ZrO2 precursor was directly calcined to prepare g-C3N4/ZrO2 hybrid photocatalysts. The photocatalytic properties of the sample were characterized by degradation of rhodamine B (RhB) under visible light. The g-C3N4/ZrO2 hybrid photocatalysts have better degradation performance than the pure g-C3N4 and ZrO2. The prepared catalysts were characterized by various techniques including X-ray diffraction (XRD), scanning electron microscopy (SEM), transmission electron microscopy (TEM), UV-vis diffuse reflectance spectroscopy (DRS), Fourier transform infrared spectroscopy (FT-IR), and photoluminescence spectroscopy (PL) and electrochemical tests. The reasons for the improvement of catalytic activity were investigated from the aspects of crystal structure, surface morphology and photoelectric properties, and the catalytic mechanism were studied. The results show that the ZrO2 nanoparticles were coated with g-C3N4 to form a heterostructure. Compared with the pure g-C3N4 and ZrO2, the g-C3N4/ZrO2 hybrids reduce the charge transfer resistance and inhibit the recombination of electron–holes well. In addition, it affects the band structure and improves the absorption of visible-light. At the same time, the study found that the main active species in the catalytic process were h+ and ·O2−.
1. Introduction
With the development of the economy, the problem of environmental pollution has become more and more prominent, so increasingly scientific research workers are committed to the treatment of environmental pollution.1,2 In recent years, the use of solar energy for photolysis of water to produce hydrogen3–5 and photocatalytic degradation of pollutants6–8 has attracted extensive attention. A large number of semiconductor catalysts have been extensively studied, such as TiO2, ZnO, CeO2 and WO3.9–12 However, their forbidden band widths are too large, so they can only be excited under ultraviolet light, and the utilization rate of solar energy is not more than 4%.13 In these semiconductor photocatalysts, the conduction band potential of ZrO2 is about −1.0 eV, which is much lower than some semiconductors such as TiO2 (−0.12 eV) and CeO2 (−0.34 eV).12 Few semiconductors contain such negative CB that can be used to sensitize ZrO2.
Senthil, Wang and Zhao reported a semiconductor photocatalyst, graphitic carbon nitride (g-C3N4), which is highly stable and low price. It is highly efficient in catalyzing hydrogen production and degrading organic pollutants under visible light.14–16 It can be obtained by roasting inexpensive raw materials, such as urea, thiourea and melamine.17–19 The forbidden band width of g-C3N4 is 2.7 eV, which is not only excited by visible light, but also has high solar energy utilization. In addition, g-C3N4 is a layered structure, and there is a gap between layers, so the theoretical specific surface area should be large.20 However, in actual performance studies, g-C3N4 was found to exhibit significant defects, and its photogenerated carriers have extremely short lifetimes and are very easy to recombine. In order to improve its photocatalytic activity, various methods such as doping, noble metal loading and construction of heterojunctions have been researched.21–28 Building a heterojunction is considered the most effective way. Wang et al. synthesized Cd0.5Zn0.5S/g-C3N4 composite photocatalyst by two-step solvothermal method. The results showed that the photocatalytic performance of g-C3N4 was greatly improved by the loading of Cd0.5Zn0.5S.29 Lv et al. reported a g-C3N4/BiOBr photocatalyst which greatly reduced the recombination rate of electron–hole pairs, thereby effectively improving its catalytic activity.30 However, the preparation of g-C3N4/ZrO2 has rarely been reported. Since the conduction band potential of g-C3N4 is −1.2 eV, ZrO2 can be sensitized to increase its photocatalytic activity, it will be a very promising research direction.
In this paper, nano-ZrO2 with an average particle size of 15.4 nm was prepared by precipitation method. The g-C3N4/ZrO2 composites were prepared by direct calcination. The heterojunction structure of g-C3N4 with ZrO2 greatly improved the efficiency of photocatalytic degradation of rhodamine B, and the reasons for its photocatalytic activity and photocatalytic mechanism were explored.
2. Experimental section
2.1 Catalysts preparation
All raw materials were of analytical grade and were not further purified. They were purchased from Sinopharm Chemical Reagent Network. Pure ZrO2 was prepared from ZrOCl2·8H2O and stronger ammonia water. The method is as follows: 6.4450 g ZrOCl2·8H2O was added to 100 mL deionized water to prepare 0.2 mol L−1 ZrOCl2 aqueous solution. Slowly added stronger ammonia water to adjust pH to 10–11 and stirred for 1 h. Then, it was dried at 60 °C for 10 h and thoroughly ground to obtain a ZrO2 precursor powder. The precursor powder was calcined at 500 °C for 3 h in a tube furnace at a heating rate of 5 °C min−1 to obtain a ZrO2 powder photocatalytic material. Pure g-C3N4 was prepared as follows: 40 g of urea was added to 40 mL of deionized water, dissolved by ultrasonic for 1 h, and recrystallized by drying at 100 °C for 12 h. The crystal product was thoroughly ground, and the product was calcined at 550 °C for 4 h in a tube furnace at a heating rate of 2.3 °C min−1, to give a pale yellow g-C3N4.
The g-C3N4/ZrO2 composites were prepared as follows: in the process of preparing the ZrO2 precursor powder, after adjusted the pH to 10–11 and stirred uniformly, a certain amount of g-C3N4 prepared in advance was added, and the mixture was stirred for 1 h to make the mixture uniform, dried at 60 °C, ground for 30 min, and then heated at 500 °C for 3 h in tube furnace with a heating rate of 5 °C min−1, to obtain g-C3N4/ZrO2 composites. Among them, the g-C3N4/ZrO2 composites were 5![[thin space (1/6-em)]](https://www.rsc.org/images/entities/char_2009.gif) :1, 4:1, 3:1 and 2:1 by mass ratio (respectively recorded as 5:1 CN/ZrO2, 4:1 CN/ZrO2, 3:1 CN/ZrO2 and 2:1 CN/ZrO2).
:1, 4:1, 3:1 and 2:1 by mass ratio (respectively recorded as 5:1 CN/ZrO2, 4:1 CN/ZrO2, 3:1 CN/ZrO2 and 2:1 CN/ZrO2).
2.2 Catalyst characterizations
The crystal phase structure of the sample was measured using a X' Pert PRD MPD type Cu target X-ray diffractometer from the Dutch PANalytical B.V. at a scanning speed of 0.303841° s−1. The SEM was performed using a Japanese JSM-7200 field emission scanning electron microscope. The TEM used a Japanese JEM-2100 high-resolution transmission electron microscope. The PL spectrum was measured with a F-7000 type fluorescence spectrophotometer, using a Xe lamp (excitation wavelength is 365 nm) as light source. The DRS spectrum used a U-3900 UV-vis spectrophotometer and BaSO4 as a reference sample. The FT-IR spectrums were collected with a Tensor II Fourier transform infrared spectrometer.
Electrochemical impedance spectroscopy (EIS) and photocurrent response (PR) tests were performed using the CS130 electrochemical workstation. A three-electrode system was used, and the corresponding three electrodes are a working electrode, a reference electrode (Ag/AgCl saturated KCl), and a counter electrode (Pt rod). The working electrode was prepared as follows: a 2 × 1 cm piece of indium tin oxide (ITO) glass was cut, then washed with acetone, boiling NaOH (0.1 mol L−1) and deionized water. Then weighed 0.018 g of sample and 0.002 g of polyvinylidene fluoride mixed and fully ground. After the grinding, 60 μL of 1-methyl-2-pyrrolidone was added and ultrasonicated for 0.5 h, and then the resulting suspension was applied onto an ITO glass substrate to a coating area of 1 cm2. Finally, the coated ITO glass was dried at 50 °C to obtain a working electrode.31 An alternating current voltage of 10 mV was applied, and the initial potential was 0 V. The EIS spectrum was made in 0.01 M Na2SO4 in the frequency range of 105 Hz to 10−2 Hz. The photocurrent response diagram was measured using a 350 W Xe lamp as the light source and an aqueous solution of Na2SO4 (0.01 M) as the electrolyte.
2.3 Photocatalytic reaction
Using photocatalytic degradation of rhodamine (18 mg L−1) as a model reaction, the light source is a 250 W high-pressure mercury lamp, and the wavelength below 420 nm is filtered by a filtering device. Its light intensity is 7.0 mW cm−2, the photocatalytic properties of different ratios of CN/ZrO2 composites and pure g-C3N4 and ZrO2 were investigated. Added a certain amount of photocatalytic materials (according to the amount of 0.08 g/100 mL) in the configured rhodamine solution. The sample was first darkly adsorbed for 20 minutes, then the solution was transferred to a light source for photodegradation reaction, and samples were taken at the same time. All samples were centrifuged twice after taking the supernatant. The absorbance was measured with a 752 UV-vis spectrophotometer. The maximum absorption wavelength of rhodamine was 554 nm. All samples were repeated for the above steps. The above tests were performed three times and averaged. The sample was recovered dry and subjected to a cycle test to test its cycle performance.
2.4 Mechanism exploration
In order to confirm the mechanism of this catalytic reaction, benzophenone (BQ), triethanolamine (TEOA) and tert-butanol (IPA) were used as scavengers for superoxide radicals (·O2−), holes (h+) and hydroxyl radicals (·OH). These three kinds of scavengers (0.01 mol L−1) were added to three same rhodamine B solutions respectively before dark adsorption, and the rest of the process was consistent with the degradation experiment.32
3. Results and discussion
3.1 XRD analysis
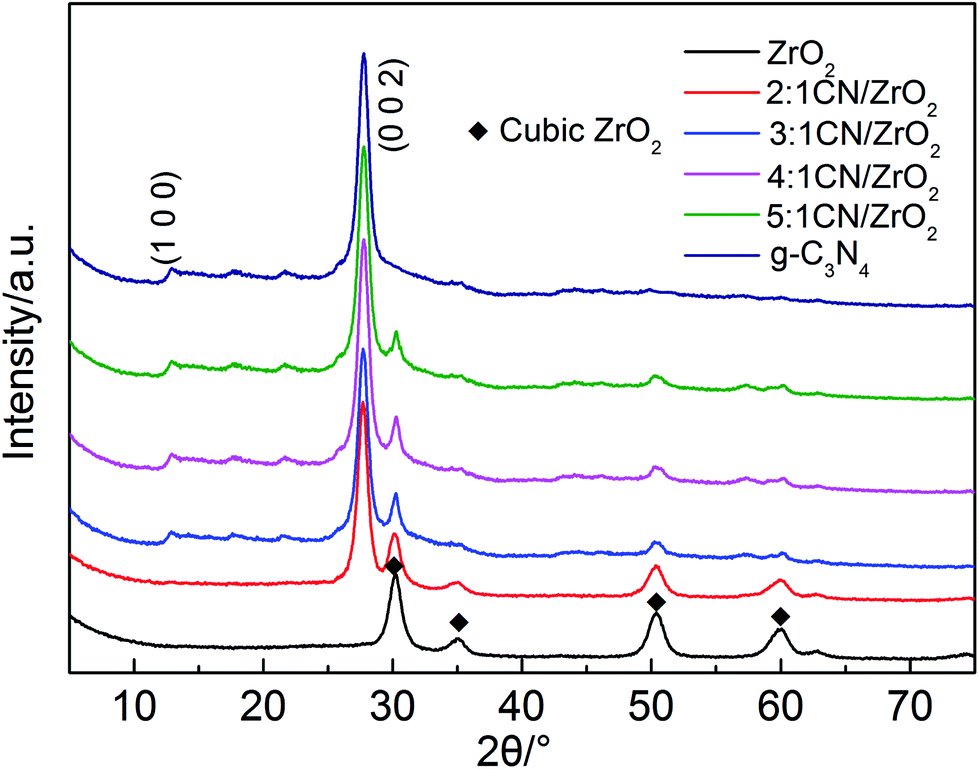
In order to determine the crystal phase structure of the semiconductor photocatalytic material, all samples were examined using XRD. As shown in Fig. 1, the XRD patterns of g-C3N4 corresponds to the strongest peak at 2θ = 27.4°, and its crystal plane is (002), indicating periodic graphite deposition of conjugated aromatic CN units; at 2θ = 12.7°, the diffraction peak corresponds to the (100) crystal plane, and is formed by hybridization of the aromatic substance sp2 in the layer, which has a 3 s-triazine structure.33 The pure phase ZrO2 is a cubic phase, and the corresponding characteristic peaks are 2θ = 30.22°, 35.27°, 50.73° and 60.20°, respectively. The CN/ZrO2 composites have only two peaks and no other phases, indicating that the two g-C3N4 and ZrO2 are well complexed, and as the amount of g-C3N4 increases, the peak intensity increases and the peak intensity of ZrO2 decreases.
 |
| | Fig. 1 XRD patterns of CN/ZrO2 composites and pure g-C3N4 and ZrO2. | |
3.2 Characterization of morphology and structure
SEM and TEM spectras of CN/ZrO2 composites and pure g-C3N4 and ZrO2 were observed in order to observe the morphology and structure of the samples. It can be seen from the Fig. 2(a) and (b) that the pure ZrO2 is an irregular particle and has a certain agglomeration, and its average particle diameter is 15.4 nm. It can be seen from Fig. 2(c) and (d) that the pure g-C3N4 is a lamellar structure and exhibits multi-piece aggregation phenomenon. Because the morphology of the two materials is completely different, it is easy to distinguish in scanning electron microscopy. It can be clearly seen in Fig. 2(e) that the white irregular mass is ZrO2 and is coated with flaky g-C3N4, indicating that the two are well compounded, and the TEM spectrum (Fig. 2(f)) can also be. It is seen that the darker color is ZrO2, because it is covered by g-C3N4, so the graininess is not obvious. To further confirm, the Fig. 2(e) EDS component analysis is shown in Fig. 1(g) and (h). It is observed that the C, N, O and Zr elements are all included. It shows that ZrO2 is coated with g-C3N4 and is well compounded.
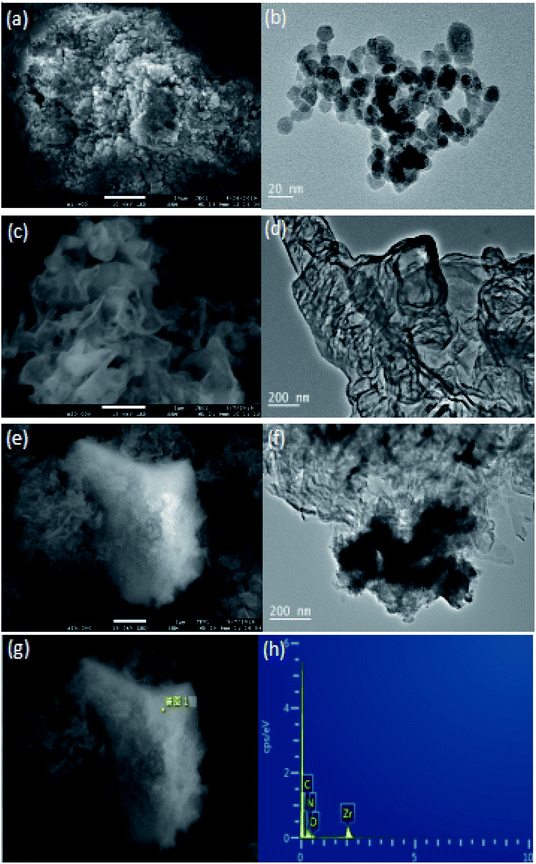 |
| | Fig. 2 SEM and TEM spectra of ZrO2 (a and b), g-C3N4 (c and d), CN/ZrO2 composite (e and f) and EDS (g and h). | |
3.3 Functional group studies
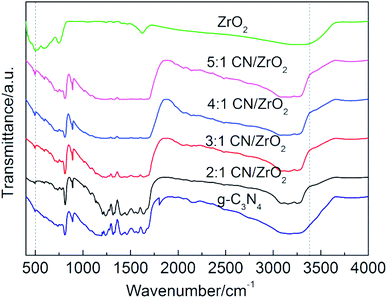
The FT-IR spectrum of CN/ZrO2 composite materials and pure g-C3N4 and ZrO2 is shown in Fig. 3. The pure g-C3N4 has a sharp absorption peak at 808 cm−1, and a strong absorption peak in the range of 1200–1700 cm−1. This is caused by the bending vibration of the 3 s-triazine C–N bond.34 From 3040 cm−1 to 3302 cm−1 corresponds to a broad absorption peak of g-C3N4, which is caused by the group of the aromatic ring defect. Pure ZrO2 has absorption peaks around 509 cm−1 and 750 cm−1 due to the stretching vibration of Zr–O. The broad absorption peak is around 3373 cm−1, caused by hydroxyl groups on the surface of the hydrated oxide and adsorbed water.35 The FT-IR of CN/ZrO2 composites is similar to that of pure phase g-C3N4. With the addition of ZrO2, it varies around 509 cm−1 and 3373 cm−1. It can be seen that the FT-IR spectrum is consistent with the XRD results, indicating the formation of a CN/ZrO2 heterostructure.
 |
| | Fig. 3 FT-IR spectra of CN/ZrO2 composites and pure g-C3N4, ZrO2. | |
3.4 Photoluminescence spectroscopy
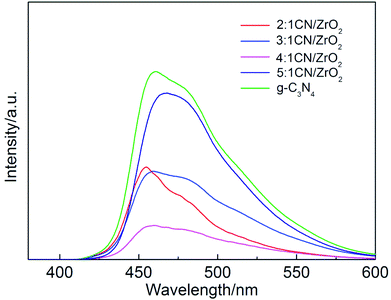
The photoluminescence spectroscopies of CN/ZrO2 composites and pure g-C3N4 are shown in Fig. 4. The effect of CN/ZrO2 composites heterojunction on the separation efficiency of electron–hole pairs was investigated. It can be seen from Fig. 4 that the pure g-C3N4 has a strong emission peak around 460 nm, which can be attributed to the band gap transition emission, and the energy of the emitted light approximates the band gap energy. The fluorescence emission intensity of CN/ZrO2 composites is greatly inhibited compared with that of pure g-C3N4. With the increase of CN/ZrO2 ratio, the degree of fluorescence quenching decreases first and then increases. It is indicated that the electron–hole recombination rate decreases first and then increases, and the 4:1 CN/ZrO2 composite recombination rate is the lowest.
 |
| | Fig. 4 PL spectrum of CN/ZrO2 composites and pure g-C3N4. | |
3.5 Electrochemical test
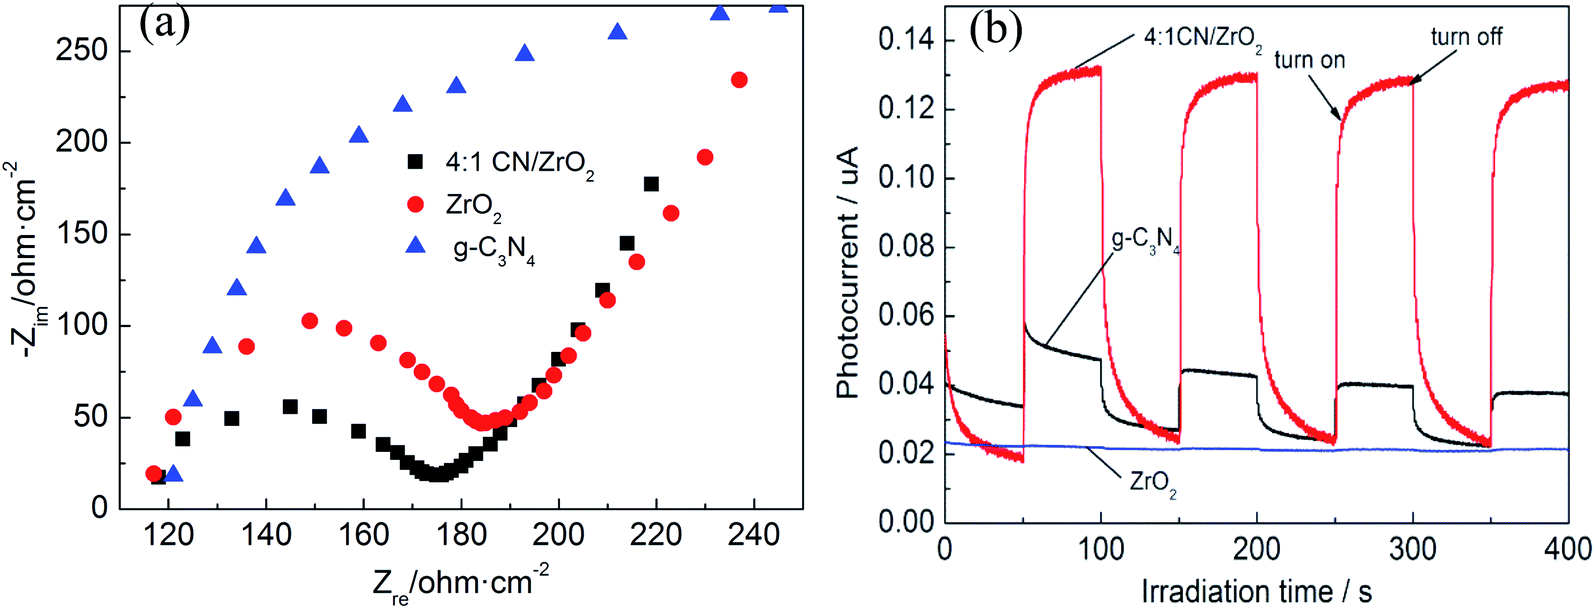
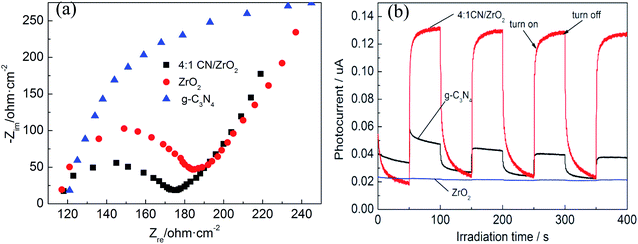
In order to confirm the results obtained by the PL spectrum, electrochemical impedance (EIS) and transient photocurrent response experiments were further performed. The EIS spectrum is shown in Fig. 5(a). The diameter of the semi-arc is equivalent to the charge transfer resistance of the catalyst. The smaller the radius, the smaller the resistance, the higher the electron–hole pair separation efficiency of the sample, and the faster the interface charge transfer will be. It can be seen from the Fig. 5(a) that the radius of the 4:1 CN/ZrO2 composite is the smallest, that is, the charge transfer resistance is the smallest, indicating that the addition of ZrO2 is beneficial to the separation of photogenerated electron–hole pairs and enhance the photocatalytic activity of the sample. The transient photocurrent response of the semiconductor photocatalyst is also directly related to the recombination rate of the electron–hole pair.36Fig. 5(b) shows the transient photocurrent response of 4:1 CN/ZrO2 and pure phase g-C3N4 and ZrO2. As can be seen, both the 4:1 CN/ZrO2 composite and the pure g-C3N4 can be excited under visible light and produce a stable photocurrent response, indicating the presence of photogenerated carriers in the sample. However, pure ZrO2 can hardly be excited under visible light, and only a very small amount of photogenerated carriers exists. Under the illumination of the light source, the photocurrent density of 4:1 CN/ZrO2 is greatly improved, which is about 3 times that of g-C3N4. It is shown that the addition of ZrO2 effectively inhibits the recombination of g-C3N4 electron–hole pairs, which also enhances its photocatalytic activity.
 |
| | Fig. 5 EIS changes (a) and transient photocurrent responses (b) of 4:1 CN/ZrO2 and pure g-C3N4, ZrO2 electrodes. | |
3.6 Optical performance studies
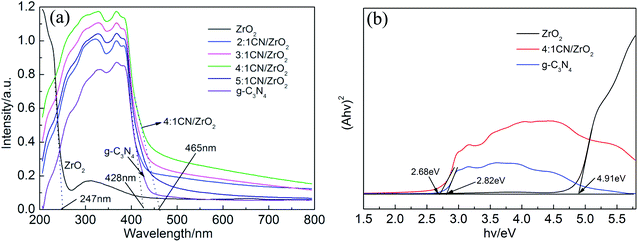
The UV-vis DRS of CN/ZrO2 and pure phase g-C3N4 and ZrO2 is shown in Fig. 6. In order to detect the optical properties of the sample, UV-vis DRS was performed on CN/ZrO2 and pure g-C3N4, ZrO2. The cut line method is used to make the tangent and the intersection with the abscissa to obtain the absorption wavelength threshold. It can be seen from Fig. 6 that the maximum absorption wavelength of ZrO2 for light is 247 nm. The pure g-C3N4 can absorb light at a maximum wavelength of 428 nm, compared with the pure g-C3N4, the absorption band edge of CN/ZrO2 is red-shifted, and the absorption of visible light is significantly enhanced. The 4:1 CN/ZrO2 composite absorption band can reach 465 nm, which indicates that the incorporation of ZrO2 improves the visible light absorption performance of g-C3N4, and 4:1 CN/ZrO2 is the best compound ratio.
 |
| | Fig. 6 UV-vis spectra of CN/ZrO2 composites and pure g-C3N4, ZrO2 (a); the transformed diffuse reflectance spectra (b). | |
Calculate the forbidden band width of a semiconductor according to the Kubelka–Munk formula:37,38
where
α is the absorption coefficient,
h is the Planck constant, and
ν is the frequency of light.
A is a constant and
Eg is the forbidden band energy. The
n value of ZrO
2 and g-C
3N
4 is 1/2.
39,40 As shown in
Fig. 6(b), the bandgaps of the samples were estimated to be 2.68 eV, 2.82 eV and 4.91 eV corresponding to 4
:
1 CN/ZrO
2, g-C
3N
4 and ZrO
2, respectively, which were close to the known values in previous reports.
31 It also explained the 4
:
1 CN/ZrO
2 composite has better light absorption properties than g-C
3N
4, which may be due to the interaction of ZrO
2 with g-C
3N
4. Some chemical bonds formed between the two semiconductors may result in an increase in optical properties.
3.7 Catalytic performance evaluation
The photocatalytic activity of CN/ZrO2 and pure g-C3N4 and ZrO2 was evaluated by degrading RhB under visible-light. Fig. 7a–d show the absorption spectra of RhB with different concentrations during the photocatalytic reaction. For the blank experiment, the absorption intensity at 554 nm remains almost unchanged with the increasing irradiation time as shown in Fig. 7(a), indicating the photolysis of RhB molecules is almost negligible. Adding a photocatalyst prepared in advance to the catalytic system, the RhB concentration gradually decreases with the extension of the catalytic time, as shown in Fig. 7(b)–(d). With the same catalytic time, the catalytic efficiency CN/ZrO2 > g-C3N4 > ZrO2. After catalysis, the maximum absorption wavelength of RhB is still around 554 nm, indicating that the sample has little effect on RhB. Test the specific photocatalytic efficiency as shown in Fig. 7(e) and (f). It can be seen from the Fig. 7(e) that the direct degradation of RhB can be neglected (<5%). The degradation of pure ZrO2 is very poor, with only a small amount of adsorption and degradation, and the final degradation rate can only reach 20.2%. The degradation of pure g-C3N4 is better than that of ZrO2, but the final degradation rate can only reach 66%, and the effect is not satisfactory. After the addition of ZrO2, the adsorption and degradation ability of g-C3N4 has been significantly improved. With the increase of ZrO2 addition, the catalytic effect under visible light first becomes better and then deteriorates. 4:1 CN/ZrO2 is the best compound ratio, and the final catalytic degradation rate can reach 98.5%. The catalyst with high catalytic efficiency also has good adsorption performance, but its catalytic activity is not completely dependent on the adsorption capacity. The adsorption performance of 4:1 CN/ZrO2 is not optimal, but the photocatalytic degradation is the best. From Fig. 7(f) photocatalytic degradation rate map, the degradation rate of pure g-C3N4 is 0.0076 min−1, which is five times the degradation rate of ZrO2 (0.0015 min−1). After g-C3N4 is combined with ZrO2, the electron–hole separation efficiency and visible light absorption capacity can be significantly improved. With the increase of ZrO2 compounding amount, the degradation rate of g-C3N4/ZrO2 composites increases first and then decreases. 4:1 CN/ZrO2 composite have the highest degradation rate, up to 0.026 min−1, which is 3.4 times that of pure g-C3N4.
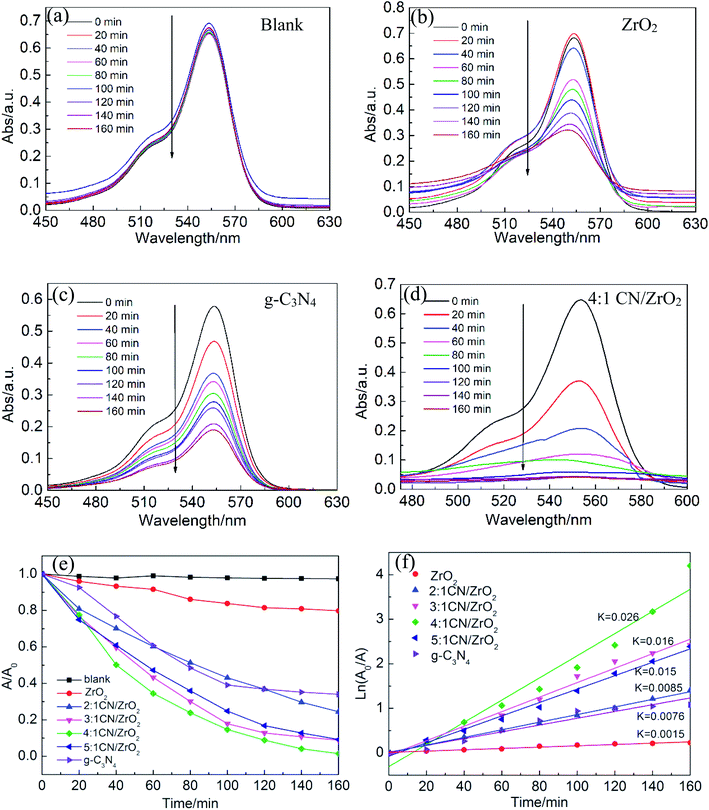 |
| | Fig. 7 UV-vis absorption spectra of photocatalytic RhB degradation over (a) blank, (b) ZrO2, (c) g-C3N4 and (d) CN/ZrO2 under the light irradiation. (e) Photodegradation efficiency toward RhB measured at 554 nm and (f) the photocatalytic rate curves and corresponding fitted kinetics curves of the blank experiment, ZrO2, g-C3N4, and CN/ZrO2 composites under the light irradiation. | |
The predecessors have also done a lot of modification of g-C3N4. Some composite materials and degradation rates are shown in Table 1. Prabhakar vattikuti et al.41 have prepared SnO2–ZnO/g-C3N4 composites. The degradation rate is 0.0184 min−1, which is 5 times that of pure g-C3N4. The degradation rate of CeO2/P–C3N4 prepared by J. Luo et al.42 can reach 0.011 min−1, which is 4 times higher than that of pure g-C3N4. Nagajyothi et al.43 doped g-C3N4 with Ag greatly increase the degradation rate, which can reach 0.01576 min−1, which is 2.5 times higher than that of pure g-C3N4. Prabhakar vattikuti et al.44 also prepared BiV/g-C3N4, the degradation rate can reach 0.101 min−1, which is 2.5 times higher than BiV. Compared with the composites prepared by the predecessors, the degradation rate of the CN/ZrO2 composites prepared in this paper increased greatly.
Table 1 Some g-C3N4 composite materials and degradation rate table
| Sample |
SnO2–ZnO/g-C3N4 (ref. 41) |
CeO2/P–C3N4 (ref. 42) |
Ag/g-C3N4 (ref. 43) |
BiV/g-C3N4 (ref. 44) |
| Degradation rate |
0.0184 min−1 |
0.0110 min−1 |
0.01576 min−1 |
0.101 min−1 |
3.8 Cycle performance and catalytic mechanism
For photocatalytic materials, not only photocatalytic performance is required, but also good stability is required, which can be reused without losing activity. Therefore, 4:1 CN/ZrO2 composite cycle test was carried out, and the sample was recovered, dried, and ground at the end of each test, and then subjected to the next round of tests, which were cycled five times in total. The cycle performance is shown in Fig. 8(a). After five cycles of the sample circulation, the degradation effect is not significantly reduced, indicating that the sample has good stability and can be reused for degrading wastewater. The photocatalytic mechanism was studied. As shown in Fig. 8(b), the photocatalytic effect of tert-butanol (TBA) and triethanolamine (TEOA) was not significantly decreased in the pure g-C3N4 system. After the addition of benzoquinone (BQ), the degradation rate decreased from 66% to 21.3%, indicating that ·O2− is the main active species. In the g-C3N4/ZrO2 system, the photocatalytic effect was not significantly reduced after the addition of tert-butanol (TBA). After the addition of benzoquinone (BQ), the degradation rate decreased from 98.5% to 32.1%, and the degradation rate after adding triethanolamine reduced to 49%, indicating that ·O2− and h+ work together in the reaction process in the g-C3N4/ZrO2 system.
 |
| | Fig. 8 Photocatalytic cycle performance of 4:1 CN/ZrO2 (a) and reactant capture diagram (b). | |
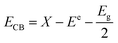
Further study on the changes of active species in the reaction process, in which the semiconductor VB and CB have the following formula:42
| |  | (2) |
E
e is a constant relative to the standard H electrode, its value is 4.5 eV, Eg is the band gap, X is the absolute electronegativity, and X values of g-C3N4 and ZrO2 are 4.73 eV and 5.91 eV, respectively.31,45,46EVB values of g-C3N4 and ZrO2 were calculated to be 1.64 eV and 3.86 eV, respectively, and ECB values were −1.18 eV and −1.05 eV. EVB values of g-C3N4 and ZrO2 are lower than the potentials of ·OH/H2O (+1.99 eV) and ·OH/OH− (+2.68 eV), so H2O and OH− cannot be oxidized to ·OH by valence band holes. Therefore, ·OH is not an active species in the system. The potential of O2/·O2− is −0.33 eV, which is higher than ECB values of g-C3N4 and ZrO2, so O2 can be reduced to ·O2−, and the RhB is degraded by strong reduction of ·O2−. In the CN/ZrO2 system, electrons in g-C3N4 are excited from VB to CB under visible light irradiation, thereby generating holes in the VB of the semiconductor. Due to the difference in CB potential, the photogenerated electrons on the surface of g-C3N4 easily migrate to the CB of ZrO2, while the holes remain on the VB of g-C3N4. The forbidden band energy of ZrO2 is too large, and the energy of visible light is not enough to excite electrons on the valence band to the conduction band. The electrons transferred from g-C3N4 on the ZrO2 conduction band will not jump to the valence band. This can be considered as a single transfer mechanism.47 The system can effectively improve the separation of photogenerated electron–hole pairs, greatly reducing the possibility of charge recombination, resulting in high photocatalytic activity of CN/ZrO2 composites. It can be seen from the above PL, photocurrent and catalytic performance that the recombination of electron–hole pairs is suppressed, and the direct oxidation ability of holes is greatly improved, so that h+ and ·O2− are collectively active species in the CN/ZrO2 system. From the mechanism diagram (Fig. 9), the interface between g-C3N4 and ZrO2 greatly affects the separation efficiency of electron–hole pairs. If a large amount of ZrO2 is present, the contact area is reduced, thereby reducing the separation efficiency and further reducing the photocatalytic performance. Therefore, the optimal ratio of CN/ZrO2 composite material exists. The specific process of catalytic degradation of RhB by CN/ZrO2 composites is as follows:
| |  | (4) |
| | | g-C3N4(e− + h+) → ZrO2(e− + h+)/g-C3N4(e− + h+) | (5) |
| | | ·O−2/h+ + RhB → degradation products | (7) |
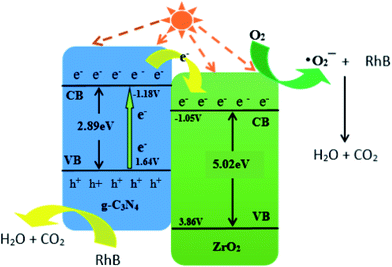 |
| | Fig. 9 Catalytic mechanism diagram of CN/ZrO2 composites. | |
4. Conclusion
The high catalytic activity of CN/ZrO2 composite photocatalyst was obtained by directly calcining the mixture of g-C3N4 and ZrO2 precursor. Among them, 4:1 CN//ZrO2 exhibited the highest degradation of RhB under visible light. The final catalytic efficiency can reach 98.5%. This is because the combination of g-C3N4 and ZrO2 reduces the charge transfer resistance and effectively suppresses the recombination of electron–hole pairs, thereby improving the photocatalytic activity. At the same time, the cycle test shows that the prepared catalyst has good stability and can be reused many times, so this catalyst has broad application prospects in solving environmental pollution.
Conflicts of interest
There are no conflicts to declare.
Acknowledgements
This work was supported by the Natural Science Foundation of Shandong Province of China (No. ZR2019MEM020, No. ZR2017LEM004), the Fundamental Research Funds for the Central Universities of China (No. 18CX02091A) and the Open Fund (No. OGE201702-07) of Key Laboratory of Oil & Gas Equipment, Ministry of Education (Southwest Petroleum University).
References
- F. E. Osterloh, Chem. Soc. Rev., 2013, 42, 2294–2320, 10.1039/c2cs35266d.
- Y. Qu and X. Duan, Chem. Soc. Rev., 2013, 42, 2568–2580, 10.1039/C2CS35355E.
- Y. Hou, Z. Wen, S. Cui, S. Ci, S. Mao and J. Chen, Adv. Funct. Mater., 2015, 25, 872–882, DOI:10.1002/adfm.201403657.
- M. Li, W. Luo, D. Cao, X. Zhao, Z. Li and T. Yu, Angew. Chem. Int. Ed., 2013, 52, 11016–11020, DOI:10.1002/anie.201305350.
- Y. Li, T. Takata, D. Cha, K. Takanabe, T. Minegishi and J. Kubota, Adv. Mater., 2013, 25, 125–131, DOI:10.1002/adma.201202582.
- Y. Li, H. Zhang, P. Liu, D. Wang, Y. Li and H. Zhao, Small, 2013, 9, 3336–3344, DOI:10.7150/jca.16961.
- Y. S. Jun, E. Z. Lee, X. Wang, W. H. Hong, G. D. Stucky and A. Thomas, Adv. Funct. Mater., 2013, 23, 3661–3667 CrossRef CAS.
- K. Sridharan, E. Jang and T. J. Park, Appl. Catal. B Environ., 2013, 142, 718–728, DOI:10.1007/s11664-015-4280-9.
- L. Hairui, L. Man, Y. Jien, H. Chunjie, S. Jun and Z. Haifa, Mater. Res. Bull., 2018, 10619–10627, DOI:10.1016/j.materresbull.2018.05.026.
- M. Zeng, Y. Z. Li, M. Y. Mao, J. L. Bai and L. R. X. J. Zhao, ACS Catal., 2015, 5, 3278–3286, DOI:10.1021/acscatal.5b00292.
- J. M. Wu and T. K. Wei, J. Phys. Chem. C, 2015, 119, 1433–1441, DOI:10.1021/jp510259j.
- J. Su, L. Guo, N. Bao and C. A. Grimes, Nano Lett., 2011, 11, 1928–1933, DOI:10.1021/nl2000743.
- T. Ohno, M. Akiyoshi, T. Umebayashi, K. Asai, T. Mitsui and M. Matsumura, Appl. Catal., A, 2004, 265, 115–121, DOI:10.1016/j.apcata.2004.01.007.
- R. A. Senthil, J. Theerthagiri, A. Selvi and J. Madhavan, Opt. Mater., 2017, 64, 533–539, DOI:10.1016/j.optmat.2017.01.025.
- X. Wang, K. Maeda, A. Thomas, K. Takanabe, G. Xin and J. M. Carlsson, Nat. Mater., 2009, 8, 76–80, DOI:10.1038/nmat2317.
- Z. W. Zhao, Y. J. Sun and F. Dong, Nanoscale, 2014, 7, 15–37, 10.1039/C4NR03008G.
- J. Xu, H. T. Wu, X. Wang, B. Xue, Y. X. Li and Y. Cao, Phys. Chem. Chem. Phys., 2013, 15, 4510–4517, 10.1039/C3CP44402C.
- G. Liao, S. Chen, X. Quan, H. T. Yu and H. M. Zhao, J. Mater. Chem., 2012, 22, 2721–2726, 10.1039/C1JM13490F.
- J. Hong, X. Xia, Y. Wang and R. Xu, J. Mater. Chem., 2012, 22, 15006–15012, 10.1039/C2JM32053C.
- X. Wang, K. Maeda, A. Thomas, K. Takanabe, G. Xin and J. M. Carlsson, Nat. Mater., 2009, 8, 76–80, DOI:10.1038/nmat2317.
- M. Fan, C. Song, T. Chen, Y. Xu, D. Xu and G. Wei, RSC Adv., 2016, 6, 34633–34640, 10.1039/c5ra27755h.
- Y. S. C. Yan, Z. S. Li and Z. G. Zou, Langmuir, 2010, 26, 3894–3901, DOI:10.1021/la904023j.
- X. C. Wang, K. Maeda, X. F. Chen, K. Takanabe, K. Domen, Y. D. Hou, X. Z. Fu and M. Antonietti, J. Am. Chem. Soc., 2009, 131, 1680–1691, DOI:10.1021/ja809307s.
- Y. Meng, J. Shen, D. Chen and G. Xin, Rare Met., 2011, 30, 276–279, DOI:10.1007/s12598-011-0284-7.
- T. Li, L. Zhao, Y. He, J. Cai, M. Luo and J. Lin, Appl. Catal. B Environ., 2013, 129, 255–263, DOI:10.1016/j.apcatb.2012.09.031.
- Y. M. He, J. Cai, L. H. Zhang, X. X. Wang, H. J. Lin, B. T. Teng, L. H. Zhao, W. Z. Weng, H. L. Wan and M. H. Fan, Ind. Eng. Chem. Res., 2012, 53, 5905–5915, DOI:10.1021/ie4043856.
- Y. Zang, L. Li, Z. Ying, H. Lin, G. Li and X. Guan, RSC Adv., 2013, 3, 13646–13650, 10.1039/C3RA41982G.
- P. He, L. Song, S. Zhang, X. Wu and Q. Wei, Mater. Res. Bull., 2014, 51, 432–437, DOI:10.1016/j.materresbull.2013.12.064.
- X. Wang, J. Chen, X. Guan and L. Guo, Int. J. Hydrogen Energy, 2015, 40, 7546–7552, DOI:10.1016/j.ijhydene.2014.11.055.
- J. Lv, K. Dai and J. Zhang, Sep. Purif. Technol., 2017, 178, 6–17 CrossRef CAS.
- X. Wang, L. Zhang, H. Lin, Q. Nong, W. Ying and T. Wu, RSC Adv., 2014, 4, 40029–40035, 10.1039/C4RA06035K.
- Y. Hong, C. Li, G. Zhang, Y. Meng, B. Yin and Y. Zhao, Chem. Eng. J., 2016, 299, 74–84, DOI:10.1016/j.cej.2016.04.092.
- F. Dong, Z. Wang, Y. Sun, W. K. Ho and H. Zhang, J. Colloid Interface Sci., 2013, 401, 70–79, DOI:10.1016/j.jcis.2013.03.034.
- H. J. Yan and H. X. Yang, J. Alloys Compd., 2011, 509, 26–29, DOI:10.1016/j.jallcom.2010.09.201.
- X. Gao, Y. Q. Zhang, J. Sun and F. K. Shao, Appl. Catal. Gen., 2013, 466, 233–239 CrossRef.
- H. Liu, S. A. Cheng, M. Wu, H. J. Wu, J. Q. Zhang and W. Z. Li, J. Phys. Chem. A, 2000, 104, 7016–7020, DOI:10.1021/jp000171q.
- C. Y. Feng, Y. C. Deng, L. Tang, G. M. Zeng, J. J. Wang, J. F. Yu, Y. N. Liu, B. Peng, H. P. Feng and J. J. Wang, Appl. Catal., B, 2018, 239, 525–536, DOI:10.1016/j.apcatb.2018.08.049.
- C. Y. Feng, L. Tang, Y. C. Deng, G. M. Zeng, J. J. Wang, Y. N. Liu, Z. M. Chen, J. F. Yu and J. J. Wang, Appl. Catal.,
B, 2019, 256, 117827, DOI:10.1016/j.apcatb.2018.08.049.
- X. Wu, S. Yin, B. Liu, M. Kobayashi, M. Kakihana and T. Sato, J. Mater. Chem. A, 2014, 2, 20832–20840, 10.1039/C4TA04132A.
- J. Luo, G. Dong, Y. Zhu, Z. Yang and C. Wang, Appl. Catal. B Environ., 2017, 214, 46–56 CrossRef CAS.
- S. V. Prabhakar Vattikuti, P. A. Kumar Reddy, J. Shim and C. Byon, ACS Omega, 2018, 3, 7587–7602, DOI:10.1021/acsomega.8b00471.
- J. Luo, X. Zhou, L. Ma and X. Xu, RSC Adv., 2015, 5, 68728–68735, 10.1039/C5RA10848A.
- P. C. Nagajyothi, M. Pandurangan, S. V. P. Vattikuti, C. O. Tettey, T. V. M. Sreekanth and J. Shim, Sep. Purif. Technol., 2017, 188, 228–237 CrossRef CAS.
- S. V. Prabhakar Vattikuti, P. A. Kumar Reddy, J. Shim and C. Byon, Appl. Surf. Sci., 2018, 447, 740–756, DOI:10.1016/j.apsusc.2018.04.040.
- S. Chen, Y. Hu, S. Meng and X. Fu, Appl. Catal. B Environ., 2014, 150–151, 564–573, DOI:10.1016/j.apcatb.2013.12.053.
- K. Huang, C. Liu, X. Yan, C. Y. Huang, J. B. Chen, M. Y. Chen, W. D. Shi and C. B. Liu, Crystengcomm, 2016, 18, 6453–6463, DOI:10.1016/j.seppur.2017.07.026.
- L. Tang, C. Y. Feng, Y. C. Deng, G. M. Zeng, J. J. Wang, Y. N. Liu, H. P. Feng and J. J. Wang, Appl. Catal., B, 2018, 230, 102–114, DOI:10.1016/j.apcatb.2018.02.031.
|
| This journal is © The Royal Society of Chemistry 2020 |
Click here to see how this site uses Cookies. View our privacy policy here. 
 Open Access Article
 This Open Access Article is licensed under a Creative Commons Attribution-Non Commercial 3.0 Unported Licence
 *,
Xiaoli
Yin
,
Yan
Zhao
and
Wei
Xiong
*,
Xiaoli
Yin
,
Yan
Zhao
and
Wei
Xiong