 Open Access Article
An ultrasonic-assisted synthesis of rice-straw-based porous carbon with high performance symmetric supercapacitors†
Guolang Zhoua,
Jingzhou Yin *ab,
Zechun Suna,
Xiaoliang Gaoa,
Fengxia Zhu
 *a,
Pusu Zhaoa,
Rongqing Lia and
Jiaying Xu*bc
aJiangsu Key Laboratory for the Chemistry of Low-Dimensional Materials, School of Chemistry and Chemical Engineering, Huaiyin Normal University, Huai'an 223001, P. R. China. E-mail: jingzhouyin@hytc.edu.cn; zhufengxia501@163.com
bState Key Laboratory of Coordination Chemistry, School of Chemistry and Chemical Engineering, Nanjing University, Nanjing 210093, P. R. China
cSchool of Chemistry and Chemical Engineering, Yancheng Institute of Technology, Yancheng 224051, P. R. China. E-mail: xujiaying-1984@163.com
First published on 17th January 2020
Abstract
Biomass porous carbon materials are ideal supercapacitor electrode materials due to their low price, rich source of raw materials and environmental friendliness. In this study, an ultrasonic-assisted method was applied to synthesize the rice-straw-based porous carbon (UPC). The obtained UPC exhibited a two-dimensional structure and high specific surface area. In addition, the electrochemical test results showed that the UPC with a 1 hour ultrasonic treatment and lower activation temperature of 600 °C (UPC-600) demonstrated optimal performance: high specific capacitances of 420 F g−1 at 1.0 A g−1 and 314 F g−1 at a high current of 10 A g−1. Significantly, the symmetric supercapacitors showed a high energy density of 11.1 W h kg−1 and power density of 500 W kg−1. After 10![[thin space (1/6-em)]](https://www.rsc.org/images/entities/char_2009.gif) 000 cycles, 99.8% of the specific capacitance was retained at 20 A g−1. These results indicate that UPC-600 is a promising candidate for supercapacitor electrode materials.
000 cycles, 99.8% of the specific capacitance was retained at 20 A g−1. These results indicate that UPC-600 is a promising candidate for supercapacitor electrode materials.
1. Introduction
With the increase in the consumption of fossil fuels and environmental pollution, renewable and clean energy sources have attracted great attention.1–4 However, since renewable and clean energy sources (for example, solar and wind energy) depend heavily on weather, the development of safe, cheap and efficient energy storage and conversion devices is urgently needed. In recent years, supercapacitors have attracted extensive attention owing to their environmental friendliness, long service life, high power density and short charging time.5–8 Supercapacitors can be classified as electrochemical double layer capacitors and pseudocapacitors.9 Many electrode materials of pseudocapacitors have been synthesized, such as metal oxides,10,11 hydroxides,12 and conductive polymers.13Carbon materials with large specific surface areas, good conductivity and high stability are considered the best electrode materials in electrochemical double layer capacitors.14–21 Among them, biomass-activated carbon has been widely studied due to its wide source of raw materials, sustainability and environmental friendliness.22–24 The specific surface and pore size can greatly affect the performance of biomass-activated carbon. At present, the main preparation methods of biomass-activated carbon include direct heating carbonization, hydrothermal carbonization and carbonization-activation.25–27 The biomass-activated carbon prepared by direct thermal carbonization or hydrothermal carbonization has small specific surface area, small pore diameter and low capacitance, which are not suitable for the preparation of high-performance electrode materials for double-layer supercapacitors. However, the carbonization activation method of pre-carbonization and subsequent activation by adding an activator can effectively solve the problems.28 In order to obtain high performance activated carbon, the activation process usually requires an ultra-high temperature, which consumes a lot of energy. It is important to study how to reduce the activation temperature and enhance the performance. Rice straw comes from the stalk of ripened rice crops. In rural areas, a large amount of accumulated straw occupies cultivated land, which will pollute the environment if burned.29 Thus, the secondary utilization of rice straw is very important for agriculture and environment.30,31 Rice straw has a large amount of lignin, crude fiber and inorganic salt, which can produce a large number of pores in the process of thermal carbonization and chemical activation. In addition, the low price provides a rich source of raw materials for high-performance activated carbon.
Ultrasound is a type of sound wave with a frequency higher than 20![[thin space (1/6-em)]](https://www.rsc.org/images/entities/char_2009.gif) 000 Hz. When the ultrasound propagates in the reaction system, many ultrasonic effects including the acoustic cavitation effect, heating and chemical effects, and mechanical effects can affect the reaction process. Ultrasonic treatment can enhance the solid–liquid heterogeneous reaction rate by mixing the reactants uniformly and accelerating the spread of reactants and products.32–34 Compared with relevant published literature, there are few available reports on the use of the ultrasonic-assisted method for the synthesis of biochar. The activation temperature is usually above 700 °C.35 It is necessary to employ a new process to lower the activation temperature for saving energy.
000 Hz. When the ultrasound propagates in the reaction system, many ultrasonic effects including the acoustic cavitation effect, heating and chemical effects, and mechanical effects can affect the reaction process. Ultrasonic treatment can enhance the solid–liquid heterogeneous reaction rate by mixing the reactants uniformly and accelerating the spread of reactants and products.32–34 Compared with relevant published literature, there are few available reports on the use of the ultrasonic-assisted method for the synthesis of biochar. The activation temperature is usually above 700 °C.35 It is necessary to employ a new process to lower the activation temperature for saving energy.
In this study, an ultrasonic-assisted method was used to convert cheap rice straw into high-performing activated carbon at a lower activation temperature. The obtained UPC exhibited ultra-stability for symmetric supercapacitors, with 99.8% retention of its specific capacitance after 10![[thin space (1/6-em)]](https://www.rsc.org/images/entities/char_2009.gif) 000 cycles of charging and discharging at 20 A g−1.
000 cycles of charging and discharging at 20 A g−1.
2. Experimental section
2.1 Materials
Rice straw was collected from a farmland in Huai'an, Jiangsu Province, China. Phosphoric acid (30%) and sodium hydroxide were purchased from Aladdin Chemical Reagent Co., Ltd and used without further purification.2.2 Synthesis
Pre-carbonation: the rice straw was first washed, dried, crushed, screened through a mesh of size 80, and then heated under a nitrogen atmosphere at a heating rate of 10 °C min−1 at 500 °C for 2 h. After naturally cooling to room temperature, the pre-carbonized product (labeled as PSC) was obtained.Alkali activation: first, 0.2 g of PSC and 0.4 g of NaOH were mixed in 100 mL of deionized water under ultrasound treatment (40 W) for different periods of time. The resulting samples were then dried at 100 °C for 6 h. The dried samples were calcined under nitrogen atmosphere for 2 h at a heating rate of 10 °C min−1. The final products were washed using diluted phosphoric acid to neutral and dried at 100 °C for 6 h. The samples with different calcination temperatures of 500 °C, 600 °C and 700 °C were labeled as UPC-500, UPC-600 and UPC-700, respectively.
2.3 Characterization
The crystalline phase of the UPC samples were characterized via X-ray diffraction (XRD, X'Pert3 Powder). The sample morphology was studied using a scanning electron microscope (SEM, FEI Quanta 450). Nitrogen adsorption and desorption isotherms were tested on a Micrometrics ASAP 2020 Plus analyzer with the specific surface area and pore size distribution determined via the Brunauer–Emmett–Teller (BET) method and Barrett–Joyner–Halenda (BJH) model (desorption branch of the isotherms), respectively. Raman spectra were recorded on a Raman microscope (Thermo Fisher Scientific, DXR). X-ray photoelectron spectroscopy (XPS) was performed on a Multilab 2000 XPS system. Micromeritic ASAP 2420 was used to obtain the nitrogen adsorption–desorption isotherms.2.4 Electrochemical measurements
The electrode was prepared by the following procedure: the as-prepared UPC samples, acetylene black and polytetrafluoroethylene were blended in an agate mortar in a mass ratio of 8![[thin space (1/6-em)]](https://www.rsc.org/images/entities/char_2009.gif) :
:![[thin space (1/6-em)]](https://www.rsc.org/images/entities/char_2009.gif) 1
1![[thin space (1/6-em)]](https://www.rsc.org/images/entities/char_2009.gif) :
:![[thin space (1/6-em)]](https://www.rsc.org/images/entities/char_2009.gif) 1, and then a few drops of ethanol were added and ground to form a paste. The paste was uniformly coated on a 10 mm × 10 mm nickel foam sheet. After vacuum drying at 70 °C, the electrode was kept at 10 MPa pressure for 3 min, and then pressed into a thin slice electrode. The UPC electrode was used as the working electrode, a Pt electrode as the counter electrode and a saturated calomel electrode as the reference electrode. The electrochemical performance was tested on a CHI660E electrochemical station using a three-electrode system with an electrolyte of 6 M KOH. For the three-electrode system, the specific capacitance was calculated using the following formula:36
1, and then a few drops of ethanol were added and ground to form a paste. The paste was uniformly coated on a 10 mm × 10 mm nickel foam sheet. After vacuum drying at 70 °C, the electrode was kept at 10 MPa pressure for 3 min, and then pressed into a thin slice electrode. The UPC electrode was used as the working electrode, a Pt electrode as the counter electrode and a saturated calomel electrode as the reference electrode. The electrochemical performance was tested on a CHI660E electrochemical station using a three-electrode system with an electrolyte of 6 M KOH. For the three-electrode system, the specific capacitance was calculated using the following formula:36| Celectrode = IΔt/mΔV | (1) |
A two-electrode test method was used for the symmetrical supercapacitor assembled in a CR2032 stainless coin-type cell. Cyclic voltammetry (CV) curves and galvanostatic charge/discharge (GCD) data were obtained under the voltage window of 0–1.0 V in 6 M KOH at different current densities. For a two-electrode system, the specific capacitance was calculated using eqn (2):
| Cdevice = 4IΔt/mΔV | (2) |
The energy density and power density were calculated through the following equations:37–39
| E = 0.5 × (0.25 × CdeviceΔV2)/3.6 | (3) |
| P = 3600E/Δt | (4) |
3. Results and discussion
3.1 Material characterization
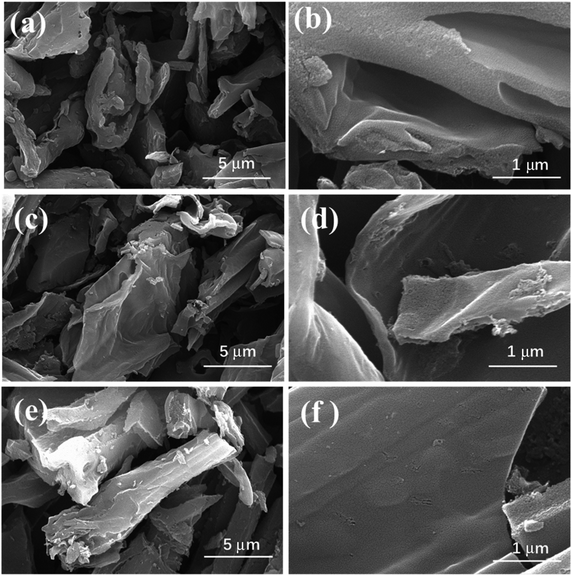
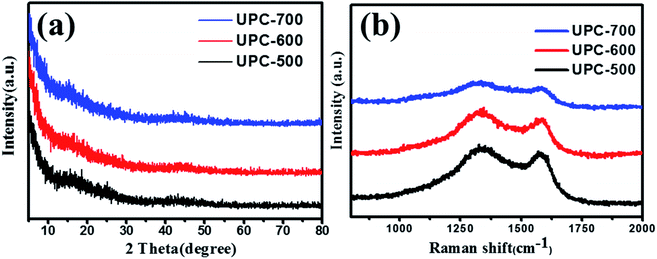
The SEM images of the UPC samples are shown in Fig. 1. The samples prepared at different temperatures all contained sheet-like structures with rough surfaces and macropores. The surface roughness of the porous carbon increased with the increase in temperature. The XRD patterns of the three UPC samples prepared at different activation temperatures are shown in Fig. 2a. All XRD patterns of the three samples showed no sharp peaks, indicating the weak crystallization of the three samples. Weak peaks at 23° and 42° correspond to the (002) and (100) planes of graphitic carbon, respectively.40 The obvious intensity in the low angle area indicates the presence of a large number of micropores.41Raman spectra of the obtained materials are displayed in Fig. 2b. The two prominent peaks at about 1340 cm−1 (D band, disordered carbon) and 1590 cm−1 (G band, graphitic carbon) indicate the disordered and graphitic structure of the carbon materials, respectively. The ID/IG values (the intensity ratio of D band and G band) were different with different activation temperatures, and the ID/IG value of UPC-600 (1.11) was the highest (the ID/IG values of UPC-500 and UPC-700 were 1.09 and 1.044, respectively), indicating that the sample UPC-600 has more disordered defect structures.42,43
The specific surface and pore diameter distribution of UPC are analyzed by N2 adsorption and desorption isotherms (Fig. 3a and b). As can be seen from Fig. 3a, the adsorption–desorption isotherm of UPC-700 increased sharply when the relative pressure (P/P0) was less than 0.2, while the adsorption–desorption isotherms of UPC-600 and UPC-500 gradually became stable. A significant desorption hysteresis loop occurred between 0.5 and 0.7 relative pressure (P/P0). According to IUPAC classification, these curves belong to the type IV isotherm, indicating that the active carbon mainly contained micropores and mesopores,44 which were conducive to improving the performance of the supercapacitors.25 As can be seen from Table S1,† the BET specific surface area of the sample increased with the increase in the activation temperature. Although the specific surface area of the sample UPC-700 was larger than those of UPC-500 and UPC-600, the average pore diameter (2.19 nm) of UPC-600 was higher than those of UPC-500 and UPC-700. The average pore size of UPC-600 was 2.19 nm, which contained micropores and mesopores. Both micropores and mesopores are important for electrode applications because they have different roles with respect to fast charge transfer and the double layer formation of electrolyte ions in the networks of electrode pores.45 The diameter of 2.19 nm was a suitable pore diameter for electrolyte ions to enter the electrode material. Simultaneously, the microporous area also reached the maximum value at 600 °C. One possible reason is that the micropores can be destroyed easily at higher temperatures, and not yet fully formed at lower temperatures. The large micropore area increases the active sites, which is beneficial for improving the performance of the supercapacitor.
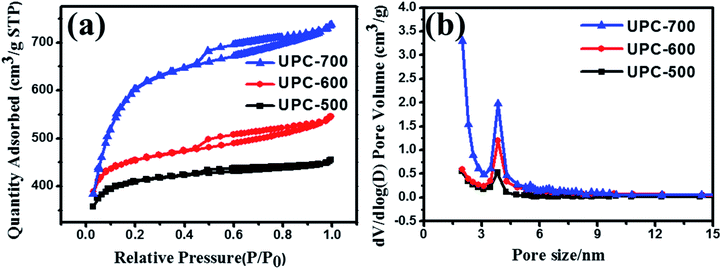 | ||
| Fig. 3 (a) Pore-size distributions and (b) N2 adsorption–desorption isotherms of UPC-500, UPC-600 and UPC-700. | ||
XPS is an important means to study the element composition on the material surface. As displayed in Fig. 4a, the three UPC products all showed strong C 1s and weak O 1s signals. The XPS results show that the sample was mainly carbon with a small amount of oxygen. In addition to a large amount of C and O, the UPC samples also contained a small amount of Si, N and S. The contents of C, O, Si, N and S elements in the UPC samples are shown in Table S2.† After heat treatment, strong alkali activation at high temperatures and acid washing, most of the silica and other impurities in the samples were almost removed or converted to carbon. The contents of C and O were both close to 98% (atomic%) in the UPC-600 sample. In order to study the state of the carbon element in the materials, the C 1s region was fitted (Fig. 4b), and the results showed that there were three binding modes of carbon atoms, namely, C–C (284.7 eV), C–N (285.36 eV) and C–O (286.5 eV), in which C–C and C–O were the main existing forms. In order to further study the functional groups of oxygen, the fitting of the O 1s region (Fig. 4c) showed that oxygen mainly existed in three forms, C–O (532.2 eV), C![[double bond, length as m-dash]](https://www.rsc.org/images/entities/char_e001.gif) O (533.2 eV) and COOH (534.3 eV). The existence of these oxygen-bearing structures can enhance the surface wettability of the activated carbon and increase the contact between the electrolyte and electrode materials. Simultaneously, these oxygen-containing functional groups will also have a redox reaction in the charging and discharging process, further enhancing the capacitance performance.40,46 Fig. 4d shows the Si 2p peak at 104 eV, corresponding to the Si–O bond.47
O (533.2 eV) and COOH (534.3 eV). The existence of these oxygen-bearing structures can enhance the surface wettability of the activated carbon and increase the contact between the electrolyte and electrode materials. Simultaneously, these oxygen-containing functional groups will also have a redox reaction in the charging and discharging process, further enhancing the capacitance performance.40,46 Fig. 4d shows the Si 2p peak at 104 eV, corresponding to the Si–O bond.47
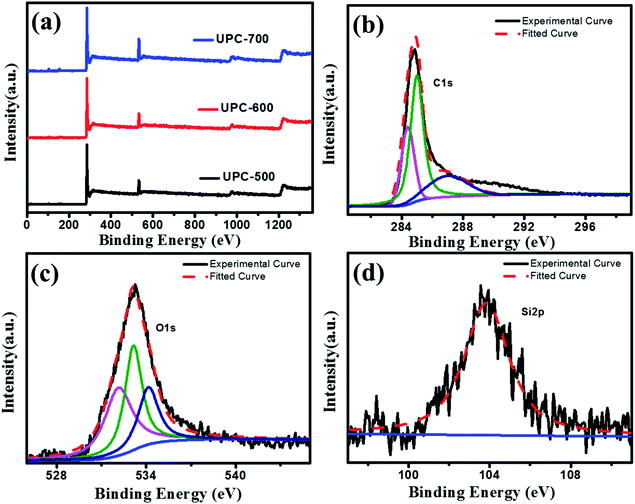 | ||
| Fig. 4 (a) XPS full spectra of UPC-500, UPC-600 and UPC-700 (b) C 1s spectra of UPC-600, (c) O 1s spectra of UPC-600 and (d) Si 2p spectra of UPC-600. | ||
3.2 The process of the ultrasonic treatment
The scheme of the ultrasonic treatment mechanism in the formation of the porous carbon is shown in Scheme 1. Under ultrasound irradiation, the dissolved NaOH can easily diffuse into the micropores or the deeper of the pre-carbonized rice straw. As the temperature increases, NaOH would react with carbon more efficiently to create mesopores or micropores, and finally form porous carbon with a high surface area. The controlled experiments were done to investigate the effects of ultrasonic treatment on the performance of the UPC samples at 600 °C. Fig. 5 shows the specific capacitance of UPC-600 with different sonication times at various currents. The electrochemical test results show that the sample under the ultrasonic treatment for 1 h exhibits the optimal performance. The result shows that the ultrasonic treatment is an effective way to improve the electrochemical performance of the UPC samples. The longer or shorter time is adverse to improving the electrochemical performance. One possible reason is that extra NaOH diffused into the interior of the pre-carbonized particles, and that the formed pores were destroyed by the extra NaOH from etching at high temperatures.35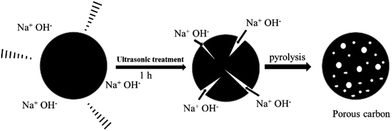 | ||
| Scheme 1 Schematic illustrating the mechanism of the formation of porous carbon via ultrasonic-assisted method. | ||
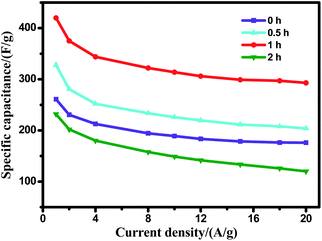 | ||
| Fig. 5 The specific capacitance of the UPC samples under different ultrasonic treatment time periods with current densities ranging from 1 to 20 A g−1. | ||
3.3 Electrochemical properties (three electrode system)
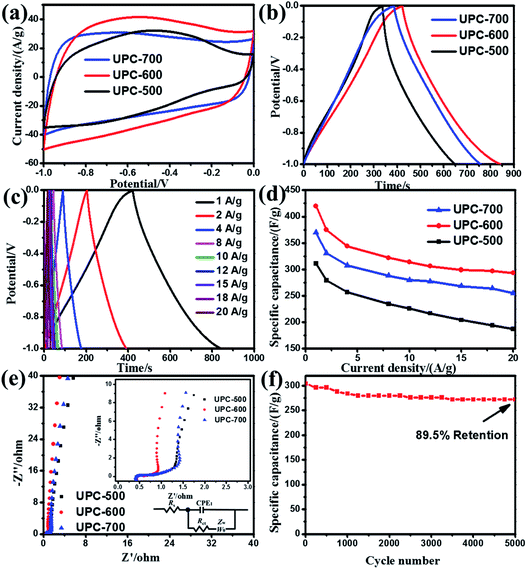
The performance of the UPC products obtained at different temperatures for the supercapacitor electrode was studied by CV, GCD (−1.0 to 0 V) and EIS. Fig. 6a shows the CV curves of the three UPC products at a scan rate of 100 mV s−1. The area enclosed by the CV curves can reflect the size of the specific capacitance. The area of the UPC-600 CV curves is significantly larger than that of the UPC-500 and UPC-700 samples, indicating the highest specific capacitance of the UPC-600 sample. This result can be further confirmed by the GCD results at 1.0 A g−1 (Fig. 6b). According to eqn (1), the specific capacitances of the UPC-500, UPC-600 and UPC-700 samples were 311, 420 and 370 F g−1 at 1.0 A g−1, respectively. UPC-600 exhibited the longest discharge time and the highest specific capacitance. The GCD curves of the UPC-600 sample under different current densities are shown in Fig. 6c. The specific capacitances of the UPC-600 electrode were 420, 375, 344, 322, 314, 306, 299, 297 and 293 F g−1 at current densities of 1, 2, 4, 8, 10, 12, 15, 18 and 20 A g−1, respectively. Celectrode maintained 70% of the capacitance at 1 A g−1 after a 20-fold increase in the current density, demonstrating a good rate capability of the UPC electrode. The GCD curves showed a symmetrical isosceles triangle shape. No charging and discharging plateaus are observed, indicating that the curves mainly represented double-layer capacitors. Fig. 6d shows the specific capacitance of the three UPC products at various current densities. The specific capacitance presented the following relationship, UPC-600 > UPC-700 > UPC-500, which is consistent with the test results shown in Fig. 6b. In general, a higher surface area is beneficial to improving the electrochemical properties of the UPC samples. The specific capacitance of the UPC samples is also influenced by other factors, such as the pore diameter, surface structure and surface composition. Although the UPC-700 sample has a higher surface area, the carbon content on the surface is lower than that of UPC-600 (Table S2†). This is the possible reason for UPC-700 having a larger surface, but a lower specific capacitance. Furthermore, the electrochemical impedance spectra of the three UPC electrodes are shown in Fig. 6e. In addition, the equivalent circuit used to fit the impedance spectra is shown in the set of Fig. 6e. The slope of UPC-600 in the low frequency region is greater than that of UPC-700 and UPC-500. The higher slope of the line indicates the lower ionic diffusion resistance in the active material. Therefore, the ion diffusion resistance in UPC-600 was lower, which may have caused the larger average pore size of UPC-600. This would provide a convenient channel for ion diffusion, while the high pore area could provide a larger active site.Cyclic stability is one of the important indices to evaluate the performance of supercapacitors. The cyclic stability of the UPC-600 sample was tested at 20 A g−1. Fig. 6f shows the cyclic stability of UPC-600. The specific capacitance of the product decreased sharply in the first 1000 cycles. It stabilized and remained constant after 1000 cycles. The specific capacitance remained at 89.5% after 5000 cycles. These results show that the cyclic stability of UPC-600 is excellent. In order to analyze the cause of the decrease in the specific capacitance, the impedances of the sample UPC-600 before and after cycling were tested. As shown in Fig. S1,† the slope in the low-frequency region clearly decreased after cycling, indicating that the diffusion resistance increased. This may occur because the micro-pores of the electrode material collapse as the cycle progresses. This would result in the difficulty of the electrolyte ions entering the electrode material, and thus result in the reduction of the specific capacitance. Compared with other biomass-derived activated carbon, UPC-600 has a higher specific capacitance and lower activation temperature. Table 1 shows the specific capacitance and activation temperature of sample UPC-600 and other biomass-derived activated carbon reported in recent years. The results showed that the ultrasonic treatment could reduce the activation temperature and obtain UPC with a high specific surface area.
| Biomass source | Activating agent | Activating temperature (°C) | Celectrode (F g−1) | Measurement conditions (A g−1) | Ref. |
|---|---|---|---|---|---|
| Bamboo | KOH | 900 | 293 | 0.5 | 39 |
| Tobacco waste | KOH | 800 | 148 | 0.5 | 48 |
| Fish gill | KOH | 800 | 334 | 2.0 | 49 |
| Albizia flowers | KOH | 900 | 406 | 0.5 | 4 |
| Corn stalk core | KOH | 700 | 140 | 1.0 | 22 |
| Baobab fruit shells | H3PO4 | 800 | 355.8 | 1.0 | 50 |
| Cotonier strobili | KOH | 800 | 346.1 | 1.0 | 51 |
| Ginkgo leaves | KOH | 900 | 374 | 0.5 | 40 |
| Peanut shell | ZnCl2/FeCl3 | 800 | 247.28 | 1.0 | 52 |
| Tea powder | KOH | 1200 | 167 | 1.0 | 53 |
| Loofah sponge | KOH | 800 | 309.6 | 1.0 | 28 |
| Willow catkins | KOH | 600 | 340 | 1.0 | 54 |
| Sakura | KOH | 750 | 265.8 | 0.2 | 55 |
| Rice-straw | NaOH | 600 | 420 | 1.0 | This work |
3.4 Electrochemical properties (two electrode system)
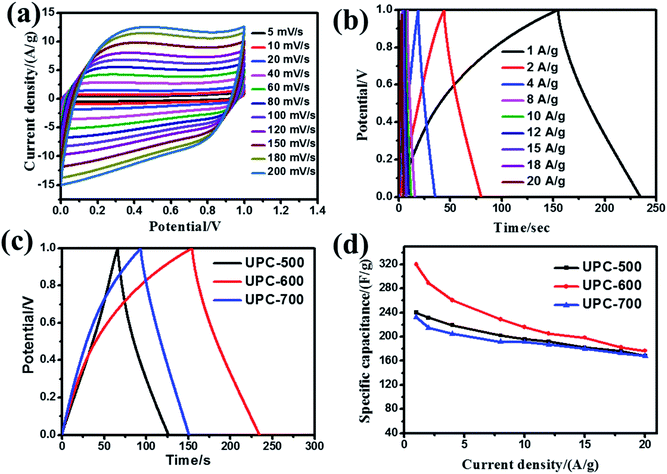
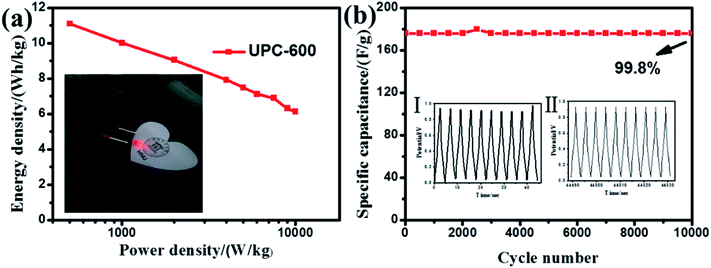
In practical applications, the electrochemical properties of the UPC products were estimated on a two-electrode system using UPC as both electrodes. The CV curves (Fig. 7a) of the UPC-600 sample exhibit quasi-rectangular shapes at a scan rate range from 5 to 200 mV s−1. The GCD curves of the UPC-600 product under different current densities are illustrated in Fig. 7b. The triangular shapes with good symmetry indicate the characteristics of a typical double-layer. Fig. 7c shows the GCD curves of the three UPC products at 1 A g−1. The charging and discharging time of UPC-600 is longer than those of UPC-500 and UPC-700. In addition, Fig. 7d shows the specific capacitance of the three UPC products under different current densities. According to eqn (2), when the current densities are 1, 2, 4, 8, 10, 12, 15, 18 and 20 A g−1, the specific capacitances are 320, 288.8, 260.8, 228.4, 216, 205.2, 198.6, 182 and 176.8 F g−1, respectively. The specific capacitances of UPC-500 and UPC-700 are close to each other under different current densities. The above results illustrate that the UPC-600 sample exhibits good capacitance performance under different current densities.From the GCD curve, the power density and energy density were further calculated, according to eqn (2)–(4). From Fig. 8a, when the power density was 500 W kg−1, the energy density reached 11.1 W h kg−1, according to eqn (3) and (4). In the illustration in Fig. 8a, we successfully lit the LED with a UPC-600-based symmetric supercapacitor. Simultaneously, the specific capacitance of the symmetric supercapacitor barely decayed (retaining 99.8% of the initial capacitance) after 10![[thin space (1/6-em)]](https://www.rsc.org/images/entities/char_2009.gif) 000 cycles at 20 A g−1 (Fig. 8b), indicating that UPC-600 had a high practical application value. The illustration showed that the shape of the curve did not change after the last 10 cycles.
000 cycles at 20 A g−1 (Fig. 8b), indicating that UPC-600 had a high practical application value. The illustration showed that the shape of the curve did not change after the last 10 cycles.
Table 2 shows the specific capacitance and cyclic stability of various biomass-based activated carbons measured with a two-electrode cell. Owing to the porous structure formed by ultrasonic activation, UPC-600 has ultra-high cycle stability compared with other UPC samples.
| Biomass source | Current density (A g−1) | Cycling stability (%) | Ref. |
|---|---|---|---|
| Bamboo | 1.0 | 91.8%/10![[thin space (1/6-em)]](https://www.rsc.org/images/entities/char_2009.gif) 000 000 |
39 |
| Loofah sponge | 1.0 | 81.3/10![[thin space (1/6-em)]](https://www.rsc.org/images/entities/char_2009.gif) 000 000 |
28 |
| Tea powder | 4.0 | 96/16![[thin space (1/6-em)]](https://www.rsc.org/images/entities/char_2009.gif) 000 000 |
53 |
| Ginkgo leaves | 4.0 | 77/2000 | 40 |
| Cotonier strobili | 1.0 | 84.21/10![[thin space (1/6-em)]](https://www.rsc.org/images/entities/char_2009.gif) 000 000 |
51 |
| Baobab fruit shells | 5.0 | 96.9/1000 | 50 |
| Corncob | 5.0 | 91/10![[thin space (1/6-em)]](https://www.rsc.org/images/entities/char_2009.gif) 000 000 |
56 |
| Xanthoceras seed | 10 | 86/5000 | 57 |
| Lentinus edodes | 5.0 | 90.3/10![[thin space (1/6-em)]](https://www.rsc.org/images/entities/char_2009.gif) 000 000 |
27 |
| Bamboo bagasse | 10.0 | 89/10![[thin space (1/6-em)]](https://www.rsc.org/images/entities/char_2009.gif) 000 000 |
58 |
| Rice straw | 20.0 | 99.8/10![[thin space (1/6-em)]](https://www.rsc.org/images/entities/char_2009.gif) 000 000 |
This work |
4. Conclusions
In summary, rice-straw-based porous carbon was successfully prepared via an ultrasonic-assisted method at a relatively low activation temperature. The obtained UPC-600 with a 1 hour ultrasonic treatment exhibited a high surface area of 1820.2 m2 g−1, high specific capacitance (420 F g−1) at 1.0 A g−1 and superior rate performance of 314 F g−1 at 10 A g−1. Significantly, the ultra-stable symmetric supercapacitor showed a high energy density of 11.1 W h kg−1 and power density of 500 W kg−1. After 10![[thin space (1/6-em)]](https://www.rsc.org/images/entities/char_2009.gif) 000 cycles of charging and discharging, the specific capacitance retained 99.8% at a high current density of 20 A g−1. These results show that the ultrasonic-assisted method is an effective way to lower the activation temperature and synthesize ultra-stable materials for symmetric supercapacitors.
000 cycles of charging and discharging, the specific capacitance retained 99.8% at a high current density of 20 A g−1. These results show that the ultrasonic-assisted method is an effective way to lower the activation temperature and synthesize ultra-stable materials for symmetric supercapacitors.
Conflicts of interest
There are no conflicts to declare.Acknowledgements
This work was supported by the National Natural Science Foundation of China (Grant no. 51872109 and 21201072), China Postdoctoral Science Foundation (Grant no. 2013T60517), the Natural Science Foundation of Jiangsu Province (Grant no. BK2012241), the Natural Science Foundation of the Jiangsu Higher Education Institutions of China (Grant no. 17KJA150002 and 18KJA150002), the State Key Laboratory of Coordination Chemistry (Grant no. SKLCC1916), and the Qinglan Project of Jiangsu Province of China.References
- C. Liu, F. Li, L. Ma and H. Cheng, Adv. Mater., 2010, 22, E28–E62 CrossRef PubMed.
- Z. Bi, Q. Kong, Y. Cao, G. Sun, F. Su, X. Wei, X. Li, A. Ahmad, L. Xie and C. Chen, J. Mater. Chem. A, 2019, 7, 16028–16045 RSC.
- A. Eftekhari, L. Li and Y. Yang, J. Power Sources, 2017, 347, 86–107 CrossRef.
- F. Wu, J. Gao, X. Zhai, M. Xie, Y. Sun, H. Kang, Q. Tian and H. Qiu, Carbon, 2019, 147, 242–251 CrossRef.
- G. Zhang, X. Xiao, B. Li, P. Gu, H. Xue and H. Pang, J. Mater. Chem. A, 2017, 5, 8155–8186 RSC.
- M. Suksomboon, P. Srimuk, A. Krittayavathananon, S. Luanwuthi and M. Sawangphruk, RSC Adv., 2014, 4, 56876–56882 RSC.
- J. Xu, H. Zhang, P. Xu, R. Wang, Y. Tong, Q. Lu and F. Gao, Nanoscale, 2018, 10, 13702–13712 RSC.
- S. Yang, S. Wang, X. Liu and L. Li, Carbon, 2019, 147, 540–549 CrossRef.
- Y. Wang, J. Guo, T. Wang, J. Shao, D. Wang and Y. W. Yang, Nanomaterials, 2015, 5, 1667–1689 CrossRef PubMed.
- Y. Li, X. Han, T. Yi, Y. He and X. Li, J. Energy Chem., 2019, 31, 54–78 CrossRef.
- W. Fu, X. Li, C. Zhao, Y. Liu, P. Zhang, J. Zhou, X. Pan and E. Xie, Mater. Lett., 2015, 149, 1–4 CrossRef.
- B. Dong, M. Li, S. Chen, D. Ding, W. Wei, G. Gao and S. Ding, ACS Appl. Mater. Interfaces, 2017, 9, 17890–17896 CrossRef PubMed.
- C. O. Baker, X. Huang, W. Nelson and R. B. Kaner, Chem. Soc. Rev., 2017, 46, 1510–1525 RSC.
- H. Lu and X. S. Zhao, Sustainable Energy Fuels, 2017, 1, 1265–1281 RSC.
- S. A. El-Khodary, G. M. El-Enany, M. El-Okr and M. Ibrahim, Electrochim. Acta, 2014, 150, 269–278 CrossRef.
- S. A. ElKhodary, G. M. ElEnany, M. ElOkr and M. Ibrahim, Synth. Met., 2017, 233, 41–51 CrossRef.
- H. Jia, J. Sun, X. Xie, K. Yin and L. Sun, Carbon, 2019, 143, 309–317 CrossRef.
- Z. Li, W. Lv, C. Zhang, B. Li, F. Kang and Q.-H. Yang, Carbon, 2015, 92, 11–14 CrossRef.
- H. Wang, H. Zhu, Y. Li, D. Qi, S. Wang and K. Shen, RSC Adv., 2019, 9, 29131–29140 RSC.
- J. Niu, R. Shao, M. Liu, J. Liang, Z. Zhang, M. Dou, Y. Huang and F. Wang, Energy Storage Mater., 2018, 12, 145–152 CrossRef.
- J. Niu, J. Liang, R. Shao, M. Liu, M. Dou, Z. Li, Y. Huang and F. Wang, Nano Energy, 2017, 41, 285–292 CrossRef.
- K. Yu, H. Zhu, H. Qi and C. Liang, Diamond Relat. Mater., 2018, 88, 18–22 CrossRef.
- A. Thambidurai, J. K. Lourdusamy, J. V. John and S. Ganesan, Korean J. Chem. Eng., 2014, 31, 268–275 CrossRef.
- J. Niu, R. Shao, M. Liu, Y. Zan, M. Dou, J. Liu, Z. Zhang, Y. Huang and F. Wang, Adv. Funct. Mater., 2019, 29, 1905095 CrossRef.
- W. Zhang, J. Wang, L. Bao, Z. Gao and J. Yu, Diamond Relat. Mater., 2019, 96, 231–236 CrossRef.
- T. Adinaveen, L. John Kennedy, J. Judith Vijaya and G. Sekaran, J. Mater. Cycles Waste Manag., 2014, 17, 736–747 CrossRef.
- D. Tang, Y. Luo, W. Lei, Q. Xiang, W. Ren, W. Song, K. Chen and J. Sun, Appl. Surf. Sci., 2018, 462, 862–871 CrossRef.
- X. Su, J. Chen, G. Zheng, J. Yang, X. Guan, P. Liu and X. Zheng, Appl. Surf. Sci., 2018, 436, 327–336 CrossRef.
- E. R. Abaidea, G. L. Dotto, M. V. Tres, G. L. Zabotb and M. A. Mazutti, Bioresource Technol, 2019, 284, 25–35 CrossRef.
- S. ZhiWei, S. Tao, D. WenJing and W. Jing, J. Environ. Manage., 2019, 243, 269–272 CrossRef.
- L. Liu, L. Wu, S. Knauth and T. Eickhorsta, J. Environ. Manage., 2019, 244, 415–421 CrossRef.
- F. Kokai, R. Sorin, H. Chigusa, K. Hanai, A. Koshio, M. Ishihara, Y. Koga, M. Hasegawa, N. Imanishi and Y. Takeda, Diamond Relat. Mater., 2012, 29, 63–68 CrossRef.
- G. Hu, X. Xie, Y. Cao, L. Xu, K. Du, W. Wang and Z. Peng, J. Alloy. Comp., 2019, 773, 1165–1171 CrossRef.
- P. Bai, S. Wei, X. Lou and L. Xu, RSC Adv., 2019, 9, 31447–31459 RSC.
- S. A. El-Khodary, A. E.-F. Abomohra, G. M. El-Enany, A. A. Aboalhassan, D. H. L. Ng, S. Wang and J. Lian, Ultrason. Sonochem., 2019, 58, 104617 CrossRef.
- A. S. Lemine, M. M. Zagho, T. M. Altahtamouni and N. Bensalah, Int. J. Energy Res., 2018, 42, 4284–4300 CrossRef.
- Y. Zhang, X. Xia, J. Kang and J. Tu, Chin. Sci. Bull., 2012, 57, 4215–4219 CrossRef.
- W. Sun, X. Rui, M. Ulaganathan, S. Madhavi and Q. Yan, J. Power Sources, 2015, 295, 323–328 CrossRef.
- G. Zhang, Y. Chen, Y. Chen and H. Guo, Mater. Res. Bull., 2018, 102, 391–398 CrossRef.
- X. Zhu, S. Yu, K. Xu, Y. Zhang, L. Zhang, G. Lou, Y. Wu, E. Zhu, H. Chen, Z. Shen, B. Bao and S. Fu, Chem. Eng. Sci., 2018, 181, 36–45 CrossRef.
- J. Chang, Z. Gao, X. Wang, D. Wu, F. Xu, X. Wang, Y. Guo and K. Jiang, Electrochim. Acta, 2015, 157, 290–298 CrossRef.
- X. Liu, C. Ma, J. Li, B. Zielinska, R. J. Kalenczuk, X. Chen, P. K. Chu, T. Tang and E. Mijowska, J. Power Sources, 2019, 412, 1–9 CrossRef.
- S. Cao, J. Yang, J. Li, K. Shi and X. Li, Diamond Relat. Mater., 2019, 96, 118–125 CrossRef CAS.
- M. Xu, Q. Yu, Z. Liu, J. Lv, S. Lian, B. Hu, L. Mai and L. Zhou, Nanoscale, 2018, 10, 21604–21616 RSC.
- R. Farma, M. Deraman, A. Awitdrus, I. A. Talib, E. Taer, N. H. Basri, J. G. Manjunatha, M. M. Ishak, B. N. Dollah and S. A. Hashmi, Bioresour. Technol., 2013, 132, 254–261 CrossRef CAS.
- M. Liu, J. Niu, Z. Zhang, M. Dou and F. Wang, Nano Energy, 2018, 51, 366–372 CrossRef CAS.
- Y. Fu, H. Du, S. Zhang and W. Huang, Mater. Sci. Eng., A, 2005, 403, 25–31 CrossRef.
- H. Chen, Y. Guo, F. Wang, G. Wang, P. Qi, X. Guo, B. Dai and F. Yu, New Carbon Mater., 2017, 32, 592–599 CrossRef.
- Y. Han, N. Shen, S. Zhang, D. Li and X. Li, J. Alloy. Comp., 2017, 694, 636–642 CrossRef CAS.
- A. A. Mohammed, C. Chen and Z. Zhu, J. Colloid Interface Sci., 2019, 538, 308–319 CrossRef CAS.
- X. Su, S. Li, S. Jiang, Z. Peng, X. Guan and X. Zheng, Adv. Powder Technol., 2018, 29, 2097–2107 CrossRef CAS.
- F. Guo, X. Jiang, X. Jia, S. Liang, L. Qian and Z. Rao, J. Electroanal. Chem., 2019, 844, 105–115 CrossRef CAS.
- X. Song, X. Ma, Y. Li, L. Ding and R. Jiang, Appl. Surf. Sci., 2019, 487, 189–197 CrossRef CAS.
- K. Wang, N. Zhao, S. Lei, R. Yan, X. Tian, J. Wang, Y. Song, D. Xu, Q. Guo and L. Liu, Electrochim. Acta, 2015, 166, 1–11 CrossRef CAS.
- F. Ma, S. Ding, H. Ren and Y. Liu, RSC Adv., 2019, 9, 2474–2483 RSC.
- D. Wang, Z. Geng, B. Li and C. Zhang, Electrochim. Acta, 2015, 173, 377–384 CrossRef CAS.
- Y. Zhang, S. Li, Z. Tang, Z. Song and J. Sun, Diamond Relat. Mater., 2019, 91, 119–126 CrossRef CAS.
- S. S. Gunasekaran, S. K. Elumalali, T. K. Kumaresan, R. Meganathan, A. Ashok, V. Pawar, K. Vediappan, G. Ramasamy, S. Z. Karazhanov, K. Raman and R. Subashchandra Bose, Mater. Lett., 2018, 218, 165–168 CrossRef CAS.
Footnote |
| † Electronic supplementary information (ESI) available. See DOI: 10.1039/c9ra08537h |
| This journal is © The Royal Society of Chemistry 2020 |

