 Open Access Article
Effects of three fabric weave textures on the electrochemical and electrical properties of reduced graphene/textile flexible electrodes
Wei Wang *ab,
Tao Lib,
Kang Liub,
Shuo Wangc and
Huaxin Peng*a
aInstitute for Composites Science Innovation (InCSI), School of Materials Science and Engineering, Zhejiang University, Hangzhou 310027, China. E-mail: hxpengwork@zju.edu.cn
bCollege of Textitle &Garment Engineering, Changshu Institute of Technology, Suzhou, 215500, China. E-mail: wangweiwei8660@126.com
cCollege of Textiles and Garments, Hebei University of Science and Technology, Shijiazhuang, 050018, China
First published on 10th February 2020
Abstract
Textile textures formed through woven, knitted or nonwoven weaving technology have critical effects on the electrical and electrochemical properties of flexible electrodes. Therefore, the effects of textile structures, including porosity and pore configuration, on the loading amount of reduction graphene (RGO), the electrical and electrochemical properties were systematically studied. The results show that knitted fabric had the highest mass loading of RGO sheets and lowest sheet resistance among these three fabrics. However, the specific capacitance of woven fabric was optimum 40.5 F g−1 at a scan rate of 5 mV s−1 within the voltage window of 0–0.8 V, which was ascribed to its suitable porosity and pore size firmly anchoring the RGO sheets. Also, the RGO/woven cotton electrodes exhibited good cycling stability and excellent electrochemical stability without an obvious loss in the capacitive performance. The above results provide a theoretical basis for the selection of textile substrates for high-performance flexible electrodes.
1 Introduction
Wearable electronics have attracted broad research attention owing to their wide applications for the military, sports, communications and implantable items.1–4 As reported, developing flexible energy storage devices, such as high-performance supercapacitors and batteries with low-cost, light-weight and excellent storage performance, have become one of the most important issues.5 Benefitting from electric double-layer capacitance and pseudo-capacitance, supercapacitors are considered as the promising candidates due to their excellent power delivery, outstanding life cycle and safety.5,6 Furthermore, a series of flexible substrates including sponges, polymers, paper and textiles have been studied to support electrochemically active materials.6–9Among these materials, textiles offer merits that may make them most perfect substrate for flexible electrodes.2,4,10 First, textile fabric has good compatibility with the conventional clothing industry due to its arbitrary installation, stretchability, curl ability and bended ability. Second, textile fabric has been demonstrated to exhibit many excellent specific strengths such as porosity, three-dimensional structure, good hydrophilicity and low cost; as a result, it meets the requirements of flexibility and high mechanical strength. Third, some of the special functional groups in the molecular structure, such as hydroxyl groups, are beneficial for loading active materials via hydrogen bonding and electrostatic interactions. However, the insulating properties of textile fabric have limited its application in wearable electronics. Therefore, suitable technology is crucial to make this fabric conductive.11–14
It is well known that there are two main methods, namely calcination technology and coating technology, used to convert common fabric into a conductive supporting substrate.11,15,16 A calcination technology was adopted to transform a traditional fabric into a carbon fabric with preeminent conductivity under high temperatures. However, the intrinsically low porosity and poor flexibility of carbon fabrics hamper their development in wearable electronics.11 Compared with the calcination method, the coating technology has been used to load carbon materials, polymers or metals onto the surfaces of cotton fabrics.17–20 This method is simple, easy to operate, and capable of preserving the fabric strength.
It is well known that metals are highly conductive. However, they can easily be oxidized, which affects the electronic properties of common fabrics.21 As for polymers, the electrochemical performance is unstable under the bending and twisting conditions of fabric at high mass loadings.22 Therefore, carbon materials including graphene and carbon nanotubes have become one of the most commonly explored materials for use as flexible electrodes because they have outstanding electrical conductivity, stable chemical properties and double layer capacitance properties.23–28 Certainly, flexible textile electrodes prepared with RGO sheets have been widely researched due to their potential applications for wearable electronic systems.29–32 Although some significant research has been achieved, there are still some problems guaranteeing flexible electrodes among the many possible benefits from these achievements. Most of current research has focused on the coating technology of graphene with different loading conditions on a single fabric substrate. The fabric substrate played a central role in the relation between the fiber materials (cotton, polyester, viscose) and their electrochemical properties. However, the basic fabric structure such as woven texture, knitted texture and nonwoven texture indeed play the key roles in determining the porosity and pore configuration.22 The porous structure directly affects the load amount of graphene and the electrochemical properties of textile-based electrodes. Therefore, it is urgent and necessary to explore the effects of the fabric texture on the electrochemical properties to obtain high-performance electrodes.
In this study, woven, knitted and nonwoven cellulose fabric textures were systematically studied to support graphene sheets. The results show that RGO-coated woven fabric electrode had the best electrochemical performance compared with the other two fabric composites. To understand this result, the porous structures of these three fabric were studied. The pore structure of the woven fabric was optimum for anchoring the graphene sheets in our study. This woven fabric electrode demonstrated excellent flexibility and potential applications for wearable electronics.
2 Experimental section
2.1 Materials
Woven fabric, knitted fabric, and nonwoven fabric were purchased from Shaoxing ao Bang Textile Company. According to Liu's report,22 the fabric structure greatly affects the load fastness and load capacity of the active material due to the different porosity, specific surface area, and fiber tightness when the fabric thickness is the same. Therefore, three fabrics with the similar thicknesses of about 1 mm were selected. The specifications of the knitted fabric are as follows: about 28 tex, 190 g m−2. The specifications of the woven fabric are as follows: about 29 tex × 29 tex, 236 × 236 (roots/10 cm), 156 g m−2. The nonwoven fabric with a weight of 81 g m−2 was obtained via a hydroentanglement technology. Sodium hydroxide (NaOH), sodium sulfate (Na2SO4) and sodium borohydride (NaBH4) were purchased from Sinopharm Chemical Reagent Co., Ltd. All the chemicals were of analytical grade and used without further purification. Graphene oxide (GO) was purchased from Beijing Boyu Co., Ltd. The water used in the work was double distilled water.2.2 Preparation of GO/cotton composite fabrics
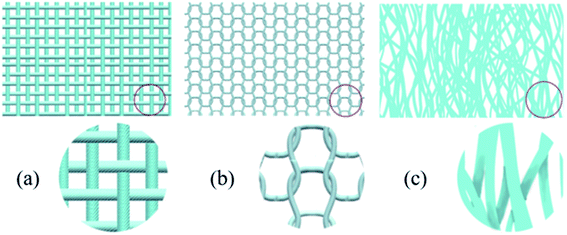
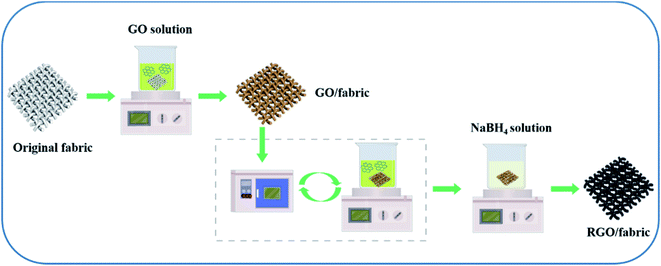
0.1 g GO powder was dispersed in 50 mL double-distilled water under continuous stirring, and was sonicated for 3 h. The woven fabric, knitted fabric and nonwoven fabric (as shown in Fig. 1) were cleaned with 1 M NaOH at 100 °C for one hour to remove all possible contaminants. They were then washed and dried in an oven. The above fabrics were immersed into the as-made GO suspension for 30 min at room temperature and dried in a vacuum oven at 60 °C for 1 h. This coating process was repeated for numerous cycles to increase the GO amount.2.3 Preparation of RGO/fabric composites
An RGO/fabric electrode was prepared via a chemical reduction method using NaBH4 as the reductant. Specific information is as follows: the GO/fabric composite was immersed in a 0.6 mol L−1 NaBH4 aqueous solution for 6 h at room temperature. Then, the as-made fabric was washed using distilled water three times to remove excessive reductant, and then it was dried at 60 °C. The whole fabrication process is schematically illustrated in Fig. 2.2.4 Characterization
The morphology was determined using a scanning electron microscopy (SEM, Hitachi, S-4800). XPS was employed to analyze the changes in the GO and RGO sheets. The porosity and pore size distributions of the fabric electrodes were measured on a capillary flow porometer (CFP, PMI, 1100A). The fabric porosity was tested by gas permeation in a closed environment. The fabric was first infiltrated with an infiltrator. When the air pressure on both sides of the fabric exceeded the surface tension of the wetting agent, the gas passed through the sample gradually. The pore size could be calculated according to the following formula (1):
 | (1) |
2.5 Electrochemical measurements
The electrochemical performance was measured on a CHI660E electrochemical workstation. A standard three-electrode system was used to measure the electrochemical properties of the RGO/fabric using 1 M Na2SO4 as the electrolyte and a Pt sheet, Ag/AgCl and RGO/fabric as the counter, reference and working electrodes, respectively. The RGO/fabric working electrode with an area of 1 × 1 cm2 was immersed into Na2SO4 electrolyte. The CV loops were all observed at a scan rate of 5 mV s−1. The voltage window was varied from 0 to 0.8 V (vs. Ag/AgCl), and the current densities were varied from 0.05 to 0.25 mA cm−2.3 Results and discussion
3.1 Morphology and structure of the RGO/fabric electrode
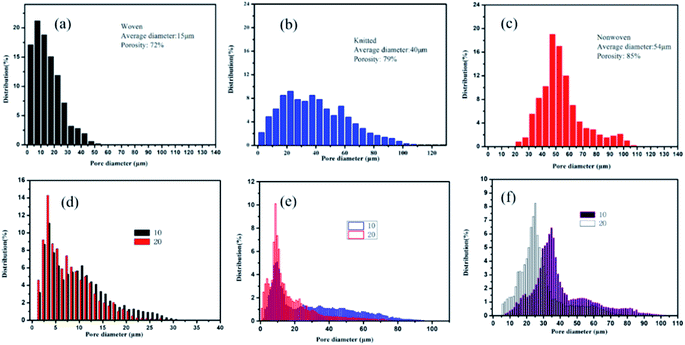
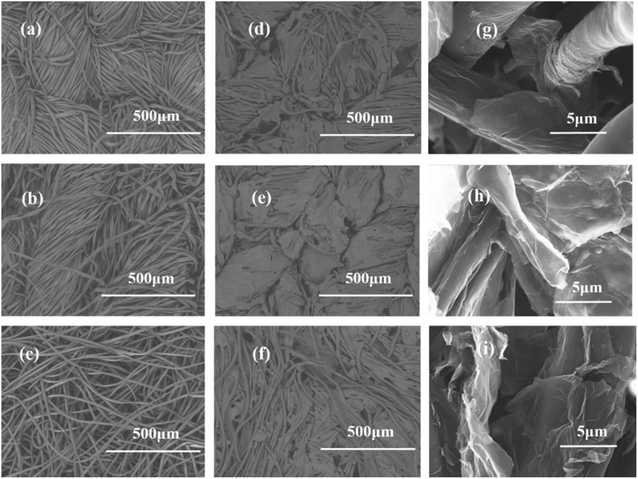
Woven, knitted and nonwoven are the three basic fabric structures that were studied. The main difference among these three fabrics was the formed porosity and pore configuration, as shown in Fig. 3. The average pore diameters of the woven fabric, knitted fabric and nonwoven fabric were 15 μm, 40 μm and 54 μm, corresponding to porosities of 72%, 79% and 85%. The nonwoven fabric exhibited the widest aperture distribution, while the woven fabric showed the narrowest pore size distribution. After deposition with graphene, the pore size distribution of these three fabrics all narrowed as the dipping times increased. Clearly, graphene sheets could fill in the voids between the fibers due to capillary forces and firmly stay on the fiber surfaces due to the presence of electrostatic interactions, van der Waals forces and hydrogen bonds. Notably, the graphene sheets on the surface of the knitted fabric and nonwoven fabric easily fell off in the electrochemical testing process. It is possible that their larger pore sizes reduces the number of active sites for anchoring graphene.Scanning electron microscopy was employed to understand the morphology of the fabrics before and after coating with reduction graphene. From Fig. 4(a–c), the original cotton fabrics based on the woven fabric, knitted fabric and nonwoven fabric all exhibited a hierarchical pore structure with a smooth and clean surface, which are beneficial properties for loading reduction graphene. As shown in Fig. 4(d–i), a large amount of reduction graphene was closely loaded onto the fabric surface. Clearly, these fibers were wrapped with reduction graphene sheets. Some reduction graphene sheets were also filled in at the gaps between the fibers due to their larger pore sizes. These interweaving graphene deposition forms created a highly conductive network that provided fast and efficient pathways for electrons. A cross-sectional SEM image of an RGO/fabric has also been characterized, as shown in Fig. 5(a). The fiber was indeed wrapped with wrinkled and thin reduction graphene sheets.
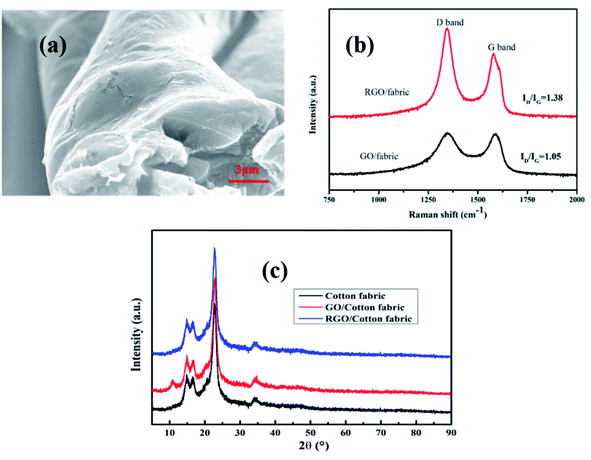 | ||
| Fig. 5 (a) The cross-sectional SEM image of reduction graphene/woven fabrics; (b) Raman curves of the GO/fabric and RGO/fabric; (c) XRD spectrum of cotton fabric, GO/fabric and RGO/fabric. | ||
Raman curves of the GO/fabric and RGO/fabric also helped to understand the differences between GO and RGO. From the Raman spectra in Fig. 5(c), both the G and D bands at 1582 cm−1 and 1345 cm−1 were detected in the samples of the GO/fabric and RGO/fabric, respectively. The G band was ascribed to the hybrid in-plane telescopic vibration of the sp2 carbon atom, while the D band resulted from the lattice defects and disorder of graphene. In addition, the intensity ratio of the D band to G band increased from 1.05 to 1.38, which confirmed that GO was successfully reduced on the RGO sheets.11,33
XRD spectra were also recorded to prove the structure of the cotton fabric, GO/fabric and RGO/fabric. Clearly, three typical peaks corresponding to 17.4°, 22.4° and 34.5° appeared in the original cotton fabric. After being coated with GO, a new diffraction peak appeared at about 10°, which was ascribed to the (001) reflection. This peak disappeared when GO was reduced to RGO. This result indicated that RGO was successfully deposited onto the surface of the cotton fabric.
XPS analysis was performed to further study the oxygen-containing functional groups on the surface of the GO/fabric and RGO/fabric. From Fig. 6(a) and (b), C element and O element were both detected in the survey spectra of the GO/fabric and RGO/fabric. The C 1s spectra of the GO/fabric and RGO/fabric are shown in Fig. 6(c) and (d), respectively. As shown in Fig. 6(c), two strong peaks at 286.8 eV (C–O) and 284.8 eV (C–C) were observed in the sample of the GO/fabric. Two weak peaks at 288.3 eV and 290.1 eV were ascribed to the C![[double bond, length as m-dash]](https://www.rsc.org/images/entities/char_e001.gif) O and O–C
O and O–C![[double bond, length as m-dash]](https://www.rsc.org/images/entities/char_e001.gif) O, respectively.34,35 After GO was converted to RGO, the peak at 286.8 eV corresponding to C–O weakened (Fig. 6(d)). In addition, the ratio of C/O in the GO/fabric was 2.30, while that in the RGO/fabric was 4.05, as presented in Table 1. These results proved that the GO sheets on the fabric surface could be successfully reduced to RGO sheets.
O, respectively.34,35 After GO was converted to RGO, the peak at 286.8 eV corresponding to C–O weakened (Fig. 6(d)). In addition, the ratio of C/O in the GO/fabric was 2.30, while that in the RGO/fabric was 4.05, as presented in Table 1. These results proved that the GO sheets on the fabric surface could be successfully reduced to RGO sheets.
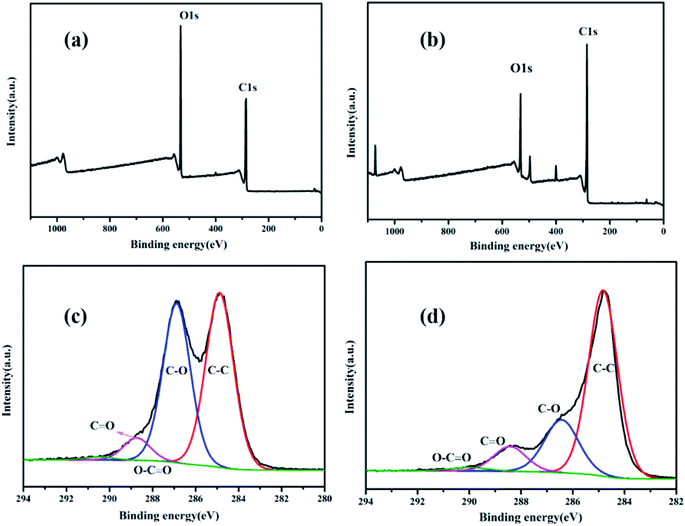 | ||
| Fig. 6 XPS survey spectra of (a) GO/woven fabric and (b) RGO/woven fabric; C 1s spectra of (c) GO/woven fabric and (d) RGO/woven fabric. | ||
| Samples | C 1s (at%) | O 1s (at%) | C 1s/O 1s |
|---|---|---|---|
| GO | 69.76 | 30.24 | 2.30 |
| RGO | 80.2 | 19.8 | 4.05 |
3.2 Electrical and electrochemical properties of RGO/fabric composites
The standard four point-probe method was used to measure the sheet resistances of the original fabric, GO/fabric and RGO/fabric based on the different weave structures. As expected, the woven fabric, knitted fabric and nonwoven fabric were all insulated. Even after being coated with the GO sheets, these three fabrics were still in the non-conductive state. After being processed with NaBH4, the conductivities of these three fabrics were significantly enhanced. Notably, the dipping times played a key role in determining the conductivity of the RGO/fabric composite. From Fig. 7(a), the graphene loading amount first increased then slightly decreased with the increase in the dipping-drying times. Clearly, the graphene loading amount of the knitted fabric was the highest, while that of the woven fabric was the lowest. It was noted that the graphene on the surface of the nonwoven fabrics fell off easily. The relationship between the repeated cycles and the sheet resistance is shown in Fig. 7(b). With the increase in the number of repeats, the electrical resistivity of these three fabrics all decreased due to the high load amount of graphene. The lowest sheet resistances of the knitted fabric, woven fabric and nonwoven fabric were 34 Ω sq−1, 70 Ω sq−1 and 76 Ω sq−1, respectively, showing excellent conductivity. When the amount of graphene was low, the graphene sheet could not completely cover the fabric. As the amount of graphene increased, the fabric was gradually covered completely with the graphene sheets to give a high conductivity. Therefore, the resistances of these fabrics decreased continuously until the fabric was completely coated with graphene sheets. Although the load amount of graphene reduced when the impregnation number increased from 25 to 30, the fabric was still covered with a large number of the graphene sheets to ensure the fabric conductivity, and the fabric resistance did not decrease significantly.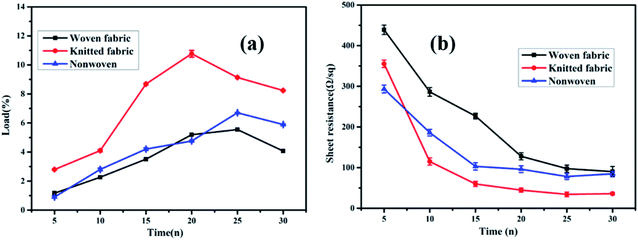 | ||
| Fig. 7 (a) Dependence of the graphene loading rate on the cycles of the dipping-drying process. (b) Dependence of the sheet resistance of the fabric on the cycles of the dipping-drying process. | ||
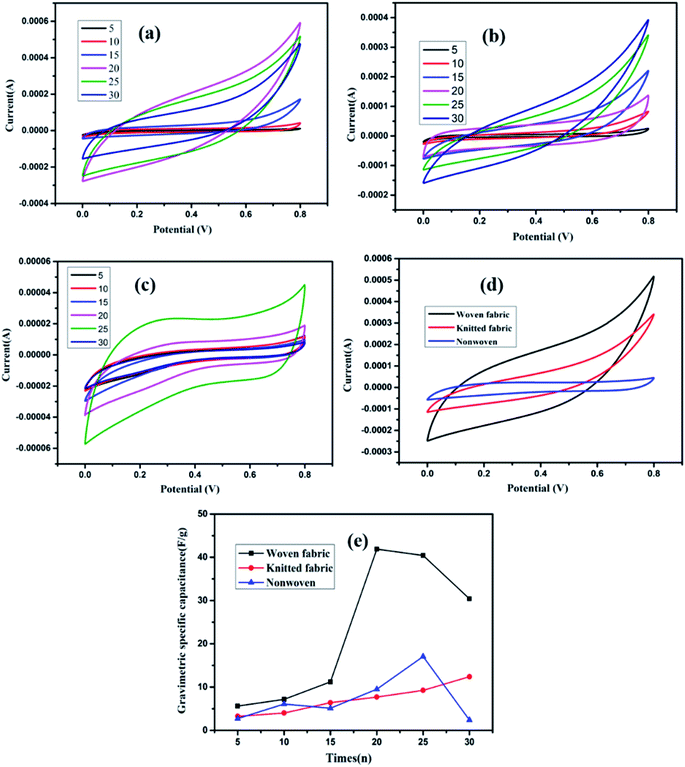
The electrochemical properties of the RGO/fabric composite with different dipping cycles were measured with a standard three-electrode system, and the results are shown in Fig. 8. Nearly rectangular closed CV loops were observed at a scan rate of 5 mV s−1 in all samples regardless of the fabric weaving structure. No oxidation reduction peak appeared in the CV curves, indicating a fast charge transfer. As for the RGO/woven fabric, the area of the CV curve first increased then decreased as the dipping times increased. When the dipping-drying cycles reached 20, the area of the CV curve loops reached a maximum. As for the RGO/knitted fabric, the area of the CV curve increased as the dipping times increased and reached a maximum when the dipping time was 30. As for the RGO/nonwoven fabric, the area of the CV curve was largest when the dipping time was 25.
To study the effects of the fabric structure on the electrochemical properties, the CV curves of the RGO/knitted fabric, RGO/woven fabric and RGO/nonwoven fabric were compared. The results showed that the RGO/woven fabric had a substantially larger capacitance compared to those of the RGO/knitted fabric and RGO/nonwoven fabric, as shown in Fig. 8(d). The CV profiles of these three electrodes showed similar rectangular shapes. The charge storage mechanisms for the electrodes were certainly same based on the double-layer capacitance. The differences among these three fabrics may originate from the effects of the different fabric structures. As for the knitted fabric and nonwoven fabric, the pore sizes were too large to firmly anchor the RGO sheets. Consequently, the RGO sheets on the surface of these two fabrics easily fell off from the fibers upon immersing them into the electrolyte, which resulted in a low specific capacitance. The specific capacitances of these three RGO/fabric composites with different dipping times are calculated, as shown in Fig. 8(e). As mentioned above, the RGO/woven fabric exhibited the best electrochemical properties with an optimum specific capacitance 40.5 F g−1 with dipping times up to 20. The specific capacitances of the RGO/nonwoven fabric or RGO/knitted fabric with different dipping times were all below 20 F g−1.
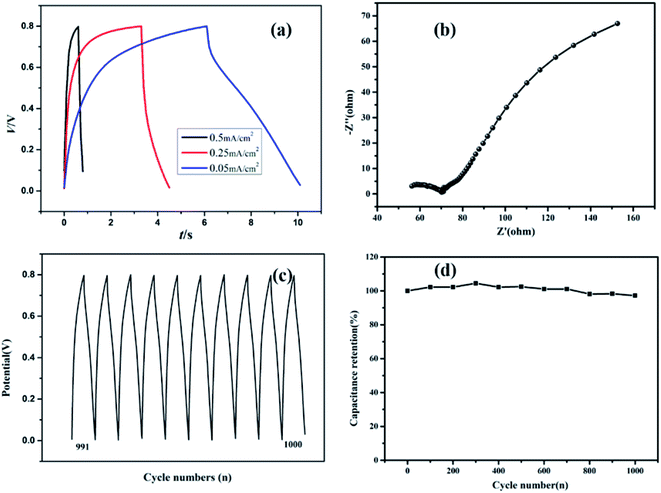
The GCD curves of the RGO/woven fabric flexible electrodes at different current densities ranging from 0.05 to 0.5 mA cm−2 are shown in Fig. 9(a). There is no obvious Faraday reaction on the electrode surface according to the relationship between the voltage and time. The curves were of approximately triangular shapes at current densities of 0.05, 0.25 and 0.5 mA cm−2, demonstrating an ideal electric double-layer capacitor behavior. This result was consistent with that of CV results. Fig. 9(b) presents the Nyquist plot of a flexible electrode to measure the electron-transfer resistance. The curve is composed of a linear part at a lower frequency and a semicircular part at a higher frequency. The equivalent series resistance (Rct), corresponding to the diameter of the semicircular region was 15 Ω, showing a lower electron transfer resistance at the electrode surface. The charge transfer resistance (Rs), corresponding to the intercept of the compressed arc at the real axis was nearly 70 Ω, demonstrating a good ion transport ability.
The cycling stability of flexible electrodes was measured via the cyclic charge/discharge method, and the results are shown in Fig. 9(c) and (d). Fig. 9(c) shows that the CV curves in the cycle tests remain triangular with no obvious change in shape. The specific capacitance depicts a small decrease in the repeated testing processes due to the electrode/electrolyte interface function, as shown in Fig. 9(d). After repeating 1000 times, it could still maintain 98.2% of the original specific capacitance value, indicating the outstanding electrochemical cyclic stability of the RGO@woven fabric.
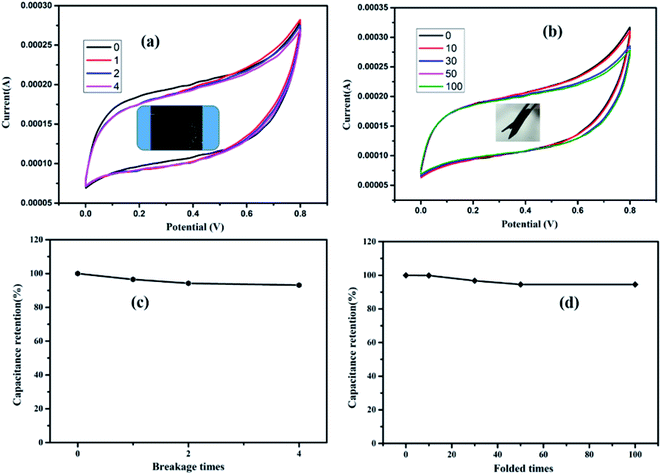
The effects of the breakage test on the electrochemical properties were also evaluated using CV measurements. As shown in Fig. 10(a), the RGO/fabric displays excellent electrochemical properties with no obvious change in the CV curves. Even upon being torn into four parts, the capacitance retention remained at 93.1% of the original capacitance, as presented in Fig. 10(c). The flexibility of the RGO/fabric electrode was studied through folding tests. Based on Fig. 10(b) and (d), the RGO/fabric composite possesses excellent bending properties with 94.5% capacitance retention after 100 bending times.
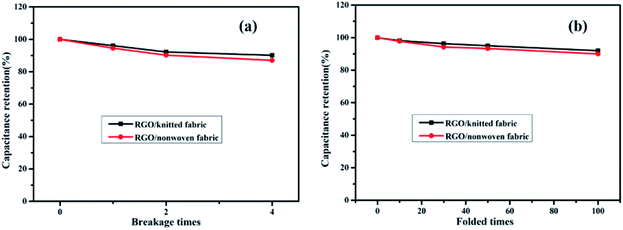
To compare the stability of these three weave fabrics coated with graphene, breakage tests and folded tests of the RGO/knitted fabric and RGO/nonwoven fabric were also conducted, as shown in Fig. 11. Obviously, the capacitance retention of the RGO/knitted fabric was 90.1% after being torn into four parts, while that of the RGO/nonwoven fabric was lowered to 87%. The capacitance retention of the RGO/knitted fabric was 92% after being folded 100 times, while that of the RGO/nonwoven fabric was about 90%. Combined with the results shown in Fig. 10, we can deduce that the RGO/woven fabric has the best stability due to its lowest porosity and narrowest pore size distribution. Also, the capacitance retention of the RGO/nonwoven fabric was lowest among these three fabrics, which resulted from the largest porosity and widest pore size distribution. This result was in accordance with the pore size measurements.
4 Conclusion
In conclusion, three different weave cellulose fabrics (woven structure, knitted structure and nonwoven structure) were studied as flexible electrode substrates. As expected, the porosity and pore configuration of the fabrics had important effects on the electrochemical properties. Although the woven fabric had the lowest mass loading of the RGO sheets, its specific capacitance was an optimum 40.5 F g−1 at a scan rate of 5 mV s−1 within the voltage window of 0–0.8 V. Perhaps the suitable porosity and pore size of the woven fabric were beneficial for anchoring the RGO sheets. In addition, the RGO/fabric exhibited splendid flexibility and stability without any obvious loss in capacitive performance, showing potential applications in wearable electronics.Conflicts of interest
There are no conflicts to declare.Acknowledgements
The authors are grateful for the financial support of this research by “National Natural Postdoctoral Science Foundation of China” (No. 2018M642436), “Natural Science Foundation of Jiangsu Province” (No. BK20181038) and “The Research Innovation Funds of Changshu Institute of Technology” (No. KYZ017102Z).References
- J. Heo, J. Eom, Y. H. Kim and S. K. Park, Small, 2018, 14(1–16), 1703034 CrossRef PubMed.
- Z. X. Liu, F. N. Mo, H. F. Li, M. S. Zhu, Z. F. Wang, G. J. Liang and C. Y. Zhi, Small, 2018,(1–23), 1800124 CrossRef.
- P. Sungjun, W. H. Soo, L. Wonryung, I. Daishi, J. Zhi, Y. Kilho, J. Hiroaki J, H. Daisuke, S. Masaki, Y. Tomoyuki, F. Kenjiro F, T. Keisuke and S. Takao, Nature, 2018, 561, 516–521 CrossRef PubMed.
- M. Tebyetekerwa, I. Marriam, Z. Xu Z, S. Y. Yang, H. Zhang, F. Zabihi, R. J. Jose, S. J. Peng, M. F. Zhu and S. Ramakrishna, Energy Environ. Sci., 2019, 12, 2148–2160 RSC.
- X. J. Wu, Y. J. Xu, Y. Hu, G. Wu, H. Y. Cheng, Q. Yu, K. Zhang, W. Chen and S. Chen, Nat. Commun., 2018, 9(1–11), 4573 CrossRef PubMed.
- L. Li, Z. Lou, D. Chen, K. Jiang, W. Han and G. Z. Shen, Small, 2017, 43(1–23), 1702829 Search PubMed.
- Y. Huang, H. F. Li, Z. F. Wang, Z. X. Pei, Q. Xue, Y. Huang and C. Y. Zhi, Nano Energy, 2016, 22, 422–438 CrossRef CAS.
- T. Y. Zhang, X. Li, E. Asher, S. X. Deng, X. L. Sun and J. Yang, Adv. Funct. Mater., 2018, 37(1–12), 1803600 CrossRef.
- Y. H. Zhu, S. Yuan, D. Bao D, Y. B. Yin, H. X. Zhong, X. B. Zhang, J. M. Yan and Q. Jiang, Adv. Mater., 2017, 29(1–7), 1603719 CrossRef PubMed.
- T. Q. Hao, J. Y. Sun, W. Wang and D. Yu, Cellulose, 2018, 25, 4031–4041 CrossRef CAS.
- Y. Z. Li, Y. F. Zhang, H. R. Zhang, T. L. Xing and G. Q. Chen, RSC Adv., 2019, 9, 4180–4189 RSC.
- D. P. Dubal, N. R. Chodankar, D. Kim and P. Gomezromero, Chem. Soc. Rev., 2018, 47, 2065–2129 RSC.
- Q. Qiu, M. M. Zhu, Z. L. Li, K. L. Qiu, X. Y. Liu, J. Y. Yu and B. Ding, Nano Energy, 2019, 58, 750–758 CrossRef CAS.
- B. Wang, W. H. Song, P. Gu, L. H. Fan, Y. J. Yin and C. X. Wang, Electrochim. Acta, 2018, 297, 794–804 CrossRef.
- Y. J. Wang, X. L. Li, Y. M. Wang, Y. Liu, Y. Bai, L. Liu and G. H. Yuan, Electrochim. Acta, 2019, 299, 12–18 CrossRef CAS.
- J. Zhao, X. Li, X. Y. Li, Z. S. Cai and F. Y. Ge, J. Mater. Sci., 2017, 52, 9773–9779 CrossRef CAS.
- Y. Bo, Y. P. Zhao, Z. S. Cai, A. Bahi, C. H. Liu and F. Ko, Cellulose, 2018, 25, 4079–4091 CrossRef CAS.
- S. Q. Huang, P. S. Chen, W. Z. Lin, S. W. Lyu, G. D. Chen, X. Y. Yin and W. X. Chen, RSC Adv., 2016, 6, 13359–13364 RSC.
- M. X. Guo, S. W. Bian, F. Shao, S. Liu and Y. H. Peng, Electrochim. Acta, 2016, 209, 486–497 CrossRef CAS.
- C. Zhao, K. Shu, C. Wang, S. Gambhir and G. G. Wallace, Electrochim. Acta, 2016, 172, 12–19 CrossRef.
- C. Jin, H. T. Wang, Y. N. Liu, X. H. Kang, P. Liu, J. N. Zhang, L. N. Jin, S. W. Bian and Q. Zhu, Electrochim. Acta, 2018, 270, 205–214 CrossRef CAS.
- L. M. Liu, W. Weng, J. Zhang, X. L. Cheng, N. Liu, J. J. Yang and X. Ding, J. Mater. Chem. A, 2016, 4, 12981–12986 RSC.
- L. B. Hu, W. Chen, X. Xie, N. A. Liu, Y. Yang, H. Wu, Y. Yao, M. Pasta, H. N. Alshareef and Y. Cui, ACS Nano, 2011, 5, 8904–8913 CrossRef CAS PubMed.
- M. Jedrzejczyk, T. Makowski, M. Svyntkivska, E. Piorkowska, U. Mizerska, W. Fortuniak, S. Brzezinski and D. Kowalczyk, Cellulose, 2019, 4, 2191–2199 CrossRef.
- L. N. Jin, P. Liu, C. Jin, J. N. Zhang and S. W. Bian, J. Colloid Interface Sci., 2018, 510, 1–11 CrossRef CAS PubMed.
- C. Jin, L. N. Jin, M. X. Guo, P. Liu, J. N. Zhang and S. W. Bian, J. Colloid Interface Sci., 2017, 508, 426–434 CrossRef CAS PubMed.
- J. S. Ren, C. X. Wang, X. Zhang, T. Carey, K. L. Chen and Y. J. Yin, et. al., Carbon, 2017, 111, 622–630 CrossRef CAS.
- Q. Xue, J. F. Sun, Y. Huang, M. S. Zhu, Z. X. Pei, H. F. Li, Y. K. Wang, N. Li, H. Y. Zhang and C. Y. Zhi, Small, 2017,(1–11), 1701827 CrossRef PubMed.
- N. Karim, S. Afroj, S. Tan, P. He, A. Fernando, C. Carr and K. S. Novoselov, ACS Nano, 2017, 12, 12266–12275 CrossRef PubMed.
- D. Kongahge, J. Foroughi, S. Gambhir, G. M. Spinks and G. G. Wallace, RSC Adv., 2016, 77, 73203–73209 RSC.
- X. M. He, P. Song, X. P. Shen, Y. M. Sun, Z. Y. Ji, H. Zhou and B. L. Li, Cellulose, 2019, 17, 9349–9359 CrossRef.
- J. C. Lv, P. W. Zhou, L. P. Zhang, Y. Zhong, X. F. Sui, B. J. Wang, Z. Z. Chen, H. Xu and Z. P. Mao, Chem. Eng. J., 2019, 361, 897–907 CrossRef CAS.
- D. Kowalczyk, M. Fortuniak, U. Mizerska, I. Kaminska, T. Makowski, S. Brzezinski and E. Piorkowska, Cellulose, 2019, 24, 4057–4068 CrossRef.
- L. L. Xu, M. X. Guo, S. Liu and S. W. Bian, RSC Adv., 2016, 5, 25244–25249 RSC.
- D. Wang, D. W. Li, M. Zhao, Y. Xu and Q. F. Wei, Appl. Surf. Sci., 2018, 454, 218–226 CrossRef CAS.
| This journal is © The Royal Society of Chemistry 2020 |

