
 Open Access Article
 This Open Access Article is licensed under a Creative Commons Attribution-Non Commercial 3.0 Unported Licence
The application of quality by design in the development of the liquid chromatography method to determine empagliflozin in the presence of its organic impurities
Joanna Wittckind Manoel *,
Gabriele Bordignon Primieri,
Lívia Maronesi Bueno,
Nathalie Ribeiro Wingert,
Nádia Maria Volpato,
Cássia Virginia Garcia,
Elfrides Eva Scherman Schapoval and
Martin Steppe
*,
Gabriele Bordignon Primieri,
Lívia Maronesi Bueno,
Nathalie Ribeiro Wingert,
Nádia Maria Volpato,
Cássia Virginia Garcia,
Elfrides Eva Scherman Schapoval and
Martin Steppe
Laboratory of Pharmaceutical Quality Control, State University of Rio Grande do Sul, Porto Alegre, Brazil. E-mail: joannamanoel@gmail.com
First published on 19th February 2020
Abstract
Analysis of impurities is an important step in the quality control of pharmaceutical ingredients and final products. From drug synthesis or excipients, even in small concentrations, impurities may affect efficacy and safety. The method was developed following Quality by Design (QbD) for the analysis of the antidiabetic empagliflozin. The concept of QbD is used as a tool for the development of methods and formulations. Through predefined objectives and risk analysis, robust methodologies and reduced solvent consumption are developed. A simple HPLC method was developed and validated for the quantitative determination of empagliflozin and its organic impurities from the synthesis process. The method was carried out in a Shim-pack phenyl column with a mobile phase consisting of an acetonitrile/water mixture (72![[thin space (1/6-em)]](https://www.rsc.org/images/entities/char_2009.gif) :28), with isocratic elution and the detector wavelength was 230 nm. The validation process, in accordance with international guidelines, shows that the method was linear, precise and accurate for empagliflozin, impurity 1 and impurity 2. Limits of detection (0.01, 0.02 and 0.01 μg mL−1) and quantification (0.10, 0.10 and 0.05 μg mL−1) were determined for EMPA, IMP1 and IMP2, respectively. The HPLC method for impurity determination in empagliflozin was linear, precise, accurate and robust. It can be successfully applied in the quality control of empagliflozin and the synthesis of impurities, being adequate for routine analysis.
:28), with isocratic elution and the detector wavelength was 230 nm. The validation process, in accordance with international guidelines, shows that the method was linear, precise and accurate for empagliflozin, impurity 1 and impurity 2. Limits of detection (0.01, 0.02 and 0.01 μg mL−1) and quantification (0.10, 0.10 and 0.05 μg mL−1) were determined for EMPA, IMP1 and IMP2, respectively. The HPLC method for impurity determination in empagliflozin was linear, precise, accurate and robust. It can be successfully applied in the quality control of empagliflozin and the synthesis of impurities, being adequate for routine analysis.
1. Introduction
The presence of impurities in drugs is increasingly being evaluated in research and industry. There may be significant implications for health when these unwanted structures are consumed, because of the teratogenic, mutagenic or carcinogenic potential of some compounds, especially in continuous use drugs. Impurities are any component present in the pharmaceutical ingredient or the finished product other than the active pharmaceutical ingredient or the excipients. International organizations are increasingly concerned about the presence of impurities in medicine. The International Conference on Harmonization (ICH) determines the acceptable limits and classifies the impurities into three categories among them the organic impurities most found in pharmaceuticals. Organic impurities can arise during the manufacturing process or storage which includes by-products, starting materials, degradation products and intermediates of synthesis.1–3A novel class of drugs has been approved for the management of glycemic control in type 2 diabetes mellitus. The gliflozins are a class of sodium glucose co-transporter 2 inhibitors (SGLT2) that act to prevent glucose reabsorption in the kidney). Empagliflozin (EMPA) is a potent and selective SGLT2 inhibitor used in monotherapy and add-on to other hypoglycemics. Approved by FDA in 2014, this class of therapy has an independent insulin action mechanism. In preclinical studies, EMPA had greater selectivity than canagliflozin and dapagliflozin. Studies show the safety and efficacy of EMPA and demonstrate weight loss and cardiovascular benefits to patients.4,5
EMPA is available in 10 mg and 25 mg film-coated tablets for oral administration under the brand name of Jardiance® (Boehringer Ingelheim). In the literature, different methods have been reported to determine EMPA. More relevant articles describe methods using HPLC, UV and chemometrics to analyze EMPA along with other glycoglycemers. In 2016 they developed and validated an HPLC method for EMPA analysis. They used column C18 (150 × 40 mm, 5 μm) with isocratic elution, mobile phase consisting of an 0.01 M acetate buffer and methanol.6 Ayoub used the chemometrics technique for EMPA and metformin analysis.7 A method using mass detector HPLC was developed using a C18 column (50 mm × 2.1 mm, 1.7 μm), mobile phase composed of acetonitrile and formic acid.8 However none of these studies addresses impurities and stability of EMPA. In this proposal to evaluate the impurities of EMPA synthesis and the fact that there are no reports in the literature about the evaluation of these compounds, we note the importance of this study.
The purpose of this study was to investigate the presence of EMPA synthesis impurities in the pharmaceutical product using the HPLC-UV technique with method development and optimization by Quality by Design (QbD). QbD is a tool that addresses the quality projected from the planning stage. The understanding of the method with predefined objectives and optimization is based on science and risk control.
Application of QbD allows a smaller number of experiments in method design. It also provides a better comprehension of the effects of variables that may influence critical parameters during the application of the analytical method.9,10
The two impurities evaluated represent intermediate compounds found in different stages of EMPA synthetic routes.11–20 EMPA chemical designation is (2S,3R,4R,5S,6R)-2-[4-chloro-3-[[4-[(3S)-oxolan-3-yl]oxyphenyl]methyl]phenyl]-6-(hydroxymethyl)oxane-3,4,5-triol with a purity of 99.3%. The synthesis impurities chemical named is (4-[(5-bromo-2-chlorophenyl)methyl]phenol) and ((3S)-3-[4-[(5-bromo-2-chlorophenyl)methyl]phenoxy]tetrahydrofuran) named impurity 1 (IMP1) and impurity 2 (IMP2) respectively. The purity of these impurities was 99.3% and 99.1% (Fig. 1).
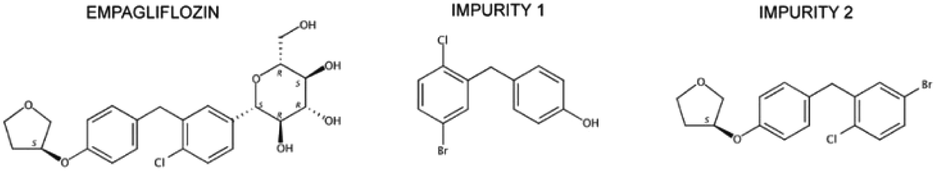 | ||
| Fig. 1 Chemical structures and names of empagliflozin and its impurities. | ||
The HPLC method for impurity determination in EMPA was precise, accurate and robust. The separation of the compounds presented an adequate resolution even in the presence of the degradation product proving to be effective for routine analyses in the pharmaceutical industry.
2. Experimental
2.1. Material and methods
EMPA and impurities were purchased from Carbosynth (Berkshire, UK). Jardiance® (Boehringer Ingelheim, Germany).Tablets for oral administration, containing 25 mg of EMPA were obtained from local pharmacies. All chemicals and reagents used for sample preparation and mobile phase composition were HPLC grade.2.2. LC method
The HPLC system consisted of a Shimadzu 20 A, equipped with CBM-20A controller, LC-20AT pump, SIL-20 AC autosampler, CTO-20AC oven and PDA SPD-M20A detector. The software used for control and data acquisition was the LC-Solution from Shimadzu. The experiments were performed on a reverse-phase Shim-pack (Shimadzu) CLC-phenyl column (250 mm × 4.6 mm, 5 μm). The LC system was operated isocratically at controlled temperature (30 °C) using a mobile phase of acetonitrile–water (72:28 v/v), a flow rate of 0.84 mL min−1 and UV detection at 230 nm. The injection volume was 20 μL. Experiments were designed and assessed on MODDE® 11 (Umetrics, Sweden) software. Design space was defined by risk of failure maps designed using the Monte-Carlo simulation method.
2.3. Stock solution preparation
2.4. Method validation
The method was validated by the determination of the following parameters: specificity, limit of detection, limit of quantitation, linearity, precision and accuracy following the ICH guideline.21:1 and 10:1, respectively. Solutions of known concentrations near the limits were prepared and analyzed separately for confirmation. The precision study was also carried out at the LOQ level by injecting six individual preparations of IMP1 and IMP2 and calculating the % RSD of the areas.3. Results and discussion
3.1. Identification of critical process parameters
To develop methods using QbD, it is necessary to observe important process steps. The first one is accomplished by defining the objectives and critical attributes of quality. The analytical target profile (ATP) was to develop a fast, robust and highly sensitive HPLC method able to analyze EMPA and two impurities of synthesis. In seeking this objective, major characteristics of the samples, such as pKa, logP and UV absorption spectra, were considered before the experiments were started. The list of potential parameters which may affect the critical quality attributes (CQAs) of the analysis can be quite extensive and impractical to evaluate one at a time. Whereas, for the chromatographic analysis of pharmaceutical compounds, some parameters are largely known to affect system suitability. Risk analysis tools such as Ishikawa diagrams, can help to speed up the identification and control of potential quality problems.22 Risk analysis was performed based on scientific knowledge and a small number of previous tests, allowing a better observation of how the parameters are related or segregated into different categories. Ishikawa diagrams (Fig. 2) were set to point out important parameters to be considered in method development.
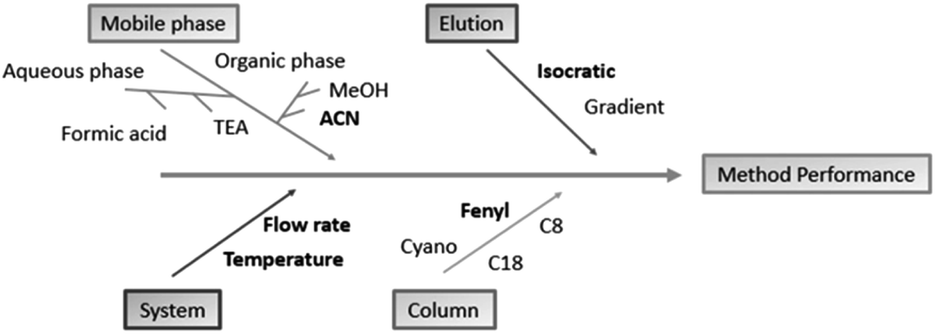 | ||
| Fig. 2 Ishikawa diagram used to point out which factors are more critical to the analytical method. Those chosen for method screening are in bold. | ||
Preliminary tests were performed by altering the column, constituents of the organic and aqueous phase, proportions of the mobile phase, flow and gradient elution. The columns tested at this stage were C8 (3.0 × 50 mm, 3 μm), C8 (4.6 × 150 mm, 5 μm), C18 (4.6 × 150 mm, 5 μm), phenyl (4.6 × 250 mm, 5 μm) and cyano (4.6 × 150 mm, 5 μm). The organic solvents tested were methanol and acetonitrile and in the aqueous phase the presence of triethylamine and phosphoric acid. The flow rate was analyzed in a range of 0.7–1.0 mL min−1.
The influence of stationary phase on the proper separation of EMPA and its impurities was assessed in five different chromatographic columns. The major issue was the distinct polarity between EMPA and the impurities. The pharmaceutical substance presents a higher polarity and, therefore, reduced retention on reverse phase columns. In contrast, the impurities are less polar and tend to adsorb more, increasing their retention time. EMPA eluted in approximately 1.7 min in the C18 and C8 columns while the two impurities eluted in more than 15 min. Analysis in the cyano column resulted in the superposition of impurities peaks. Phenyl column, which is the stationary phase with the higher polarity among those tested, EMPA was detected with increased retention and the impurities presented sharp and well-resolved peaks that eluted in a reasonable time (>15 min).
The composition of the mobile phase was also evaluated. Methanol as the organic portion of the mobile phase increased the background noise and resulted in uneven peaks. The addition of triethylamine and phosphoric acid to the aqueous phase did not benefit the chromatographic analysis. The mobile phase constituted of water and acetonitrile was better suited for the method as aqueous and organic phase, respectively.
The attributes considered critical for the method to reach the ATP were: the number of plates, resolution, retention factor, retention time, and peak purity. System suitability parameters are substantial for a separation with quality and selectivity. Even with the attempts to increase EMPA retention in the stationary phase, the pharmaceutical compound presented a low retention time in the chosen column. While the modifications performed in the chromatographic system had had little effect on EMPA retention time, the two impurities showed a high retention time, sometimes greater than 10 min. Therefore, the retention times of the three compounds, as critical factors, were carefully monitored.
3.2. Scouting phase
After recognizing the goals and objectives that must be achieved, it is important to evaluate the critical parameters of the process with a focus on the quality risk assessment. After defining the critical parameters of the method, the next step in the QbD analysis is to understand their interactions with the CQAs. Screening studies were conducted through an experimental design with the intention to integrate the method development with the green chemistry concepts by reducing the number of analyses and minimizing the expense of organic solvents.23 The screening design allows to evaluate the critical factors and to select those with the greatest effects on the CQAs. Design of experiments (DoE) appears as an optimizing tool that ensures a quick response focusing on the goals set, performing a minimum number of experiments with the maximum number of factors and variations. The DoE for screening purposes was a full factorial design at two levels and three central points, resulting in a total of 19 experiments (α = 0.05). The range of variation selected for each critical process parameter composing the knowledge space is presented in Table 1.| Parameters | Units | Low | High | Critical quality attributes | Target |
|---|---|---|---|---|---|
| Flow rate | mL min−1 | 0.7 | 0.9 | Plates | >5000 |
| Temperature | °C | 20 | 30 | Resolution | >3.0 |
| Organic | % | 50 | 70 | Tailing factor | <1.5 |
| pH | 3.5 | 6.5 | Analysis time | <10 min |
The results of the scouting phase for the retention times of EMPA, IMP1 and IMP2 are presented in Fig. 3. It was found that the flow rate alone is significant in the retention times of the compounds and that for each increase (0.2 mL) in flow rate a decrease was observed in retention time by 2 min for IMP2 and 1 min for IMP1. EMPA is less susceptible to changes in flow, reducing only 0.5 min with increasing flow. This issue was a challenge in the development of the analytical method since EMPA does not vary in the same proportion as the other compounds. Analyzing the influence of temperature it was observed that the increase of this parameter causes the increase of the EMPA retention time, unlike what occurs with the impurities. However, the amplitude of the variations (standard error) is greater than the effect caused. In these situations, it was concluded that the variation in the column temperature does not significantly affect the retention time of the three compounds. The percentage of acetonitrile in the mobile phase has been shown to be an important characteristic to be evaluated as well as how much this factor affects each compound individually. The increase in the acetonitrile ratio is expected to influence the compound retention. The increase of acetonitrile lowers the retention time of EMPA, however, as presented in Fig. 3, it generates a greater impact on reducing the retention time for the impurities. Therefore, the application of acetonitrile at a higher percentage is justified. On the other hand, the pH of the mobile phase did not significantly alter the method when evaluating retention times.
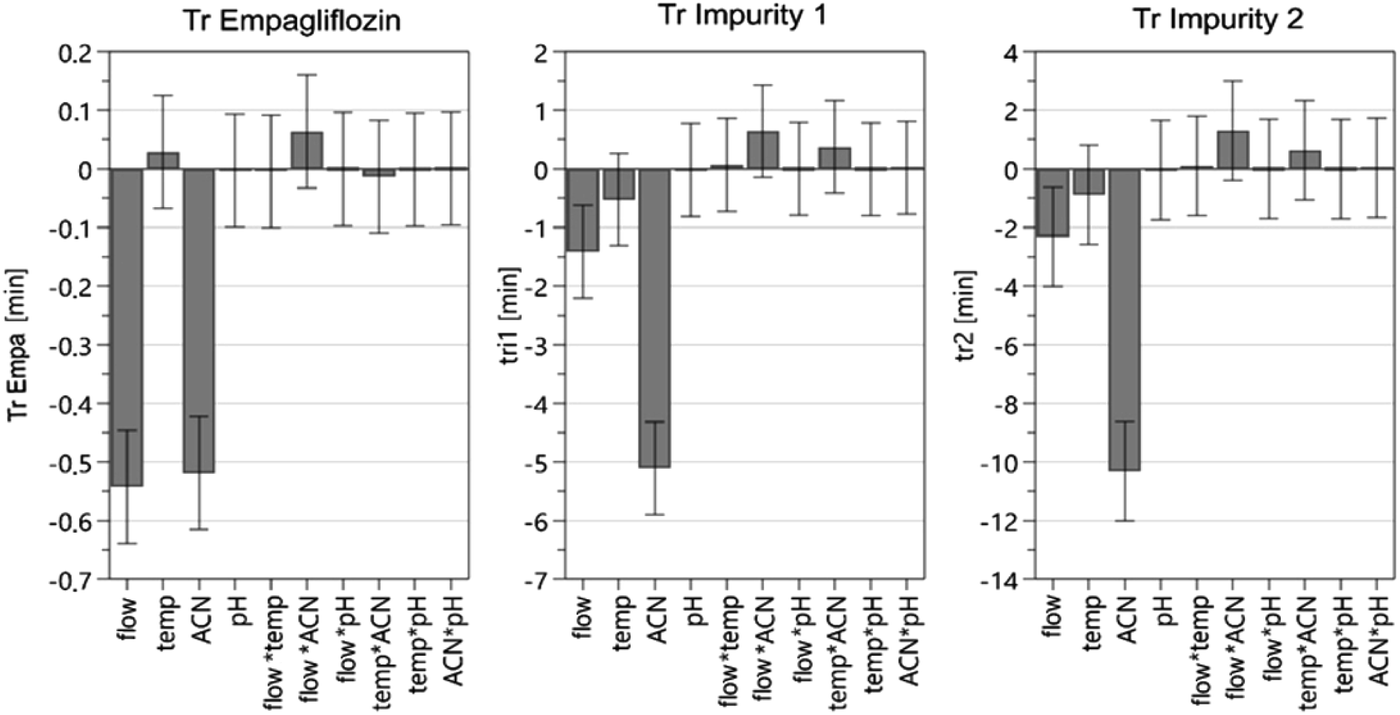 | ||
| Fig. 3 Graphical analysis of the effects (scaled and centered) of critical process parameters on critical quality attributes of the method, during the screening phase. Standard error: Tr Empa: 0.0418; Tr IMP1: 0.3426; Tr IMP2: 0.7355. α = 0.05. | ||
In the analysis of the interactions of the parameters (flow, temperature, acetonitrile, pH), only the combination of flow rate and acetonitrile showed a slight modification in retention times. However, none of those changes produced the optimum retention times established as CQAs of the method (EMPA > 3 min; IMP2 < 8 min), in order to achieve an analysis time with less than 10 min and peak resolution larger than 3. Based on the results, the values of pH and temperature were set at 5.0 and 30 °C, respectively.
3.3. Method optimization
The usual target of chromatographic optimizations is the maximum selectivity with minimum analysis time, all within a known robust working region.9 From the results obtained with screening DoE, the main parameters were selected to work on the optimization phase. The chosen work values can be selected from what is initially desired or by analyzing which conditions best meet the specifications of the CQAs. The variations performed in this step were in the flow rate (0.8–0.9 mL min−1) and the percentage of the organic phase (68–74%).The quadratic model proposed for method optimization consisted of a Central Composite Factorial (star distance: 1) design, with 11 experiments (8 runs and 3 central points) performed to establish the impact of selected parameters on the CQAs (retention time for EMPA, IMP1 and IMP2). The central points of the experiment were performed with values of 0.85 mL min−1 for flow rate and 71% for the proportion of acetonitrile. During the scouting phase, some parameters of system suitability have already been evaluated as satisfactory. Whith phenyl column, the number of plates (N), which indicate method performance, have always been above the recommended values. It should be verified whether if, with the changes in the retention times proposed in method optimization, those numbers remained above 5000.
The values of goodness of fit (R2) and predictive power (Q2) indicate the validity of the model and reliability of the experiments. Q2 is the best and most sensitive indicator, showing an estimation of future prediction precision. Values closer to the unit demonstrate that the chosen DoE is suited for the evaluation performed. The values obtained for R2 were between 0.85 and 1.0 and Q2 levels ranged from 0.86 to 0.99 for the factors evaluated. The results showed goodness of fit and prediction ability of the DoE.
Based on the results obtained for the retention times of the compounds, following the designed experiments order, the Monte Carlo simulation method was applied to find the robust setpoint, according to the CQAs (retention time) and ranges determined: EMPA, from 3 to 5 min; IMP1, from 5 to 7 min; IMP2, from 6 to 8 min. A design space was generated by the multiple simulations (Fig. 4) performed. The final best conditions for the critical parameters were flow rate at 0.84 mL min−1, 72% of acetonitrile, column temperature equal to 30 °C, and aqueous phase without pH modifier. Based on the determination of these conditions, an experimental test was performed to observe if they would reproduce properly within the CQAs.
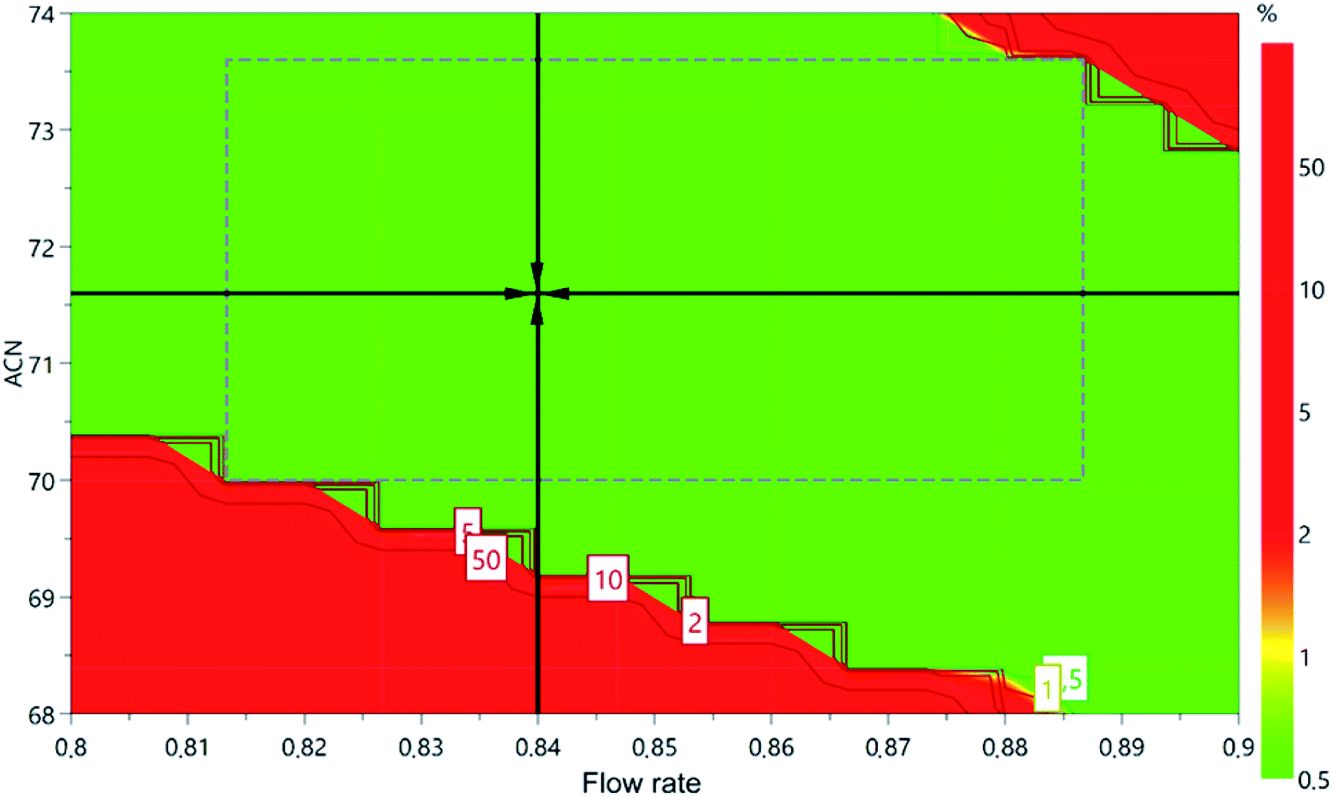 | ||
| Fig. 4 Design space and hypercube region of the method developed by applying QbD principles. The values inside the figure represent the chance of failure (α = 0.05). | ||
3.4. Hypercube region, robustness
According to ICH Q2B, robustness is the ability of a process to tolerate variability and changes in the method and equipment without a negative impact on quality. Usually, robustness is evaluated at the end of the validation of the analytical methods. This practice can lead to unwanted surprises. The use of QbD allows a risk zone evaluation during the development and optimization of the method. The experimental design itself can be considered a zone of theoretical robustness because it demonstrates that modifications within that region will not significantly affect the quality of the separation. The only requirement is for the chosen point to be within the experimental design.9 Fig. 4 presents the hypercube region of the robustness of the method.Since QbD was used in the method development, the generated data will provide a deep understanding of the process as well as its variables. The hypercube region provides the confidence interval of the method where the risk of failure of the method is small because the critical process parameters are known and the limits have been defined. Some care must be taken in sample preparation, storage of materials and solvents so that no unwanted peaks appear on the chromatograms. When monitoring the method it is always important to evaluate if the parameters remain within the satisfactory limits such as retention time, plates, resolution, tailing factor, and peak purity.
3.5. Validation
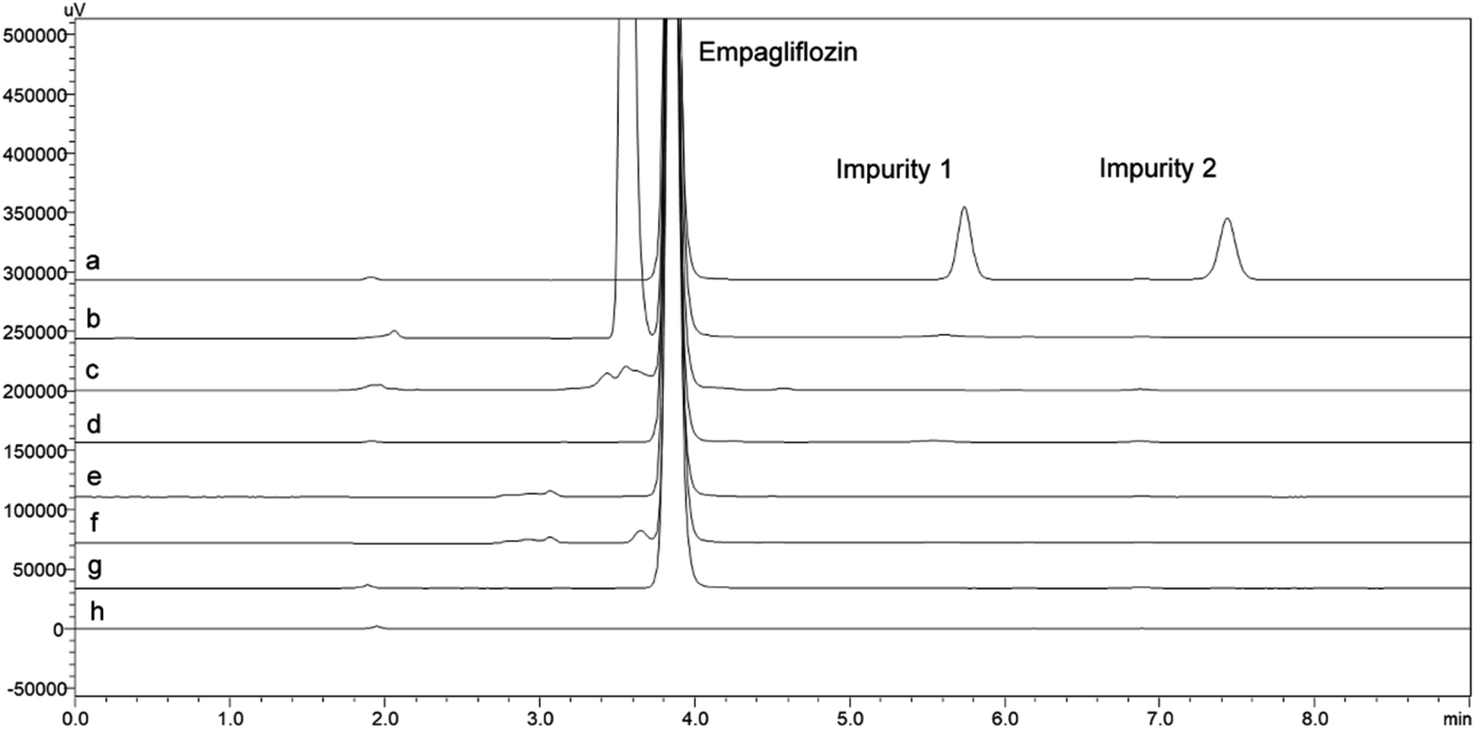 | ||
| Fig. 5 Chromatograms of the exposure of empagliflozin to degradation conditions: (a) solution of EMPA (100.0 μg mL−1) and Impurities (1.0 μg mL−1) without degrading (b) H2O2 (c) UVC (d) UVA (e) HCl 0.1 M (f) NaOH 0.1 M (g) temperature 60 °C and (h) placebo. | ||
| Parameter | Empagliflozin | Impurity 1 | Impurity 2 |
|---|---|---|---|
| a Fca: F calculated, Fcr: F critical. | |||
| Linearity range | 40–140 μg mL−1 | 0.1–10 μg mL−1 | 0.05–10 μg mL−1 |
| Regression equation | y = 46404x + 216038 |
y = 105323x + 1395.9 | y = 105384x + 1004 |
| Correlation coefficient (r) | 0.9992 | 0.9999 | 0.9999 |
| LoD | 0.01 μg mL−1 | 0.02 μg mL−1 | 0.01 μg mL−1 |
| LoQ | 0.10 μg mL−1 | 0.10 μg mL−1 | 0.05 μg mL−1 |
| LoQ RSD (%) | 1.80% | 2.05% | 2.14% |
|
|||
| ANOVA | |||
| Linear regression | Fca (11838) > Fcr (4.75) |
Fca (107149) > Fcr (4.41) |
Fca (494787) > Fcr (4.41) |
| Deviation from linearity | Fca (2.30) < Fcr (3.26) | Fca (2.27) < Fcr (2.58) | Fca (1.72) < Fcr (2.58) |
000 and 17000 for EMPA, IMP1 and IMP2, respectively. The values of the tailing factor were below 2.0 for all compounds (EMPA (1.2), IMP1 (1.1) and IMP2 (1.0). The resolution between the peaks was satisfactory, the values obtained for EMPA were higher than 11, IMP1 higher than 10, IMP2 higher than 8. The experimental results show that the tested parameters were within the acceptable range, indicating that the system is suitable for the analysis intended (Table 5).25
| Retention time (min) | Number of plates | Tailing factor | Resolution | |
|---|---|---|---|---|
| Critical values | — | >5000 | 0.8–1.5 | >3.0 |
| Empagliflozin | 3.84 | >9000 | 1.2 | — |
| Impurity 1 | 5.74 | >14000 |
1.1 | >10.0 |
| Impurity 2 | 7.43 | >17000 |
1.0 | >8.0 |
4. Conclusion
The study of organic impurities in drugs is highly regarded in industries and research. Even at small concentrations, these compounds may be potentially toxic to the patient, especially when the drug is continuously used. Monitoring these compounds in the quality control of raw materials as well as the final product diminishes the likelihood of their presence. The method proposed in this work was developed by QbD with the intention of evaluating impurities of EMPA synthesis. Based on the QbD experiments and the practical results, the values of each parameter were selected by evaluating the shortest final analysis time and considering all the system suitability values.The proposed HPLC method for EMPA and synthesis impurities analysis proved simple, rapid, accurate and robust, representing a novel good option for routine quality control, since there is no official one.
Conflicts of interest
There are no conflicts to declare.Acknowledgements
This study was financed in part by the Coordenação de Aperfeiçoamento de Pessoal de Nível Superior – Brazil (CAPES) – Finance Code 001. The authors wish to thanks CNPQ (Scientific Project MCT/CNPq No. 014/2013).Notes and references
- K. Wadekar, M. Bhalme, S. Rao, K. Reddy, L. Kumar and E. Balasubrahmanyam, Pharm. Technol., 2012, 36, 58–72 CAS.
- ICH Q3A(R2), Impurities in new drug substances, in International conference on harmonisation of technical requirements for registration of pharmaceuticals for human use, 2006, p. 15 Search PubMed.
- ICH Q3B(R2), Impurities in new drug products, in International conference on harmonisation of technical requirements for registration of pharmaceuticals for human use, 2006, p. 15 Search PubMed.
- B. K. Irons and M. G. Minze, Drug treatment of type 2 diabetes mellitus in patients for whom metformin is contraindicated, Diabetes, metabolic syndrome and obesity: targets and therapy, 2014, vol. 7, p. 15 Search PubMed.
- H. Haering, et al., Empagliflozin as add-on to metformin plus sulphonylurea in patients with type 2 diabetes, Diabetes Res. Clin. Pract., 2015, 110(1), 82–90 CrossRef CAS PubMed.
- N. Padmaja and G. Veerabhadram, Int. J. Pharm. Sci. Res., 2016, 7(2), 724–727 CAS.
- B. M. Ayoub, Spectrochim. Acta, Part A, 2016, 168, 118–122 CrossRef CAS PubMed.
- B. M. Ayoub and S. Mowaka, J. Chromatogr. Sci., 2017, 55(7), 742–747 CAS.
- S. Orlandini, S. Pinzauti and S. Furlanetto, Anal. Bioanal. Chem., 2013, 405(2–3), 443–450 CrossRef CAS PubMed.
- L. X. Yu, et al., AAPS J., 2014, 16(4), 771–783 CrossRef CAS PubMed.
- M. Hrapchak, et al., J. Labelled Compd. Radiopharm., 2014, 57(12), 687–694 CrossRef CAS PubMed.
- M. Eckhardt, et al., Processes for the preparation of empagliflozin, World Patent, PCT Int. Appl., 2006120208, 2006, 16 Nov.
- M. Eckhardt, et al., Process for the preparation of glucopyranosyl-substituted benzonitriles for use as therapeutic agents treating metabolic disorders, US Pat. Appl. Publ., 20070259821, 2007, 08 Nov.
- F. Himmelsbach, et al., Crystalline form of 1-chloro-4-(β-D-glucopyranos-1-yl)-2-[4-((s)-tetrahydrofuran-3-yloxy)-benzyl]-benzene, a method for its preparation and the use thereof for preparing medicaments, US Pat. Appl. Publ., 20100099641, 2010, 22 Apr.
- X.-j. Wang, et al., Efficient synthesis of empagliflozin, an inhibitor of SGLT-2, utilizing an AlCl3-promoted silane reduction of a β-glycopyranoside, Org. Lett., 2014, 16(16), 4090–4093 CrossRef CAS PubMed.
- X. Zheng, et al., Method for preparing empagliflozin, faming zhuanli shenqing, Chinese Patent, 106905305, 2017, 30 Jun.
- S. J. Desai, et al., Processes for the preparation of empagliflozin, US Pat. Appl. Publ., 20170247356, 2017, 31 Aug.
- K. Shiet al., Method for preparing empagliflozin, faming zhuanli shenqing, Chinese Patent, 107556302, 2018, 09 Jan.
- C. Feng and B. Yan, Process for the preparation of empagliflozin, faming zhuanli shenqing, Chinese Patent, 107652278, 2018, 02 Feb.
- H. Wanget al., 6-Haloglucose carbon glycoside and preparation method and application thereof, faming zhuanli shenqing, Chinese Patent, 108675976, 2018, 19 Oct.
- ICH Q2B, Validation of analytical procedures: methodology, in International conference on harmonisation of technical requirements for registration of pharmaceuticals for human use, 2005, p. 13 Search PubMed.
- R. S. Lloyd, J. J. Kirkland and J. L. Glajch, Practical HPLC Method Development, John Wiley & Sons, Inc, 2nd edn, 1997 Search PubMed.
- C. Boussès, L. Ferey, E. Vedrines, K. Gaudin and C. Bousses, J. Pharm. Biomed. Anal., 2015, 115, 114–122 CrossRef PubMed.
- J. Ermer and J. H. McB. Miller, Method validation in pharmaceutical analysis: a guide to best practice, John Wiley & Sons, 2006 Search PubMed.
- G. A. Shabir, J. Chromatogr. A, 2003, 987, 57–66 CrossRef CAS.
| This journal is © The Royal Society of Chemistry 2020 |