
 Open Access Article
 This Open Access Article is licensed under a Creative Commons Attribution-Non Commercial 3.0 Unported Licence
Confirmatory non-invasive and non-destructive differentiation between hemp and cannabis using a hand-held Raman spectrometer†
Lee Sancheza,
Conor Filterb,
David Baltenspergerc and
Dmitry Kurouski *ad
*ad
aDepartment of Biochemistry and Biophysics, Texas A&M University, College Station, Texas 77843, USA. E-mail: dkurouski@tamu.edu
bTexas Farm & Process, LLC, Fort Worth, Texas 76102, USA
cDepartment of Soil and Crop Sciences, Texas A&M University, College Station, Texas 77843, USA
dThe Institute for Quantum Science and Engineering, Texas A&M University, College Station, Texas 77843, USA
First published on 17th January 2020
Abstract
Cannabis is a generic term that is used to denote hemp plants (Cannabis sativa) that produce delta-9-tetrahydrocannabinolic acid (THCA) in amounts higher than industrial hemp. While THCA itself is not considered psychoactive, it is the source of the psychoactive delta-9 tetrahydrocannabinol (THC) that forms from its oxidation. About 147 million people, which is around 2.5% of the world population, consume cannabis. This makes cannabis by far the most widely cultivated and trafficked illicit drug in the world. Such enormous popularity of cannabis requires substantial effort by border control and law enforcement agencies to control illegal trafficking and distribution. Confirmatory diagnostics of cannabis is currently done by high pressure liquid chromatography (HPLC), which requires sample transportation to a certified laboratory, making THC diagnostics extremely time and labor consuming. This catalyzed a push towards development of a portable, confirmatory, non-invasive and non-destructive approach for cannabis diagnostics that could be performed by a police officer directly in the field to verify illicit drug possession or transport. Raman spectroscopy (RS) is a modern analytical technique that meets all these strict expectations. In this manuscript, we show that RS can be used to determine whether plant material is hemp or cannabis with 100% accuracy. We also demonstrate that RS can be used to probe the content of THCA in the analyzed samples. These findings suggest that a hand-held Raman spectrometer can be an ideal tool for police officers and hemp breeders to enable highly accurate diagnostics of THCA content in plants.
Introduction
Drug trafficking involves cultivation, manufacture, distribution and sale of substances that are subject to drug prohibition laws.1 On a federal and state-specific level, drug trafficking is considered a felony offense that carries serious consequences such as prison time and significant monetary fines. Worldwide, sentences for drug distribution and trafficking generally range from 3–5 years to life in prison or even the death penalty.1Cannabis is by far the most widely cultivated and trafficked illicit drug in the world.1 The problem of cannabis trafficking is especially challenging in the United States, as 11 states and Washington DC have legalized it for recreational use, 33 states have legalized cannabis for medicinal use and 15 states have decriminalized cannabis.2 U.S. Customs and Border Protection, the Drug Enforcement Administration, and state and local police departments across the country spend enormous financial resources to cease the traffic of illicit drugs. For instance, in 2015 alone, the federal government spent an estimated $9.2 million every day towards the incarceration of people charged with drug-related offenses; and since 1971, the war on drugs has cost the United States an estimated $1 trillion.3
A substantial portion of these expenses is used for forensic analyses of potential drug substances, which are primarily done by HPLC and mass spectrometry.4–7 These sophisticated tests are destructive, time consuming and can only be performed in certified laboratories. This drastically delays the times of analysis for potential drug substances.7 This problem has catalyzed a push towards the development of portable tests that can be performed directly in the field and can confirm the presence of an illicit drug. Several companies have come up with tests that were based on a color change upon interaction of a specific reagent with the drug of interest. However, such tests did not find broad applications in forensic practice due to their high cost, destructive nature and a lack of a quantitative response.8 Their application is far more challenging for hemp vs. cannabis diagnostics because hemp may legally contain up to 0.3% THC, the major psychoactive component of cannabis. However, this legal amount of THC can give positive color change on those tests.
We hypothesized that hemp vs. cannabis diagnostics can be done using Raman spectroscopy. This analytic technique is based on inelastic light scattering of photons, which excite molecules in the sample to higher vibrational or rotational states.9 After these inelastically scattered photons are collected by a spectrometer, the change in the photon energy is determined. Since the change in the photon energy will directly depend on the vibrational properties of the sample, RS can be used to probe structure and composition of analyzed specimen. Our group previously demonstrated that RS can be used to detect and identify presence of urine on police uniform10 as well as diagnose biotic and abiotic stresses on plants.11,12
In the current study, we show that a hand-held Raman spectrometer can be used to determine whether the sample of interest is hemp or cannabis with 100% accuracy. Moreover, we show that RS can be used to probe the content of THCA in cannabis. This makes this approach highly suitable for police as such analysis is non-invasive and non-destructive and can be performed directly in the field.
Experimental
Plants
Hemp and cannabis plants were grown at Evergreen Enterprises LLC located in Denver, CO. Buds of 5–10 fresh hemp plants and 10–15 different fresh-frozen cannabis plants of three varieties known as “triple chocolate chip (TCC)”, “gelato cake (GC)”, and “twisted sherbert (TS)” were used. Fresh-freezing of plants was performed by placement of plant buds into freezer at −10 to −15 °C. Fresh-freezing is a standard procedure in cannabis farming that is used to preserve cannabinol content of plants during their post-harvest processing. Based on visual examination, fresh-freezing does not result in any noticeable changes in plant appearance or texture. Cannabinol content of hemp (0.07% THCA) and cannabis (TCC: 10.31% THCA, GC: 6.12% THCA, and TS: 4.05% THCA) strains was determined by Agricor Laboratories. Certificates of analyses are provided in the ESI.†Raman spectroscopy
Raman spectra were taken with a hand-held Resolve Agilent spectrometer equipped with 831 nm laser source (beam diameter ∼2 mm). Resolve spectral resolution was 15 cm−1. Samples were brought in a direct contact with the spectrometer for spectral acquisition. The following experimental parameters were used for all collected spectra: 10 s acquisition time, 495 mW power. The spectra were automatically baselined by the instrument software. In total, 20–23 spectra were collected from each sample type (hemp or individual cannabis variety). Spectra shown in the manuscript are raw baseline corrected, without smoothing.Multivariate data analysis
SIMCA 14 (Umetrics, Umeå, Sweden) was used for statistical analysis of the collected Raman spectra. All imported spectra were scaled to unit variance to give all spectral regions equal importance. Orthogonal partial least squares discriminant analysis (OPLS-DA) was performed in order to determine the number of significant components and identify spectral regions that best explain the separation between the classes. Standard normal variate (SNV) correction followed by the first derivative was applied to the spectra normalized by the total area. Next, using OPLS-DA, we determined the number of predicting and orthogonal significant components and identified spectral regions that best explain the separation between the classes. In order to give each of the spectral regions equal importance, all spectra were scaled to unit variance. Raw spectra, containing wavenumbers 701–1700 cm−1, were retained in the model that resulted from this iteration of OPLS-DA.Results and discussion
We found that the Raman spectrum of hemp is dominated by vibrational bands that could be assigned to cellulose, carotenoids and lignin, Fig. 1, Table 1.13 At the same time, spectra collected from GC, TCC and TS clearly demonstrate presence of THCA. Specifically, we observed vibrational bands at 780, 1295, 1623, and 1666 cm−1 in the spectra of GC, TCC and TS that can be assigned to THCA. We also observed a change in the intensities of bands at 916, 993, 1000, 1084, 1155, 1185, 1267, 1321, and 1525 cm−1 in the spectra collected from GC, TCC and TS relative to the intensities of these bands in the Raman spectrum of hemp. However, the change in intensities of these vibrational bands cannot be used for confirmatory diagnostics of THCA presence because these bands have also been observed in the spectrum of hemp and can be assigned to carbohydrates and cellulose. Nevertheless, the change in intensities of these vibrational bands suggests about structural differences between hemp and cannabis plants. For instance, we found that vibrational bands at 993, 1000 and 1525 cm−1, which can be assigned to carotenoids, are more intense in the spectrum collected from hemp relative to the intensity of this band in the spectra collected from cannabis species. This result indicate that hemp have higher carotenoid content comparing to cannabis plants. Similarly, we found that intensities of 946, 1084 and 1155 cm−1 bands are stronger in the spectrum of hemp comparing to cannabis plants. This finding suggests that amount of cellulose is higher in hemp comparing to cannabis species.13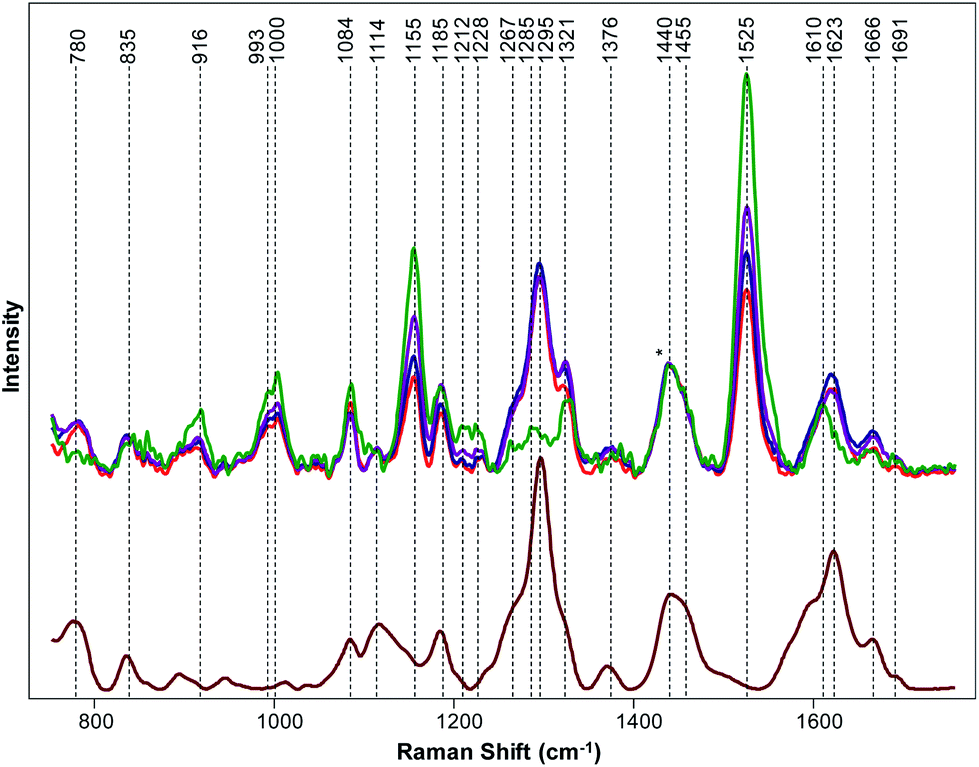 | ||
| Fig. 1 Top: Raman spectra collected form hemp (green), GC (purple), TCC (blue) and TS (red). Bottom: Raman spectrum of THCA extract (maroon). Spectra normalized on CH2 vibrations (1440 and 1455 cm−1) that are present in nearly all classes in biological molecules (marked by asterisks (*)). | ||
| Band | Vibrational mode | Assignment |
|---|---|---|
| 780 | TBA | THC/THCA |
| 835 | TBA | THC/THCA |
| 916 | ν(C–O–C) in plane, symmetric | Cellulose, lignin14 |
| 993–1000 | ν3(C–CH3 stretching) and phenylalanine | Carotenoids, protein8,15 |
| 1084 | ν(C–O) + ν(C–C) + δ(C–O–H) | Carbohydrates16 |
| 1114 | νsym(C–O–C), C–OH bending | Cellulose17,18 |
| 1155 | νasym(C–C) ring breathing | Carbohydrates, cellulose14 |
| 1185 | ν(C–O–H) next to aromatic ring + σ(CH) | Xylan19,20 |
| 1212–1228 | δ(C–C–H) | Aliphatic,21 xylan19 |
| 1267 | C–O stretching (aromatic) | Lignin22 |
| 1285 | δ(C–C–H) | Aliphatic21 |
| 1295 | TBA | THC/THCA |
| 1321 | δCH2 bending vibration | Cellulose, lignin14 |
| 1376 | δCH2 bending vibration | Aliphatic21 |
| 1440 | δ(CH2) + δ(CH3) | Aliphatic21 |
| 1455 | δCH2 bending vibration | Aliphatic21 |
| 1527–1551 | –C![[double bond, length as m-dash]](https://www.rsc.org/images/entities/char_e001.gif) C– (in plane) C– (in plane) |
Carotenoids23,24 |
| 1610 | ν(C–C) aromatic ring + σ(CH) | Lignin25,26 |
| 1623– | Aromatic | THC/THCA27 |
| 1691 | ν(CO) |
Carboxyl groups28 |
To further prove our expectation that RS can be used for highly accurate differentiation between hemp and cannabis, we used OPLS-DA analysis. The final model, containing one predictive component, 2 orthogonal components and 1001 (701–1700 cm−1) out of 1651 original wavenumbers, was used to generate the misclassification table (Table 2) and the loadings plot (Fig. 2).
| Members | Correct | Cannabis | Hemp | |
|---|---|---|---|---|
| Cannabis | 64 | 100% | 64 | 0 |
| Hemp | 22 | 100% | 0 | 22 |
| Total | 86 | 100% | 64 | 22 |
| Fisher's prob. | 5.9 × 10⁻²¹ |
 | ||
| Fig. 2 Loading plot of the predictive component in the Raman spectra of cannabis and hemp. | ||
The first predictive component (PC) (Fig. 2) explain 94% of the variation between classes. Absolute intensities in the loading spectrum are proportional to the percentage of the total variation between classes explained by each wavenumber. The model identified the peak at 781 cm−1, which could be assigned to THCA (Table 1), cellulose and lignin peaks at ∼925 cm−1 and the bands at 1260–1320 cm−1, which correspond to both THCA and cellulose. Also, the model identified peaks at 1440 cm−1, which could be assigned to aliphatic vibrations and bands at 1623–1660 cm−1, which originate from THCA, to be the strongest spectral markers of cannabis, which supports the conclusions of our qualitative spectral analysis above. The model explained 48% of the variation (R2X) in the spectra and correctly assigned all 86 spectra to their classes (Table 2, Fig. S1†). This indicates that coupling of OPLS-DA with RS allows for a 100% accurate differentiation between cannabis and hemp.
Next, we asked a question whether RS can be used for quantitative prediction of the THCA content in cannabis, as well as identification of cannabis variety. HPLC analyses of TCC, GC and TS samples allowed to determine the THCA content which was found to be 10.31%, 6.12% and 4.05%, respectively. Our results demonstrate that intensity of the 1623 cm−1 band directly correlates with the amount of the THCA content in the cannabis, Fig. 1. We used analysis of variance (ANOVA) to visualize the correlation of intensity of 1623 cm−1 band with the content of THCA in the analyzed plant material, Fig. 3. These results suggest that RS can be used for quantitative prediction of the THCA content in intact plant materials. However, more experimental work is needed at this point to determine the accuracy and the range of THCA prediction. This work is currently in progress in our laboratory.
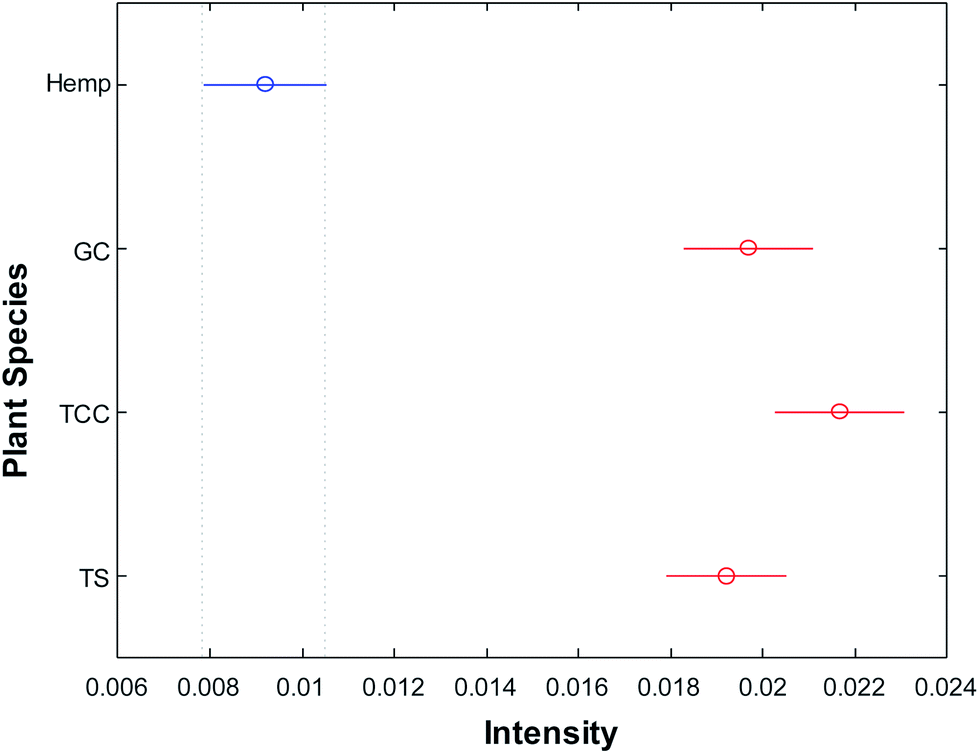 | ||
| Fig. 3 Means (circles) and confidence intervals for the intensities of 1623 band of THCA for hemp, GC, TCC and TS, normalized to 1440 cm−1. | ||
Utilization of OPLS-DA allowed for quantitative differentiation between three different classes on cannabis, Table 3. The final model, containing 2 predictive components, 2 orthogonal components and 1001 (701–1700 cm−1) out of 1651 original wavenumbers, was used to generate the misclassification table (Table 3) and the loadings plot (Fig. S2†). The first two predictive components (PC) explain 42% and 36% of the variation between classes respectively, which collectively accounts for 78% of the total class-to-class variation. Absolute intensities in the loadings spectra are proportional to the percentage of the total variation between classes explained by each wave-number within each component. The model identified the peak at 781 cm−1 (PC1), cellulose and lignin peaks at 925 cm−1 (PC1), the bands at 1250–1340 cm−1 (PC1), 1440 cm−1 (PC1) and the region of 1580–1670 cm−1 (PC1) to be the strongest spectral markers representing the three cannabis species, which supports the conclusions of our qualitative spectral analysis above. The model explained 48% of the variation (R2X) in the spectra and 78% (R2Y) of the variation between the classes. Furthermore, the model correctly assigned 84 out of 86 spectra to their classes (Table 3). Our results demonstrate that coupling of OPLS-DA with RS allows for a ∼97% accurate identification of the cannabis variety.
| Members | Correct | GC | TCC | TS | |
|---|---|---|---|---|---|
| GC | 20 | 95% | 19 | 1 | 0 |
| TCC | 21 | 100% | 0 | 21 | 0 |
| TS | 23 | 96% | 1 | 0 | 22 |
| Total | 64 | 97% | 20 | 22 | 22 |
| Fisher's prob. | 1.9 × 10⁻²³ |
It should be noted that in plants THC is present in carboxylated form of THC, known as THCA. Upon decarboxylation, which can be induced by thermal heating, THCA is converted to THC. Spectroscopically, the carboxyl group of THCA is evident from the vibration at 1691 cm−1, which was observed in our spectra. One could expect that other vibrational bands that were assigned to THCA would originate from THC since decarboxylation is the only structural transformation in the molecule upon THCA to THC conversion. Specifically, our spectroscopic analysis was based on 1623 cm−1 band, which originate from aromatic moiety present in both THCA and THC. Therefore, we can speculate that RS allows to predict the amount of THC in the analyzed sample without necessary oxidation of THCA to THC.
Conclusions
Our results clearly demonstrate that RS can be used for confirmatory, non-invasive and non-destructive detection and identification of cannabis. We showed that RS allowed for highly accurate differentiation between cannabis and hemp and prediction of cannabis variety. Because of the portable nature of our analysis, this spectroscopic approach will be highly advantageous for police and border control officers. Also, these results demonstrate that RS can be a great tool for hemp cultivation and breeding allowing for accurate detection of THCA levels in intact growing plants.Conflicts of interest
There are no conflicts to declare.Acknowledgements
This study was supported by funds from Texas A&M AgriLife Research, Texas A&M University Governor's University Research Initiative (GURI) grant program of (12-2016/M1700437). The authors are also grateful to Charles Farber for the help with ANOVA and its graphical results.References
- World Drug Report 2019, United Nations, 2019, https://wdr.unodc.org/wdr2019/index.html Search PubMed.
- Marijuana Overview, 2019, http://www.ncsl.org/research/civil-and-criminal-justice/marijuana-overview.aspx Search PubMed.
- B. Pearl, Ending the War on Drugs: By the Numbers, Center for American Progress, 2018, https://www.americanprogress.org/issues/criminal-justice/reports/2018/06/27/452819/ending-war-drugs-numbers/ Search PubMed.
- C. Burnier, P. Esseiva and C. Roussel, Talanta, 2019, 192, 135–141 CrossRef CAS PubMed.
- S. Zivovinovic, R. Alder, M. D. Allenspach and C. Steuer, J. Anal. Sci. Technol., 2018, 9, 1–10 CrossRef.
- B. Patel, D. Wene and Z. T. Fan, J. Pharm. Biomed. Anal., 2017, 146, 15–23 CrossRef CAS PubMed.
- B. Nie, J. Henion and I. Ryona, J. Am. Soc. Mass Spectrom., 2019, 30, 719–730 CrossRef CAS PubMed.
- K. Leslie, J. Fleischer, S. Jones and J. Piper, Popular Police Field Tests Can’t Tell the Difference Between CBD and Marijuana, NBC, Washington, 2019, https://www.nbcwashington.com/news/local/popular-police-field-tests-cant-tell-the-difference-between-cbd-and-marijuana/159828/ Search PubMed.
- D. Kurouski, R. P. Van Duyne and I. K. Lednev, Analyst, 2015, 140, 4967–4980 RSC.
- E. Hager, C. Farber and D. Kurouski, Forensic Chem., 2018, 9, 44–49 CrossRef CAS.
- C. Farber and D. Kurouski, Anal. Chem., 2018, 90, 3009–3012 CrossRef CAS PubMed.
- L. Sanchez, C. Farber, J. Lei, K. Zhu-Salzman and D. Kurouski, Anal. Chem., 2019, 91, 1733–1737 CrossRef CAS PubMed.
- C. Farber, M. Mahnke, L. Sanchez and D. Kurouski, Trends Anal. Chem., 2019, 118, 43–49 CrossRef CAS.
- H. G. Edwards, D. W. Farwell and D. Webster, Spectrochim. Acta A Mol. Biomol. Spectrosc., 1997, 53, 2383–2392 CrossRef.
- N. Tschirner, K. Brose, M. Schenderlein, A. Zouni, E. Schlodder, M. A. Mroginski, P. Hildebrandt and C. Thomsen, Phys. Status Solidi, 2009, 246, 2790–2793 CrossRef CAS.
- K. De Gussem, P. Vandenabeele, A. Verbeken and L. Moens, Spectrochim. Acta A Mol. Biomol. Spectrosc., 2005, 61, 2896–2908 CrossRef PubMed.
- H. G. M. Edwards, D. W. Farwell and D. Webster, Spectrochim. Acta A Mol. Biomol. Spectrosc., 1997, 53, 2383–2392 CrossRef.
- U. P. Agarwal and S. A. Ralph, Appl. Spectrosc., 2016, 51, 1648–1655 CrossRef.
- U. P. Agarwal, Front. Plant Sci., 2014, 5, 1–12 Search PubMed.
- Y. S. Mary, C. Y. Panicker and H. T. Varghese, Orient. J. Chem., 2012, 28, 937–941 CrossRef CAS.
- M. M. Yu, H. G. Schulze, R. Jetter, M. W. Blades and R. F. Turner, Appl. Spectrosc., 2007, 61, 32–37 CrossRef CAS PubMed.
- Y. Cao, D. Shen, Y. Lu and J. Huang, Ann. Bot., 2006, 97, 1091–1094 CrossRef CAS PubMed.
- G. Devitt, K. Howard, A. Mudher and S. Mahajan, ACS Chem. Neurosci., 2018, 9, 404–420 CrossRef CAS PubMed.
- F. Adar, Spectroscopy, 2017, 32, 12–20 Search PubMed.
- L. Kang, K. Wang, X. Li and B. Zou, J. Phys. Chem. C, 2016, 120, 14758–14766 CrossRef CAS.
- U. P. Agarwal, Planta, 2006, 224, 1141–1153 CrossRef CAS PubMed.
- K. Sivashanmugan, K. Squire, A. Tan, Y. Zhao, J. A. Kraai, G. L. Rorrer and A. X. Wang, ACS Sens., 2019, 4, 1109–1117 CrossRef CAS PubMed.
- S. Hoshino, H. Hosoya and S. Nagakura, Can. J. Chem., 1966, 44, 1961–1965 CrossRef CAS.
Footnote |
| † Electronic supplementary information (ESI) available: HPLC results of cannabis analyses and Fig. S1 and S2. See DOI: 10.1039/c9ra08225e |
| This journal is © The Royal Society of Chemistry 2020 |