
 Open Access Article
 This Open Access Article is licensed under a Creative Commons Attribution-Non Commercial 3.0 Unported Licence
The role of urea in the solubility of cellulose in aqueous quaternary ammonium hydroxide†
Mikayla G. Waltersa,
Albaraa D. Mandoa,
W. Matthew Reichert b,
Christy W. Westa,
Kevin N. Westa and
Brooks D. Rabideau*a
b,
Christy W. Westa,
Kevin N. Westa and
Brooks D. Rabideau*a
aDepartment of Chemical & Biomolecular Engineering, The University of South Alabama, Mobile, Alabama 36688, USA. E-mail: brabideau@southalabama.edu; Fax: +1 251 461 1485; Tel: +1 251 460 7147
bDepartment of Chemistry, The University of South Alabama, Mobile, Alabama 36688, USA
First published on 6th February 2020
Abstract
We examine the role of water and urea in cellulose solubility in tetrabutylammonium hydroxide (TBAH). Molecular dynamics simulations were performed for several different solvent compositions with a fixed cellulose fraction. For each composition, two simulations were carried out with cellulose fixed in each of the crystalline and the dissolved states. From the enthalpy and the entropy of the two states, the difference in Gibbs free energy (ΔG) and hence the spontaneity is determined. A comparison with solubility experiments showed a strong correlation between the calculated ΔG and the experimental measurements. A breakdown of the enthalpic and entropic contributions reveals the roles of water and urea in solubility. At high water concentration, a drop in solubility is attributed to both increased enthalpy and decreased entropy of dissolution. Water displaces strong IL–cellulose interactions for weaker water–cellulose interactions, resulting in an overall enthalpy increase. This is accompanied by a strong decrease in entropy, which is primarily attributed to both water and the entropy of mixing. Adding urea to TBAH(aq) increases solubility by an addition to the mixing term and by reducing losses in solvent entropy upon dissolution. In the absence of urea, the flexible [TBA]+ ions lose substantial degrees of freedom when they interact with cellulose. When urea is present, it partially replaces [TBA]+ and to a lesser extent OH− near cellulose, losing less entropy because of its rigid structure. This suggests that one way to boost the dissolving power of an ionic liquid is to limit the number of degrees of freedom from the outset.
1 Introduction
Cellulose, the main structural component of plant cell walls, is the most abundant organic polymer on Earth. As such, it is a largely underutilized, renewable alternative to petroleum for the production of fuels, chemicals, and materials.1–3 Much of this underutilization stems from its strong resistance to both dissolution and enzymatic deconstruction, collectively referred to as biomass recalcitrance.4 At room temperature, cellulose is insoluble in water as well as most organic solvents and those in current use are toxic, generate hazardous vapor, are costly, lack thermal stability, are highly volatile, are difficult to recover, or require labor-intensive pretreatment and long stirring periods.5,6 A number of ionic liquids (ILs) having a high cellulose-dissolving capacity have been discovered in recent years.7,8 These ILs commonly include cations incorporating imidazolium,9–11 pyrolidinium,12–15 quaternary ammonium and phosphonium,14 and superbase cations16,17 paired with anions such as carboxylates, dialkyl phosphates, chloride, and hydroxide, which have high hydrogen bond basicities.6,16,18 All of these, however, suffer from limitations such as high cost, high viscosity, ineffectiveness in the presence of trace water,19–22 low chemical and thermal stability, and energy intensive recovery. Nevertheless, there have been notable improvements made in ILs for cellulose dissolution in the past few years and likely more to be made due to the tunable nature of these solvents. One notable improvement has been the development of [DBNH]OAc, an IL that has a high capacity for dissolving cellulose, favorable rheological properties for spinning processes, and a more facile recovery.23Another promising solvent class is quaternary onium hydroxides. Both tetrabutylammonium hydroxide (TBAH) and tetrabutylphosphonium hydroxide (TBPH) have been shown to rapidly dissolve up to 20 wt% cellulose at room temperature.24,25 Furthermore, these solvents function in the presence of large amounts of water, nearly half by weight, and have hygroscopic points near the optimal composition for solubility.26 Studies of these systems have shown that [TBA]+ preferentially solvates cellulose and that the cation's hydrophobicity promotes dissolution.27,28 Additionally, the addition of urea to aqueous TBAH systems has been found to promote dissolution under certain conditions.29 It was concluded that the main role of urea in these systems is to adjust the solvent amphiphilicity, which would enhance interactions with amphiphilic cellulose.
Urea and thiourea have also been found to promote cellulose dissolution in aqueous alkaline hydroxides.30 Interestingly, solubility only occurs at very low temperatures (<10 °C) following a freeze/thaw procedure. The authors determined that both NaOH and urea form hydrates that are integral to dissolution.31 Specifically, it was concluded that NaOH hydrates interact directly with cellulose, forming an inclusion complex while the urea hydrates remain away from cellulose, preventing agglomeration. This indirect role of urea was further noted in a recent study looking at dissolution and gelation in cellulose solutions, where it was surmised that the primary role of urea is to weaken hydrophobic interactions.32 This same conclusion was also reached regarding urea's promotion of solubility in aqueous solutions of amino acids and proteins.33–35 Interestingly, urea has been shown to concentrate at cellulose surfaces in solutions of pure aqueous urea.36,37 Though similar in structure to alkaline hydroxides, it is unclear if urea plays a similar role in aqueous TBAH solutions, especially considering dissolution in the latter occurs near room temperature.
A number of factors are frequently referenced as being important for cellulose dissolution. This includes solvents that are capable of disrupting cellulose's dense hydrogen bond network,38 that weaken hydrophobic forces between the sheets of cellulose bundles,39,40 and that have an optimal density.41 Likely, all of these factors are important as suggested by molecular dynamics studies showing that effective cellulose solvents must be versatile.42 MD studies have generally concluded that the hydrophobic cations interact via van der Waals forces with the nonpolar backbone of cellulose while the anion, which is typically polar, form strong hydrogen bonds with cellulose's hydroxyl groups.43–47
More recently, it's been suggested that cellulose ionization may contribute to solubility in alkaline solutions.48 This renewed interest has been driven by electrophoretic NMR results showing that cellobiose acts as an acid and undergoes two dissociation states at a pH of 12 and 13.5.49 These results were further supported by MD results showing that ionization of the cellulose prevents agglomeration. While the study herein does not include the effects of ionization, it is expected that they would only further enhance solubility.
The goal of this work is to elucidate the physical origin of cellulose solubility in TBAH/urea(aq) (Fig. 1). More specifically, we wish to distinguish the role of water and urea in this process. Molecular dynamics (MD) simulations were performed for different compositions of IL, water, and urea with a fixed fraction of cellulose. The free energy of dissolution was calculated for each composition, indicating whether or not the fixed fraction of cellulose should, in fact, dissolve. To validate the predictions, solubility experiments were conducted for a subset of the compositions. It was found that the compositions dissolving the largest amounts of cellulose in the experiments also had the most negative free energy values as determined by simulation. This comparison provides confidence that the simulations accurately capture the physical phenomena and that the subsequent interpretation of the breakdown in the thermodynamic driving forces is solid. A better understanding of the physical origins of cellulose solubility in these systems should help in the identification of new solvents that are more effective, more environmentally benign, and lower in cost than those currently in use.
 | ||
| Fig. 1 Structures of the individual components of the TBAH/urea solvent system. | ||
2 Methods
2.1 Thermodynamic considerations
The spontaneity of dissolution is determined by the sign of the change in Gibbs free energy:| ΔG = ΔH − TΔS. | (1) |
This quantity is dictated by a combination of enthalpic and entropic terms. Note that negative changes in the enthalpy and positive changes in the entropy favor dissolution, however solubility is ultimately determined as the delicate balance between these two terms. When cellulose dissolves in a good solvent for example, the existing network of hydrogen bonds within a crystalline bundle must be broken. This corresponds to a large positive change in the enthalpy. To overcome this and edge towards solubility, it would be beneficial if the solvent was able to form stronger hydrogen bonds with cellulose that outweigh this positive change from breaking apart the bundle. Additionally, when cellulose dissolves, the unbound chains typically gather additional translational, rotational, vibrational, and conformational degrees of freedom that leads to a large positive change in the entropy. At the same time, the solvent may form new hydrogen bonds with cellulose, losing translational and rotational freedom in the process that would correspond to a loss in entropy. Of course, this is only part of the story. For strongly self-associating solvents like ionic liquids or those capable of forming hydrogen bonds there can be a large enthalpic penalty associated with separating associated pairs and forming new hydrogen bonds or strong interactions with cellulose. Furthermore, the changes in the local structure can further influence the overall changes in the entropy. Water, for example, avoids interaction with the nonpolar backbone of cellulose, instead forming strongly associative cage-like structures at these interfaces, losing significant entropy in the process. It is the combination of all of these effects that determines the sign of ΔG and whether or not cellulose will dissolve and to what extent. We note here that a number of computational studies only consider the dissolved state of cellulose and in doing so overlook some of these more complicated solvent effects. The two-state method employed in this study should provide a complete view of the important factors that influence solubility.
2.2 Modeling
Explicit, all-atom MD simulations were performed with LAMMPS.50 [TBA]+ and urea were modeled using the General AMBER Force Field (GAFF).51 Hydroxide was modeled using the recent set of parameters developed by Bonthuis.52 This model was chosen because it was optimized to accurately reproduce hydration free energies, which is likely important for the thermodynamic calculations of this study. One drawback is that this is a single point model that does not explicitly account for the hydrogen atom. The effect of this is that hydroxide can only participate as a hydrogen bond acceptor and not as a donor. The SPC/E model53 was selected for water, since it was used in the parameterization of the hydroxide model. GLYCAM06 (ref. 54) was used to model cellulose. The cellulose Iβ polymorph was used as the crystalline bundle, as this is the primary structure found in plants. This structure was taken from the crystallographic data determined via X-ray and neutron diffraction.55 The bond lengths in hydroxide and water, and the water angle were held rigid using SHAKE.56,572.3 Simulation details
Initial configurations for the simulations were prepared with PACKMOL.58 Specified amounts of each substance were packed into simulation boxes of predetermined size. A detailed makeup of these compositions is given in Table 1. The box length in the z direction was 41.52 Å, which corresponds to the length of the cellulose strand composed of 8 anhydroglucose units (AGU). The box lengths in the x and y directions were identical and set by the predetermined box volume, which was estimated assuming ideal mixing. Each of the cellulose strands were connected to themselves through the periodic boundaries in the z direction, allowing us to approximate semi-infinite chains and bundles as shown in Fig. 2. When packing the solvent molecules, a buffer zone of 1 Å was used along all of the periodic faces to prevent atomic overlaps through the periodic boundaries. Because the cellulose chains are connected through the periodic boundaries, which are predetermined by the strand length, they were present in this buffer zone. For all of the compositions, the box lengths in the x and y directions were roughly 100 Å, and the simulations consisted of around 40![[thin space (1/6-em)]](https://www.rsc.org/images/entities/char_2009.gif) 000 atoms. A spring force with a stiffness constant of 10 kcal mol−1 Å−2 was used to tether the C1 atoms of one AGU in each of the strands. This prevented the crystalline bundle from dissolving and the dissolved state from agglomerating, ensuring that the free energy difference that is measured is strictly between the idealized crystalline and dissolved states. Effectively, these tethers restrain the entropy of cellulose, which must be recovered through an additional corrective term. This additional term accounts for this missing entropy of the strands and bundles by treating them as translating and rotating rigid rods.59,60 As noted earlier, if the Gibbs free energy difference between the dissolved and the crystalline state is positive the crystalline state is favored and dissolution should not occur if the tethers were to be released. Conversely, if the Gibbs free energy difference is negative, then dissolution should occur.
000 atoms. A spring force with a stiffness constant of 10 kcal mol−1 Å−2 was used to tether the C1 atoms of one AGU in each of the strands. This prevented the crystalline bundle from dissolving and the dissolved state from agglomerating, ensuring that the free energy difference that is measured is strictly between the idealized crystalline and dissolved states. Effectively, these tethers restrain the entropy of cellulose, which must be recovered through an additional corrective term. This additional term accounts for this missing entropy of the strands and bundles by treating them as translating and rotating rigid rods.59,60 As noted earlier, if the Gibbs free energy difference between the dissolved and the crystalline state is positive the crystalline state is favored and dissolution should not occur if the tethers were to be released. Conversely, if the Gibbs free energy difference is negative, then dissolution should occur.
| Sim. | Cellulosea (wt%) | H2Ob (wt%) | Ureac (wt%) | IL (no.) | H2O (no.) | Urea (no.) |
|---|---|---|---|---|---|---|
| a Cellulose/(cellulose + IL + H2O + urea).b H2O/(IL + H2O).c Urea/(H2O + urea). | ||||||
| 1 | 10 | 40 | 0 | 486 | 4866 | 0 |
| 2 | 10 | 40 | 17 | 450 | 4320 | 259 |
| 3 | 10 | 40 | 25 | 429 | 4117 | 412 |
| 4 | 10 | 40 | 33 | 405 | 3888 | 583 |
| 5 | 10 | 40 | 40 | 384 | 3683 | 737 |
| 6 | 10 | 40 | 55 | 328 | 3149 | 1137 |
| 7 | 10 | 60 | 0 | 324 | 6999 | 0 |
| 8 | 10 | 60 | 17 | 289 | 6249 | 375 |
| 9 | 10 | 60 | 25 | 270 | 5832 | 583 |
| 10 | 10 | 60 | 33 | 249 | 5384 | 807 |
| 11 | 10 | 60 | 40 | 231 | 4999 | 1000 |
| 12 | 10 | 60 | 55 | 188 | 4063 | 1468 |
 | ||
| Fig. 2 Cross sections of the (left) crystalline and (right) dissolved states of cellulose. Colors indicate (blue) cellulose, (yellow) tetrabutylammonium, (green) hydroxide, (orange) urea, and (red) water. | ||
A cutoff of 12 Å was used for all nonbonded interactions. Long-range electrostatic interactions were calculated using the PPPM61 algorithm with an accuracy of 10−5 kcal mol−1 Å−1. Initially, the positions of all of the cellulose atoms were frozen in place. To minimize large forces resulting from packing, the solvent was equilibrated for 10000 timesteps of 0.1 fs in the NVT ensemble at 300 K using a Nosé–Hoover thermostat with a thermocouple of 100 fs.62 The timestep was then increased to 1 fs and the solvent further equilibrated for 1 ns in the same ensemble and conditions. Following solvent equilibration the cellulose was unfrozen, the velocities of all atoms rescaled to a temperature of 0.1 K, and the entire system slowly heated from 0.1 K to 300 K in the NVT ensemble over the course of 1 ns. The entire system was equilibrated another 8 ns in the NPT ensemble at 300 K and 1 bar using a Nosé–Hoover thermostat with a thermocouple of 100 fs and barostat with a barocouple of 1000 fs.62 The x and y box dimensions were coupled and the z box dimensions scaled independently of the other two dimensions. A production run of 10 ns was then run under the identical conditions of the previous 8 ns run. Atomic trajectories were written every 20 ps and thermodynamic data every 100 fs.
2.4 Hydrogen bond analysis
Hydrogen bonds between cellulose, hydroxide, water, and urea were found for selected simulations using a set of geometric criteria.63 For the hydrogen bond OD–H⋯OA, where OD is the donor oxygen, H the donor hydrogen, and OA the accepting oxygen, this criteria requires that the distance between OD and OA be less than 3.5 Å that the distance between H and OA be less than 2.45 Å, and that the H–OD–OA angle be less than 30°. These criteria have been used in numerous studies to look at hydrogen bond dynamics in aqueous systems.64–68As noted earlier, the hydroxide model used in this study, which was chosen uniquely for its ability to capture the thermodynamics of solvation, does not contain an explicit hydrogen atom. Therefore, this hydroxide model is only capable of accepting hydrogen bonds and these H-bond results should be interpreted with care.
2.5 Two-phase thermodynamic method
The two-phase thermodynamic method (2PT)69,70 can be used to estimate entropy for MD simulations. This has been implemented successfully to estimate standard molar entropies and heat capacities of common liquid-phase solvents.71 The following is a summary of how it is applied in this study, with more details in the ESI.† First, the velocity of each atom consists of translational, rotational, and vibrational modes:| vtoti = vtrni + vroti + vvibi | (2) |
 | (3) |
 | (4) |
 | (5) |
To implement this method, short high definition trajectories were produced at intermittent points throughout the production run. For each trajectory, the positions and velocities of all atoms were recorded with a frequency of 4 fs for a duration of 20 ps. A total of 100 independent trajectories were analyzed for each state and composition. This spanned the 10 ns production run at an interval of 0.1 ns. This large number of independent trajectories was necessary to obtain an estimate of the mean entropy with a low uncertainty.
2.6 Solubility experiments
Previous experiments looking at cellulose solubility in TBAH studied the influence of water concentration on the solubility limit.25,72 Solubility experiments with TBAH/urea mixtures reported solution turbidities as a function of urea concentration for a fixed amount of cellulose. Few quantitative measurements relating cellulose solubility with urea content in TBAH solutions are available. This data is useful for validation of our calculations, therefore we performed our own set of dissolution experiments in a manner similar to that of others.TBAH 30-hydrate (>98.0%) was provided by Sigma-Aldrich. Water was evaporated from the sample at 30 °C, which was then tested for water content using Karl Fischer titration. 18 MΩ millipore water was then re-added to the samples to bring them exactly to 60 wt% water. Urea (99.0%) was provided by ACROS Organics™. Urea pellets were crushed in a small mortar and pestle to allow for precisely controlled addition of urea to the solvent mixture. Microcrystalline cellulose having an average particle size of 90 μm was provided by ACROS Organics™ and served as the cellulose in the dissolution experiments.
The cellulose was dried overnight in a vacuum oven prior to use. For the solubility experiments, two grams of TBAH containing 60 wt% water was first added to a jacketed cell. Next, a specified amount of crushed urea was added. Cellulose was added to the TBAH/urea mixture in increments of 2.5 wt% and allowed to dissolve, typically on the order of a few hours. The temperature within the cell was maintained at 25 °C via temperature controlled fluid flowing through the jacketed cell. The samples were stirred with a cylindrical stir bar with a serrated top. Solubility was determined visually and was readily apparent from the turbidity of the solution. If the sample was clear more cellulose was incrementally added until the solution became turbid.
We note that the solubility of small quantities of cellulose was accompanied by a color change of the solution from clear to pale yellow. At higher cellulose concentrations the color became a dark amber, however cellulose could still be regenerated through the addition of excess water.
3 Results and discussion
3.1 Experimental validation
It is first important to determine how well the molecular models and simulation methods are able to capture the actual thermodynamic driving forces. To do so, the maximum experimental solubility is compared with the calculated values of ΔG for selected systems of this study. Abe reported maximum solubilities in TBAH between 30 wt% and 60 wt% water at room temperature. Wei reported solution turbidities of TBAH/urea mixtures with a fixed cellulose amount and a variable concentration of urea, finding that 7 wt% of cellulose can be dissolved in 17 wt% urea. Due to the lack of solubility data that is available for TBAH/urea mixtures, four additional measurements were performed in this study. Each measurement was made with TBAH with 40 wt% water and 0, 17, 25, and 40 wt% urea. A comparison of the experimental solubilities with the calculated ΔG values from the two-state simulations is given in Fig. 3.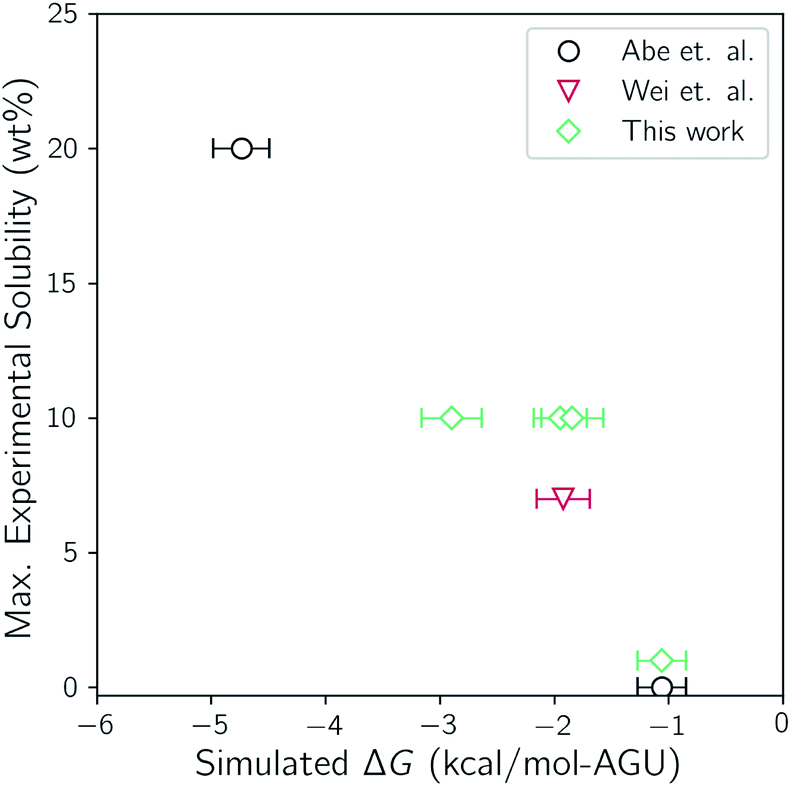 | ||
| Fig. 3 Comparison of the simulated ΔG values from the two-state simulations to the maximum cellulose solubility from experiment. | ||
There is a clear trend between the two, indicating a good fit between simulation and experiment. Furthermore, both are in agreement with the most soluble solvent composition and the least soluble solvent composition; 40 wt% water with no urea and 60 wt% water with no urea, respectively. Note that the trend does not intersect with the origin. As noted earlier, the translational and rotational entropy of cellulose upon dissolution is underestimated because of the tethering restraints. This, however, is corrected for by treating the strands and bundle as translating and rotating rigid rods. The connection of the bonds through the periodic boundaries, conversely, effectively prevents conformational flexibility and is not corrected for. It has been shown that some ILs can increase the conformational flexibility of cellulose by disrupting intrastrand hydrogen bonding.73,74 It is believed that this slight underestimation of ΔG is a result of this additional conformational flexibility that is not accounted for.
3.2 Gibbs free energy
The enthalpy change for our conditions is defined as:| ΔH = ΔU + pΔV, | (6) |
The entropy was determined using the 2PT method. Since the entropy and enthalpy are coupled and the entropy was determined for each of the short 20 ps trajectories, we also used the average enthalpy from each of these short trajectories to construct the corresponding Gibbs free energy. The mean values and uncertainties were then calculated from the 100 trajectories for each state and the difference between the two state determined. These values are displayed in Fig. 4. This figure also shows the enthalpic (ΔH) and entropic (−TΔS) contributions to ΔG for each of the simulations.
 | ||
| Fig. 4 Effect of urea on the enthalpic and entropic contributions to ΔG in (top) 40 wt% water and (bottom) 60 wt% water. Error bars represent the standard uncertainties. | ||
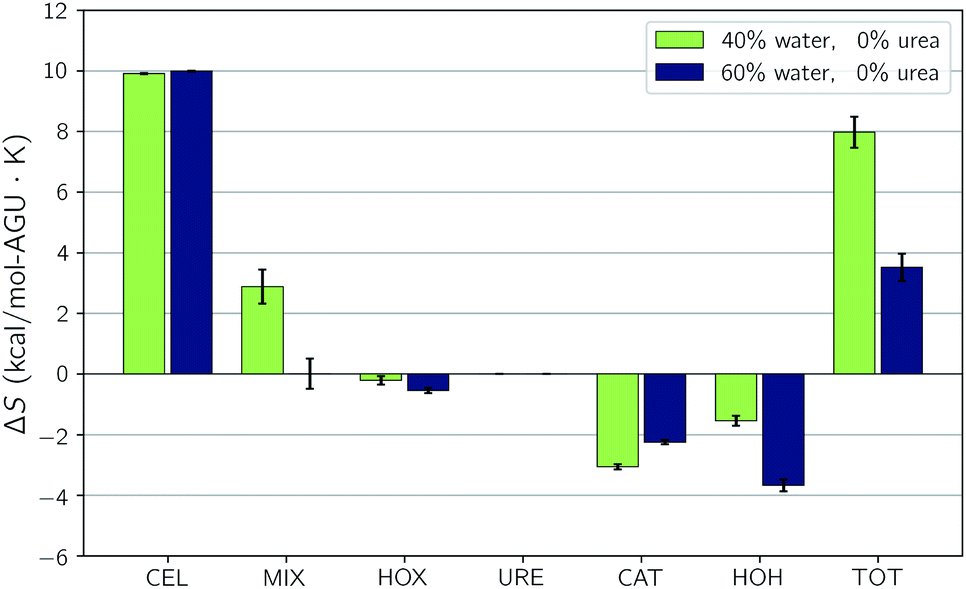
Note that the simulations with only 40 wt% water and low urea content have the largest negative free energy differences. This indicates the highest driving force for dissolution and is composed equally of enthalpic and entropic contributions. At 40 wt% urea the enthalpic contribution drops off significantly and becomes negligible at 55 wt%. This indicates that the addition of urea at this water concentration has a negligible effect on dissolution at low concentrations and a detrimental effect at high concentrations.
Comparing the 40 wt% water simulation without urea with the 60 wt% water simulation without urea shows that the addition of water has an inhibitory effect on dissolution. Moreover, this figure shows that this is brought about by significant increases is the both the enthalpic and entropic terms. As urea is added to the 60 wt% water simulation however, dissolution becomes more favorable. At lower urea concentrations this is brought about by a strengthening of the entropic term and at 40 and 55 wt% urea a slight strengthening of the enthalpic term. In all of the dissolution experiments it was found that the compositions containing 60 wt% water and 17 wt% or more urea were capable of dissolving at least 10 wt% cellulose. Without urea, these solvents were only capable of dissolving 1 wt% cellulose. Therefore, the simulations suggest that the addition of urea to the solvent containing 60 wt% water enhances solubility entropically. In the next few sections, we break down the enthalpic and entropic terms to better understand the precise reasons for this.
3.3 Component energy & entropy changes
The change in internal energy is defined as| ΔU = ΔUpair + ΔUmol, | (7) |
The component interaction energy and entropy changes for the simulation with 40 wt% water and no urea can be considered representative of all of the simulations that were conducted. These changes can be found in Fig. 5. The three largest changes in the interaction energy involve ion attraction and repulsion. These include changes in ion self-interactions, which are both favorable, and cation–anion interactions, which are unfavorable. This agrees with our earlier depiction of the thermodynamic considerations of dissolution, in which strongly self-associating ion pairs must be broken apart before they can reform with cellulose. Additionally, this shows that the cation–cation and hydroxide–hydroxide repulsions are reduced by this separation, which partially counteracts the energy required to break the pairs apart.
 | ||
| Fig. 5 Changes upon dissolution of the individual components of (top) the pairwise interaction energy and (bottom) the entropy for simulation 1. Error bars represent the standard uncertainties. | ||
The next largest change is in the hydroxide–water interaction. Prior to dissolution, it was found that the hydroxide ions reside in a hydrated state. In order for hydroxide to form new hydrogen bonds with the hydroxyl groups of cellulose hydroxide must first be separated from the water, which is unfavorable. This energy penalty, however, is almost completely recovered by the formation of these strong hydroxide–cellulose bonds, which is the third largest change in interaction energy. Also note that there is a new favorable interaction between the cation and cellulose upon dissolution, though this is a third of the anion–cellulose energy. This reflects the anions strong hydrogen bond accepting ability. Additionally, as water is separated from the hydroxide ions they form new self-associations with a significant strength. Finally, note that the sum of these large swings in each interaction are what lead to an overall negative interaction change, favoring dissolution.
Component entropy changes are also shown in Fig. 5. Here the entropy change is dominated by cellulose and consists almost exclusively of the rigid rod correction. This means that the dominant effect on the overall increase in entropy is the liberation of free cellulose chains. Also note that all of the components of the solvent lose entropy on dissolution and that there is a substantial change in the entropy of mixing that further favors dissolution. In the next few sections we take an in-depth look at the changes in dissolution favorability that is brought about by changes in water and urea concentration.
3.4 Hydrogen bonding
The changes in the number of hydrogen bonds upon dissolution are given for selected compositions in Table 2. Note that none of the compositions show a significant increase in the number of hydrogen bonds, which might favor dissolution. Even the TBAH with 40 wt% water and no urea only gains 0.04 hydrogen bonds per AGU. If these changes were to be weighted by the average strength of each H-bond type, it is possible that some of these would results in enthalpy changes that favor dissolution.| Type | 40% | 40% | 40% | 60% | 60% | 60% |
|---|---|---|---|---|---|---|
| 0% | 33% | 55% | 0% | 33% | 55% | |
| CEL–CEL | −0.97 | −1.04 | −0.92 | −0.63 | −0.71 | −1.03 |
| CEL–HOX | 1.23 | 0.78 | 0.47 | 0.87 | 0.61 | 0.44 |
| CEL–HOH | 1.36 | 1.38 | 1.26 | 2.09 | 1.86 | 1.45 |
| CEL–URE | — | 0.61 | 1.14 | — | 0.60 | 1.36 |
| HOX–HOH | −1.35 | −0.64 | −0.71 | −0.93 | −0.56 | −0.34 |
| HOX–URE | — | −0.10 | −0.04 | — | −0.09 | −0.27 |
| HOH–HOH | −0.24 | −0.52 | −0.40 | −1.23 | −1.31 | −0.86 |
| HOH–URE | — | 0.04 | −0.54 | — | −0.46 | −0.91 |
| URE–URE | — | −0.42 | −0.67 | — | −0.18 | −0.48 |
| Total | 0.04 | 0.09 | −0.41 | 0.16 | −0.24 | −0.64 |
Table 2 also shows that higher urea contents equate with larger losses in hydrogen bonds. For the simulations with 60 wt% water, weighting by the average energy of H-bond types is unlikely to result in a favorable enthalpy change caused by hydrogen bonding. Thus, an attempt to understand dissolution favorability from hydrogen bonding alone is inconclusive. A further breakdown of hydrogen bonding can be found in Tables S4 and S5 of the ESI.†
3.5 The effect of water
Both the experimental measurements and the calculated Gibbs free energy changes showed that TBAH with 40 wt% water is able to dissolve significantly more cellulose than TBAH with 60 wt% water (see Fig. 3). Comparing the enthalpic and entropic contributions of the two (Fig. 2), it is apparent that both terms are significantly weaker for TBAH with 60 wt% water. Focusing first on this enthalpic difference, we can look at the difference in the change of the pairwise interaction energy, ΔΔUpair, between TBAH with 40 wt% water and TBAH with 60 wt% water. These values are given in Table 3. This table provides a breakdown of all of the contributions grouped at various resolutions. The far right, or lowest resolution, shows that the overall difference in the change is a positive value of 1.7 kcal per mol per AGU. This is the majority of the roughly 2.3 kcal per mol per AGU difference in the enthalpies (i.e. the green bars at the far left of both entries in Fig. 4). At medium resolution, we see that the AQ–CEL contributions (i.e. the interactions of the IL, urea, and water with cellulose) are what contribute the most to this unfavorable change in the driving force for dissolution. If we follow this contribution back to the highest resolution at the far left, we see that [TBA]+ (+2.2 kcal per mol per AGU) and hydroxide (+9.4 kcal per mol per AGU) are pushed off of cellulose and partially replaced by new water–cellulose (−9.3 kcal per mol per AGU) interactions. Interestingly, the lost HOX–CEL interactions are almost fully recovered by the HOH–CEL interactions, but there is still a significant loss from lost CAT–CEL interactions. Therefore, the presence of water clusters along the equatorial plane of cellulose may be large enough to obstruct the large hydrophobic cation from optimal alignment with cellulose's nonpolar backbone to the extent that it was beforehand. |
Fig. 4 also shows that there is a substantial loss in entropy (an increase in −TΔS) – at the higher water concentration. The change in entropy for each component between these two compositions is given in Fig. 6. This figure shows that most of this drop in entropy originates from both the mixing term and water, in roughly equal parts. A hallmark of the hydrophobic effect is a large loss in water entropy at the hydrophobic interface. It is unclear whether or not the loss in entropy here occurs at the cellulose interface or rather in the bulk solvent due to the redistribution of solvent molecules upon dissolution.
 | ||
| Fig. 6 Changes upon dissolution of the individual components of the entropy for the simulations without urea. Error bars represent the standard uncertainties. | ||
3.6 The effect of urea
The addition of urea to TBAH with 40 wt% water has a limited effect at concentrations below 33 wt% and a detrimental effect on solubility at higher concentrations. From 30 to 40 wt% urea there is a steep drop off in the strength of the enthalpic contribution, which would cause a drop in solubility. The breakdown in the pairwise interaction changes between these two compositions (see Table S3 of the ESI†) shows this is almost exclusively caused by an unfavorable change in the hydroxide–water interaction energy. This change is one part of a large shift in all of the solvent–solvent interactions, the remainder of which cannot compensate for the loss in hydroxide–water interactions. At these high concentrations it's quite possible that urea begins to act as a chaotrope, preventing water from properly solvating the hydroxide ions.The addition of urea to TBAH with 60 wt% water continues to enhance solubility up to a concentration of 40 wt% urea. At low urea concentrations this enhancement is driven by an increase in entropy. The largest effect is seen between 0 wt% urea with 33 wt% urea where the enthalpic contributions strengthens very modestly and the entropic contribution nearly doubles. The change in the pairwise interaction energy between these two states is shown in Fig. 7. The inset of this figure shows that the ΔΔUpair, essentially the difference due to composition of the change in the interaction energy upon dissolution, is quite small – only 0.6 kcal per mol per AGU. This agrees with our earlier assessment that the enthalpic difference does not play a large role. Also note that this is driven by large redistributions in the interactions of all of the components. The changes in the component entropy are provided in Fig. 8. Here one sees a very large increase in the total entropy of the system at 33 wt% urea. Further, this results from increases in both the entropy of mixing and the entropy of the IL. Urea loses entropy in the process but the overall net effect is a strong increase in the overall entropy. In the next section we look at the changes in solvent structure that accompanies this entropic increase.
 | ||
| Fig. 7 Component interaction energy changes for (open bars) 40 wt% water–0 wt% urea and (cross-hatched bars) 40 wt% water–33 wt% urea. Inset shows the difference in the change. | ||
 | ||
| Fig. 8 Changes upon dissolution of the individual components of the entropy. Error bars represent the standard uncertainties. | ||
3.7 Changes in solvent structure
To understand how the addition of urea influences the local environment around cellulose, two-dimensional histogram plots of the spatial positions of selected atoms around the axis of cellulose were constructed. These are displayed for TBAH with 60 wt% water, both with and without urea, in Fig. 9. Without urea, the cation is skewed relative to the anhydroglucose plane, residing near the methylhydroxyl side of the AGU but generally above and below the plane. With urea, the density of cations within the first solvation shell is significantly reduced and partially shifts outward. Additionally, the added urea resides preferentially almost directly above and below the plane along the hydrophobic face of cellulose. | ||
| Fig. 9 Spatial occurrence relative to the cross section of a dissolved cellulose strand for (left) cations in the 60 wt% IL, 00 wt% urea simulation, (middle) cations in the 60 wt% IL, 33 wt% urea simulation, and (right) urea in the 60 wt% IL, 33 wt% urea simulation. Occurrence values refer to the total number of cations present at each of the locations relative to the nearest AGU, a cumulative total for all 144 AGUs. | ||
To further illustrate the structural changes taking places near cellulose, we constructed pairwise radial distribution functions. These functions were constructed to show the locations of the cations (N atoms) and urea (central C atom) relative to cellulose (backbone atoms). These plots are given in Fig. 10.
 | ||
| Fig. 10 Pair–pair radial distribution functions for cations–cellulose and urea–cellulose for TBAH and 60 wt% water with and without urea. The N atoms served as the center of the cation, the central C atom for urea and all backbone atoms for cellulose. | ||
Ordinarily, the job of [TBA]+ is to interact with the hydrophobic backbone of cellulose. Due to its large size and ensuing degrees of freedom however, it loses substantial configurational entropy. When urea is added it is able to replace [TBA]+ in these areas, losing less entropy in the process. Moreover, urea forms roughly 1 H-bond per AGU with dissolved cellulose, replacing some of the OH–cellulose bonds.
4 Conclusions
A series of two-state simulations were carried out at different solvent compositions with cellulose fixed in each of the crystalline and dissolved states. For each composition the Gibbs free energy of dissolution was calculated from the enthalpic and entropic differences between the two states. Additionally, solubility experiments were performed for selected compositions of TBAH, water, and urea as an additional means for comparison. We found that the calculated Gibbs free energy change is inversely related to the maximum reported solubility a given composition as one might expect. Thus the two-state method is able to accurately predict cellulose solubility for these aqueous TBAH/urea systems.A breakdown of the enthalpic and entropic contributions to the free energy changes were able to provide a molecular-level explanation for solubility. It was found that the addition of too much water, in excess of 60 wt%, inhibits solubility primarily through a reduction in the enthalpy of dissolution. Furthermore, some of the ions that interact with cellulose are replaced by water–cellulose interactions. Interestingly, water is able to recover most of the energy from the displacement of hydroxide; however the cation energy cannot be recovered. Thus, water clusters along the equatorial plane of cellulose may be large enough to preclude optimal alignment of large hydrophobic cations with the nonpolar backbone of cellulose.
If urea is added in significant amounts to TBAH at 60 wt% water, cellulose becomes soluble. A breakdown of the contributions to the free energy showed that this was primarily an entropic effect. In the absence of urea, [TBA]+ interacts with the nonpolar backbone of cellulose. Due to its large size and ensuing degrees of freedom however, it loses substantial configurational entropy in the process. When urea is added it partially replaces [TBA]+ along the nonpolar backbone, losing significantly less entropy.
Thus our findings are unlike those reported for LiOH/urea solutions. These were determined to form clathrates wherein hydrates of LiOH interact directly with cellulose. Urea, conversely, was concluded to form hydrates away from cellulose, with the primary purpose of preventing agglomeration. We find that urea in TBAH/urea solutions interact directly with cellulose. Moreover, urea forms roughly 1 H-bond per AGU with dissolved cellulose, even replacing some of the OH− H-bonds with cellulose. Its primary mechanism for increasing solubility is by replacing [TBA]+ in the interior, stemming the loss in entropy while augmenting the mixing term. Additionally, we note that the effects of cellulose ionization will be explored in a future study.
Finally, we note that many successful ILs contain small, relatively inflexible ions such as DBNH, 1-ethyl-3-methylimidazolium, 1-allyl-3-methylimidazolium, acetate, chloride, and hydroxide. Our study suggests that one way to boost the dissolving power of an IL is to limit the number of degrees of freedom from the outset.
Conflicts of interest
There are no conflicts to declare.Acknowledgements
The authors would like to acknowledge a grant of high performance computing resources and technical support from the Alabama Supercomputing Authority. Additionally, BDR would like to acknowledge a grant from the Faculty Development Council Fellows Program at USA that aided the experimental portion of this work.Notes and references
- F. Cherubini, Energy Convers. Manage., 2010, 51, 1412–1421 CrossRef CAS.
- V. Menon and M. Rao, Prog. Energy Combust. Sci., 2012, 38, 522–550 CrossRef CAS.
- A. J. Ragauskas, G. T. Beckham, M. J. Biddy, R. Chandra, F. Chen, M. F. Davis, B. H. Davison, R. A. Dixon, P. Gilna, M. Keller, P. Langan, A. K. Naskar, J. N. Saddler, T. J. Tschaplinski, G. A. Tuskan and C. E. Wyman, Science, 2014, 344, 1246843 CrossRef PubMed.
- M. E. Himmel, S.-Y. Ding, D. K. Johnson, W. S. Adney, M. R. Nimlos, J. W. Brady and T. D. Foust, Science, 2007, 315, 804–807 CrossRef CAS PubMed.
- T. Heinze and T. Liebert, Prog. Polym. Sci., 2001, 26, 1689–1762 CrossRef CAS.
- A. Xu, J. Wang and H. Wang, Green Chem., 2010, 12, 268–275 RSC.
- B. Satari, K. Karimi and R. Kumar, Sustainable Energy Fuels, 2019, 3, 11–62 RSC.
- H. Wang, G. Gurau and R. D. Rogers, Chem. Soc. Rev., 2012, 41, 1519–1537 RSC.
- R. Swatloski, S. Spear, J. Holbrey and R. Rogers, J. Am. Chem. Soc., 2002, 124, 4974–4975 CrossRef CAS.
- Y. Fukaya, K. Hayashi, M. Wada and H. Ohno, Green Chem., 2008, 10, 44–46 RSC.
- N. Sun, M. Rahman, Y. Qin, M. L. Maxim, H. Rodriguez and R. D. Rogers, Green Chem., 2009, 11, 646–655 RSC.
- T. Heinze, K. Schwikal and S. Barthel, Macromol. Biosci., 2005, 5, 520–525 CrossRef CAS.
- O. A. E. Seoud, A. Koschella, L. C. Fidale, S. Dorn and T. Heinze, ACS Sustainable Chem. Eng., 2007, 8, 2629–2647 Search PubMed.
- H. Zhao, G. A. Baker, Z. Song, O. Olubajo, T. Crittle and D. Peters, Green Chem., 2008, 10, 696–705 RSC.
- M. Zavrel, D. Bross, M. Funke, J. Buechs and A. C. Spiess, Bioresour. Technol., 2009, 100, 2580–2587 CrossRef CAS PubMed.
- A. Parviainen, A. King, I. Mutikainen, M. Hummel, C. Selg, L. K. J. Hauru, H. Sixta and I. Kilpeläinen, ChemSusChem, 2013, 6, 2161–2169 CrossRef CAS.
- O. Kuzmina, J. Bhardwaj, S. R. Vincent, N. D. Wanasekara, L. M. Kalossaka, J. Griffith, A. Potthast, S. Rahatekar, S. J. Eichhorn and T. Welton, Green Chem., 2017, 19, 5949–5957 RSC.
- A. Brandt, J. Grasvik, J. P. Hallett and T. Welton, Green Chem., 2013, 15, 550–583 RSC.
- H.-P. Fink, P. Weigel, H. Purz and J. Ganster, Prog. Polym. Sci., 2001, 26, 1473–1524 CrossRef CAS.
- S. Chrapava, D. Touraud, T. Rosenau, A. Potthast and W. Kunz, Phys. Chem. Chem. Phys., 2003, 5, 1842–1847 RSC.
- M. Mazza, D.-A. Catana, C. Vaca-Garcia and C. Cecutti, Cellulose, 2009, 16, 207–215 CrossRef CAS.
- B. D. Rabideau and A. E. Ismail, Phys. Chem. Chem. Phys., 2015, 17, 5767–5775 RSC.
- A. W. T. King, J. Asikkala, I. Mutikainen, P. Järvi and I. Kilpeläinen, Angew. Chem., Int. Ed., 2011, 50, 6301–6305 CrossRef CAS PubMed.
- M. Abe, T. Yamada and H. Ohno, RSC Adv., 2014, 4, 17136–17140 RSC.
- C. Zhong, F. Cheng, Y. Zhu, Z. Gao, H. Jia and P. Wei, Carbohydr. Polym., 2017, 174, 400–408 CrossRef CAS PubMed.
- M. Abe, K. Kuroda and H. Ohno, ACS Sustainable Chem. Eng., 2015, 3, 1771–1776 CrossRef CAS.
- M. A. Behrens, J. A. Holdaway, P. Nosrati and U. Olsson, RSC Adv., 2016, 6, 30199–30204 RSC.
- Y. Wang, L. Liu, P. Chen, L. Zhang and A. Lu, Phys. Chem. Chem. Phys., 2018, 20, 14223–14233 RSC.
- W. Wei, F. Meng, Y. Cui, M. Jiang and Z. Zhou, Cellulose, 2016, 24, 49–59 CrossRef.
- J. Cai and L. Zhang, Macromol. Biosci., 2005, 5, 539–548 CrossRef CAS PubMed.
- J. Cai, L. Zhang, S. Liu, Y. Liu, X. Xu, X. Chen, B. Chu, X. Guo, J. Xu, H. Cheng, C. C. Han and S. Kuga, Macromolecules, 2008, 41, 9345–9351 CrossRef CAS.
- L. Alves, B. Medronho, A. Filipe, F. E. Antunes, B. Lindman, D. Topgaard, I. Davidovich and Y. Talmon, Gels, 2018, 4, 87 CrossRef CAS PubMed.
- P. L. Whitney and C. Tanford, J. Biol. Chem., 1962, 237, 1735–1737 CAS.
- Y. Nozaki and C. Tanford, J. Biol. Chem., 1963, 238, 4074–4081 CAS.
- R. Zangi, R. Zhou and B. J. Berne, ACS Sustainable Chem. Eng., 2009, 131, 1535–1541 CAS.
- M. Bergenstrahle-Wohlert, L. A. Berglund, J. W. Brady, P. T. Larsson, P.-O. Westlund and J. Wohlert, Cellulose, 2012, 19, 1–12 CrossRef CAS.
- P. Chen, Y. Nishiyama, J. Wohlert, A. Lu, K. Mazeau and A. E. Ismail, J. Phys. Chem. B, 2017, 121, 2244–2251 CrossRef CAS PubMed.
- R. Remsing, R. Swatloski, R. Rogers and G. Moyna, Chem. Commun., 2006, 1271–1273 RSC.
- A. S. Gross and J.-W. Chu, J. Phys. Chem. B, 2010, 114, 13333–13341 CrossRef CAS PubMed.
- B. Lindman, G. Karlström and L. Stigsson, J. Mol. Liq., 2010, 156, 76–81 CrossRef CAS.
- M. Abe, K. Kuroda, D. Sato, H. Kunimura and H. Ohno, Phys. Chem. Chem. Phys., 2015, 17, 32276–32282 RSC.
- H. M. Cho, A. S. Gross and J.-W. Chu, J. Am. Chem. Soc., 2011, 133, 14033–14041 CrossRef CAS PubMed.
- H. Liu, K. L. Sale, B. M. Holmes, B. A. Simmons and S. Singh, J. Phys. Chem. B, 2010, 114, 4293–4301 CrossRef CAS PubMed.
- A. S. Gross, A. T. Bell and J.-W. Chu, J. Phys. Chem. B, 2011, 115, 13433–13440 CrossRef CAS PubMed.
- B. Rabideau, A. Agarwal and A. Ismail, J. Phys. Chem. B, 2014, 118, 1621–1629 CrossRef CAS PubMed.
- B. Xiong, P. Zhao, K. Hu, L. Zhang and G. Cheng, Cellulose, 2014, 21, 1183–1192 CrossRef CAS.
- S. Wang, K. Lyu, P. Sun, A. Lu, M. Liu, L. Zhuang and L. Zhang, Cellulose, 2017, 24, 1–11 CrossRef.
- B. Lindman, B. Medronho, L. Alves, C. Costa, H. Edlund and M. Norgren, Phys. Chem. Chem. Phys., 2017, 19, 23704–23718 RSC.
- E. Bialik, B. Stenqvist, Y. Fang, Å. Östlund, I. Furó, B. Lindman, M. Lund and D. Bernin, J. Phys. Chem. Lett., 2016, 7, 5044–5048 CrossRef CAS PubMed.
- S. Plimpton, J. Comput. Phys., 1995, 117, 1–19 CrossRef CAS.
- J. Wang, R. M. Wolf, J. W. Caldwell, P. A. Kollman and D. A. Case, J. Comput. Chem., 2004, 25, 1157–1174 CrossRef CAS PubMed.
- D. J. Bonthuis, S. I. Mamatkulov and R. R. Netz, J. Chem. Phys., 2016, 144, 104503 CrossRef.
- H. Berendsen and J. Grigera, J. Phys. Chem., 1987, 91, 6269–6271 CrossRef CAS.
- K. N. Kirschner, A. B. Yongye, S. M. Tschampel, J. González-Outeiriño, C. R. Daniels, B. L. Foley and R. J. Woods, J. Comput. Chem., 2008, 29, 622–655 CrossRef CAS PubMed.
- Y. Nishiyama, P. Langan and H. Chanzy, J. Am. Chem. Soc., 2002, 124, 9074–9082 CrossRef CAS PubMed.
- H. C. Andersen, J. Comput. Phys., 1983, 52, 24–34 CrossRef CAS.
- J. P. Ryckaert, G. Ciccotti and H. J. Berendsen, J. Comput. Phys., 1977, 23, 327–341 CrossRef CAS.
- L. Martinez, R. Andrade, E. G. Birgin and J. M. Martinez, J. Comput. Chem., 2009, 30, 2157–2164 CrossRef CAS PubMed.
- A. S. Gross, A. T. Bell and J.-W. Chu, Phys. Chem. Chem. Phys., 2012, 14, 8425–8430 RSC.
- B. D. Rabideau and A. E. Ismail, J. Phys. Chem. B, 2015, 119, 15014–15022 CrossRef CAS PubMed.
- R. W. Hockney and J. W. Eastwood, Computer Simulation Using Particles, CRC Press, 1989 Search PubMed.
- W. G. Hoover, Phys. Rev. A, 1985, 31, 1695–1697 CrossRef PubMed.
- A. Luzar and D. Chandler, J. Chem. Phys., 1993, 98, 8160–8173 CrossRef CAS.
- A. Luzar and D. Chandler, Phys. Rev. Lett., 1996, 76, 928–931 CrossRef CAS PubMed.
- A. Luzar and D. Chandler, Nature, 1996, 379, 55–57 CrossRef CAS.
- A. Luzar, J. Chem. Phys., 2000, 113, 10663–10675 CrossRef CAS.
- A. Chandra, Phys. Rev. Lett., 2000, 85, 768–771 CrossRef CAS PubMed.
- S. Chowdhuri and A. Chandra, Phys. Rev. E, 2002, 66, 041203 CrossRef PubMed.
- S.-T. Lin, M. Blanco and W. A. Goddard, J. Chem. Phys., 2003, 119, 11792–11805 CrossRef CAS.
- S.-T. Lin, P. K. Maiti and I. W. A. Goddard, J. Phys. Chem. B, 2010, 114, 8191–8198 CrossRef CAS PubMed.
- T. Pascal, S. Lin and W. Goddard III, Phys. Chem. Chem. Phys., 2011, 13, 169–181 RSC.
- M. Abe, Y. Fukaya and H. Ohno, Chem. Commun., 2012, 48, 1808–1810 RSC.
- B. D. Rabideau, A. Agarwal and A. E. Ismail, J. Phys. Chem. B, 2013, 117, 3469–3479 CrossRef CAS PubMed.
- B. Mostofian, X. Cheng and J. Smith, J. Phys. Chem. B, 2014, 118, 11037–11049 CrossRef CAS PubMed.
Footnote |
| † Electronic supplementary information (ESI) available: Details of the 2PT method, calculation of statistical measurements, pairwise interaction energy changes, and H-bond changes. Raw data is available upon request. See DOI: 10.1039/c9ra07989k |
| This journal is © The Royal Society of Chemistry 2020 |