 Open Access Article
The effects of deposition time and current density on the electrochemical performance of flexible and high-performance MnO2@PFG composite electrodes
MengYing Jia ,
Chen Cheng,
Linlin Cui
 ,
Yue Li and
Xiao-Juan Jin
 *
*
MOE Key Laboratory of Wooden Material Science and Application, Beijing Key Laboratory of Lignocellulosic Chemistry, MOE Engineering Research Center of Forestry Biomass Materials and Bioenergy, Beijing Forestry University, 35 Qinghua East Road, Haidian, 100083, Beijing, China. E-mail: jxj0322@bjfu.edu.cn; Tel: +8613718160441
First published on 22nd January 2020
Abstract
A novel composite electrode has been fabricated by the direct deposition of MnO2 onto graphene networks surrounding a paper fiber (PFG). The paper fiber between graphene sheets could be used as a flexible substrate for MnO2 nanoparticles, and the microscopic morphologies and electrochemical performances of the MnO2@PFG electrodes were tuned via regulating the deposition current densities and deposition times. 3D graphene on PFG served as a highly conductive backbone with a high surface area for the deposition of the MnO2 nanoparticles, which provided high accessibility to electrolyte ions for shortening the diffusion paths. The MnO2-10-600 s@PFG composite electrode achieved a maximum specific capacitance of 878.6 mF cm−2 with an MnO2 loading mass of 3.62 mg cm−2 (specific capacitance of 187.7 F g−1) at a current density of 0.5 mA cm−2 in a 1 M NaSO4 aqueous solution. Additionally, the MnO2-10-600 s@PFG composite material with the most favorable composite ratio exhibited the highest energy density of 61.01 mW h cm−2, maximum power density of 1249.78 mW cm−2, excellent capacitance retention with no more than 7% capacitance loss after 10![[thin space (1/6-em)]](https://www.rsc.org/images/entities/char_2009.gif) 000 cycles and good mechanical flexibility (about 91.06% of its original capacitance after 500 bending times). By combining the electric double layer capacitance of graphene networks with the pseudocapacitance of the MnO2 nanostructures, the flexible electrode showed much enhanced electrochemical capacitance behaviors with robust tolerance to mechanical deformation; thus, it is promising for being woven into textiles for wearable electronics.
000 cycles and good mechanical flexibility (about 91.06% of its original capacitance after 500 bending times). By combining the electric double layer capacitance of graphene networks with the pseudocapacitance of the MnO2 nanostructures, the flexible electrode showed much enhanced electrochemical capacitance behaviors with robust tolerance to mechanical deformation; thus, it is promising for being woven into textiles for wearable electronics.
1. Introduction
Supercapacitors, also known as ultracapacitors, are charge storage devices differing from traditional electrostatic capacitors and rechargeable batteries;1 thus, they have attracted increasing attention because of their fast charging/discharging rate, high power density and excellent cycle stability.2–4 Such outstanding properties enable them to bridge the gap between batteries and conventional capacitors for high energy density and power density storage in future.3,5 Supercapacitors can be usually divided into two classes according to the charge storage mechanism: electrochemical double-layer capacitors (EDLCs) and pseudocapacitors. EDLCs, which store energy via the separation of reversible electronic and ionic charges between the electrode and electrolyte interface,6 are commonly composed of carbon-based active electrodes with high surface areas,7 where carbonaceous electrode materials including active carbon, carbon nanotubes, carbon nanofibers, fullerenes, carbon aerogels and xerogels, and graphene with high specific surface areas are widely used for EDLCs.8 Among them, graphene, a two-dimensional (2D) material composed of sp2-bonded carbon atoms, has attracted increasing attention in recent years due to its extraordinarily high electrical and thermal conductivities,9,10 high specific surface area,11,12 excellent capacitance,13,14 great mechanical strength,15 and relatively low manufacturing cost.16 Therefore, graphene has become a promising candidate in fabricating various hybrids for supercapacitors. However, graphene derived from graphene oxide (GO) easily agglomerates, which leads to decreased performance as well as loss of intrinsic capacitance.17 Therefore, we need to add other materials to increase its specific capacitance.Compared to EDLCs, pseudocapacitors can store considerable charges via fast and reversible surface/subsurface faradaic reactions.18 The specific capacitance of pseudocapacitors is 10–100 times higher than that of EDLCs.19 Among different types of pseudocapacitor electrodes, transition metal-based compounds including oxides,20 phosphides21,22 and nitrides23 are always receiving specific attention due to their abundance in nature and high theoretical capacitance.24,25 Transition metal oxides such as RuO2, NiO, CoOx,26 NiP,22,27 and TiN28 are often used as electrode materials for fast and reversible redox reactions near the surface of active materials. In particular, the use of RuO2, one of the most promising pseudocapacitor materials, is limited due to its high cost.29 Therefore, manganese dioxide (MnO2), with its high specific capacitance, low cost and environmental compatibility, has attracted much attention as a pseudocapacitor electrode material.30–32 Indeed, there are several studies on the exploration of graphene/MnO2-based composite materials for supercapacitors; however, there are very few reports about the control of MnO2 electrodeposition time and current density.
Herein, a flexible and binder-free ternary MnO2@PFG composite electrode was successfully synthesized via facile vacuum filtration and electro-deposition processes. We aim to fabricate a novel hybrid electrode by the direct deposition of MnO2 onto a graphene network surrounding a paper fiber. The structure was formed by the formation of encapsulated graphene on a paper fiber first, followed by the deposition of MnO2 nanoparticles. In this study, we show that the electrochemical properties of the MnO2@PFG composite electrodes are seriously affected by the deposition time and deposition current density. Meanwhile, the electrochemical performances and mechanical properties of the composite electrode with the best proportion were systematically studied.
2. Experimental section
2.1 Materials
Bleached sulphate wood pulp poplar was provided by Shandong HuaTai Company. Graphene oxide was prepared from natural flake graphite as a starting material by a modified Hummers' method. The main reagents including hydrazine hydrate, N,N-dimethylformamide (DMF), Mn(CH3COOH)2, NaSO4 and other chemicals of analytical grade were purchased from Beijing Lanyi Chemical Reagent. Distilled water was utilized throughout the experiments.2.2 Synthesis
![[thin space (1/6-em)]](https://www.rsc.org/images/entities/char_2009.gif) :
:![[thin space (1/6-em)]](https://www.rsc.org/images/entities/char_2009.gif) 9, which was beneficial to improve the dispersion of GO. Then, the samples were sealed using an anticorrosion membrane and subjected to ultrasonic oscillation for 2 h. Subsequently, a small amount of hydrazine hydrate (80%) was added to the homogeneous dispersion, and the weight ratio of hydrazine hydrate to GO was about 7
9, which was beneficial to improve the dispersion of GO. Then, the samples were sealed using an anticorrosion membrane and subjected to ultrasonic oscillation for 2 h. Subsequently, a small amount of hydrazine hydrate (80%) was added to the homogeneous dispersion, and the weight ratio of hydrazine hydrate to GO was about 7![[thin space (1/6-em)]](https://www.rsc.org/images/entities/char_2009.gif) :
:![[thin space (1/6-em)]](https://www.rsc.org/images/entities/char_2009.gif) 10. After stirring for 5 minutes, the beaker was put in a water bath (∼95 °C) for 3 h. Finally, the mixture solution was vacuum-filtrated using an organic microporous membrane (50 mm in diameter, 0.45 μm in pore size) at constant pressure.
10. After stirring for 5 minutes, the beaker was put in a water bath (∼95 °C) for 3 h. Finally, the mixture solution was vacuum-filtrated using an organic microporous membrane (50 mm in diameter, 0.45 μm in pore size) at constant pressure.2.3 Characterization techniques
Scanning electron micrographs were recorded using a Field-Emission Scanning Electron Microscope (Ultra 55). X-ray diffraction (XRD) was performed to analyze the crystal structure of the composites using a Bruker D8 diffractometer with Cu Kα radiation. Raman spectra were measured using a LabRAM HR Evolution system equipped with an Ar 532 nm laser. X-ray photoelectron spectroscopy (XPS) data were obtained using an ESCALab220i-XL electron spectrometer from VG Scientific with 300 W Al Kα radiation. The base pressure was about 3 × 10⁻⁹ mbar. The binding energies were referenced to the C 1s line at 284.8 eV from adventitious carbon. All electrochemical characteristics were evaluated by cyclic voltammetry (CV) and galvanostatic charge/discharge (GCD) and electrochemical impedance spectroscopy (EIS) measurements using a CHI 660D electrochemical workstation (CH instruments). CV was performed in a voltage window between 0 and 1.0 V at different scan rates in the range from 5 to 100 V s−1. The GCD experiments were carried out in a voltage window between 0 and 1.0 V at different current densities from 0.5 to 5 mA cm−2. EIS was performed in the frequency range from 100 kHz to 10 mHz at open circuit voltage by applying a 5 mV signal. The three-electrode electrochemical cell consisted of a saturated calomel electrode (SCE) as the reference electrode, a platinum plate (1.0 × 1.0 cm2) as the counter electrode and the prepared electrode (active area: 1.0 × 1.0 cm2) as the working electrode. An aqueous solution of deoxygenated 1.0 M Na2SO4 was used as the electrolyte for electrochemical experiments. Moreover, all measurements were carried out at room temperature.3. Results and discussion
The MnO2@PFG composite electrodes were prepared in two steps (Fig. 1a): first, paper fibers were bonded together with graphene sheets via self-assembly by a facile vacuum filtration process. The abundant functional groups on the paper fibers that were used as flexible substrates could provide strong interactive sites to bind graphene. Graphene wrapped outside the fiber provided a highly conductive backbone with a high surface area of MnO2 nanoparticles, which provided high accessibility to electrolyte ions for shortening the diffusion paths. Second, the resulting PFG composite electrode was used as the working electrode and MnO2 nanostructures were electrodeposited on the surface of the PFG composite electrode. The formation mechanism can be summarized briefly. The PFG composite electrodes were immersed into a plating solution containing Mn(CH3COO)2 and Na2SO4. In the electro-deposition process, the charged ions in the electrolyte were directed diffusion under an applied electric field, low-valence metal ions were discharged near the anode and high-valence ions were formed, leading to the oxidation of Mn(II) to Mn(IV). The redox reaction that occurred on the electrode surface is as follows:34| Mn2+ + 2H2O→MnO2+ + 4H+ + 2e− |
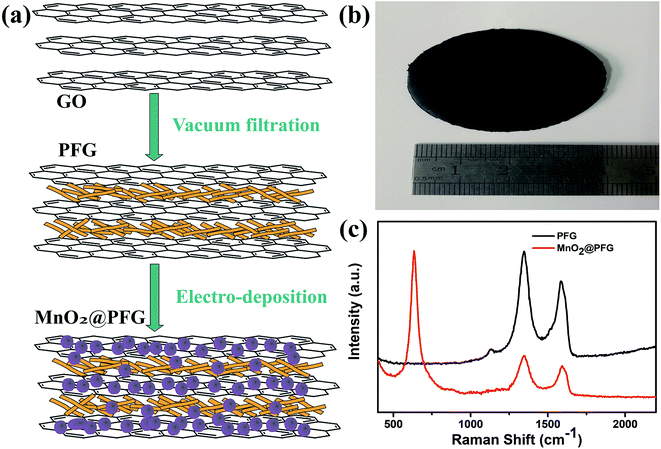 | ||
| Fig. 1 (a) Schematic of the preparation process of MnO2@PFG composite electrodes. (b) Photograph of the as-prepared PFG electrode. (c) Raman spectra of PFG and MnO2@PFG. | ||
Fig. 1b shows the digital photograph of the MnO2@PFG composite electrode. The film possessed a diameter of 4 cm with a smooth surface. The Raman spectrum was probed, as shown in Fig. 1c. The PFG electrode exhibited two obvious peaks around 1320 cm−1 and 1580 cm−1, corresponding to the D band and G band of carbon-based materials. After the deposition of MnO2 on the PFG electrode for 600 s, a sharp peak around 635 cm−1 appeared, which could be assigned to the (O–Mn) stretching vibration of divalent Mn ions, and the broad peak might be ascribed to the overlap of various characteristic peaks of MnO2, Mn3O4 and MnOOH.3,35 Moreover, the ID/IG ratio of the PFG electrode increased to 1.06 from 1.02 after the electro-deposition of MnO2, indicating that the deposition of MnO2 on the PFG electrode resulted in a slight increase in the defect ratio. This suggests that by depositing trace amounts of MnO2, the number of positively charged metal ions and oxygen heteroatoms can be increased, which would cause an increase in the disorder.
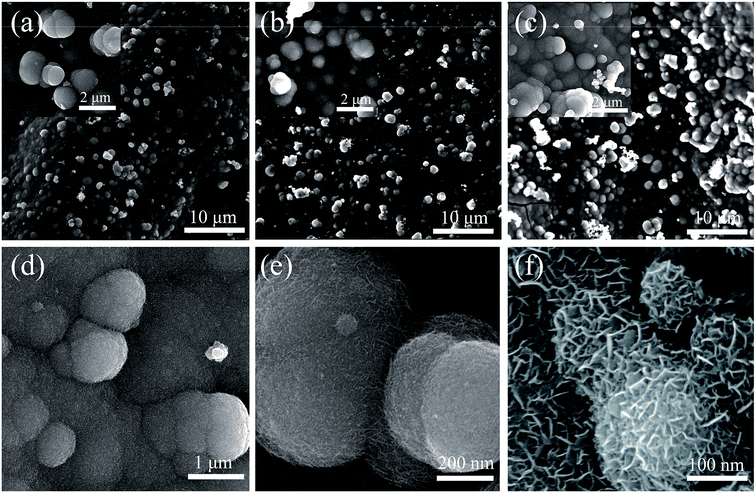
Fig. 2a–c show the growth of MnO2 microspheres on the PFG composite electrode in the electro-deposition process at different reaction times of 600 s, 900 s, and 1200 s. As shown in Fig. 2a, small MnO2 nanoparticles are deposited on the electrode surface when the reaction time is 600 s. However, the quantity of the MnO2 nanoparticles is relatively small. By further increasing the reaction time from 600 s to 900 s, the morphology and structure of the MnO2@PFG composite electrode significantly changed. A dense MnO2 nanoparticle layer was formed on the PFG composite electrode, and a large quantity of MnO2 microspheres were gradually formed and observed on the surface. The uniform structure of the PFG composite electrode with strong adhesion and good mechanical property could provide strong interactive sites, therefore leading to the extensive coverage of MnO2 nanoparticles. The electric potential continued to increase with the further increase in the reaction time at a current density of 10 mA cm−2. The longer deposition time might be conducive to nucleation and negatively crystal growth. When the deposition time reached 1200 s (Fig. 2c), more MnO2 microspheres were generated and stacked together, and the accumulation of the MnO2 nanoparticle layers might have caused the electrode to become too dense, which decreased the specific surface area and was not conducive to ion transport. Moreover, the high-magnification FESEM images of MnO2-10-600 s@PFG are displayed in Fig. 2d–f. The formed MnO2 microspheres have a diameter of 200–300 nm. Obviously, the formation of the MnO2 microspheres dramatically increased the specific surface area of active materials, which was beneficial for the infiltration and transmission of the electrolyte. Besides, the MnO2 microspheres could be easily controlled by simply adjusting the electro-deposition reaction times.
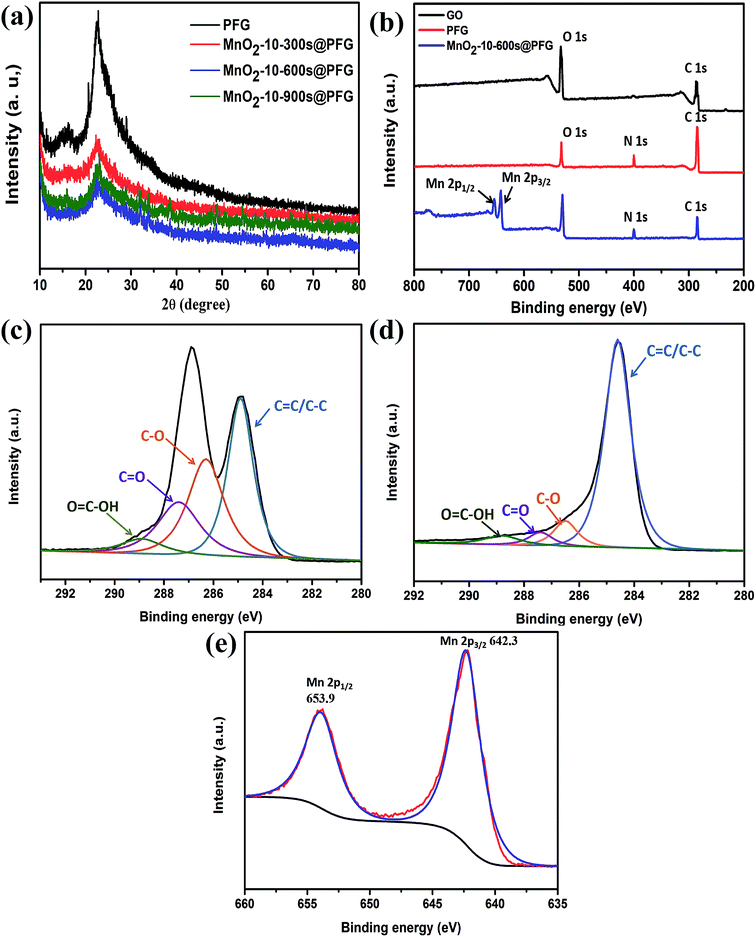
The XRD patterns of the PFG and MnO2@PFG electrodes are shown in Fig. 3a. Two diffraction peaks (2θ) were observed at around 22° and 43° for the PFG electrode, corresponding to the (002) and (101) crystal planes, which are the characteristic peaks of carbon-based materials.36,37 With the increase in MnO2 deposition, the intensity of carbon-based characteristic peaks, especially for the MnO2-10-600 s@PFG electrode, decreased accordingly. One sharp peak appeared at around 37° for the MnO2-10-600 s@PFG composite electrode, which could be indexed to birnessite-type MnO2.38,39
The detailed compositional analysis of GO, PFG and MnO2@PFG was further conducted via XPS, and the corresponding results are presented in Fig. 3b. As shown in the figure, the peak of the O element decreases significantly after chemical reduction. Compared with the XPS spectrum of GO, a small peak (N 1s) appeared in the XPS spectrum of PFG, which was mainly due to the introduction of the N element in the process of hydrazine hydrate reduction. Moreover, the calculated values of the N element increased from 0.59% to 4.76%, which was beneficial for capacitance improvement. Compared with the XPS spectrum of PFG, the spectrum of MnO2@PFG presents four elements, namely, C, O, N and Mn, while the signal of manganese (Mn 2p) emerges in the XPS survey spectrum of MnO2@PFG, illustrating the attachment of MnO2 onto the surface of thermally reduced graphene sheets. Moreover, the C 1s deconvolution spectra of GO and PFG were analyzed by curve fitting. For GO, the spectrum reveals the presence of four components of the carbon bond (Fig. 3c), namely, C![[double bond, length as m-dash]](https://www.rsc.org/images/entities/char_e001.gif) C/C–C (284.9 eV), C–O (286.5 eV), C
C/C–C (284.9 eV), C–O (286.5 eV), C![[double bond, length as m-dash]](https://www.rsc.org/images/entities/char_e001.gif) O (287.4 eV) and O
O (287.4 eV) and O![[double bond, length as m-dash]](https://www.rsc.org/images/entities/char_e001.gif) C–OH (288.8 eV), which are in good agreement with the literature values. Compared with the C 1s spectrum of GO, the C 1s spectrum of PFG indicates that the intensity of the peak associated with C
C–OH (288.8 eV), which are in good agreement with the literature values. Compared with the C 1s spectrum of GO, the C 1s spectrum of PFG indicates that the intensity of the peak associated with C![[double bond, length as m-dash]](https://www.rsc.org/images/entities/char_e001.gif) C/C–C (284.7 eV) becomes predominant, while the intensities of C–O, C
C/C–C (284.7 eV) becomes predominant, while the intensities of C–O, C![[double bond, length as m-dash]](https://www.rsc.org/images/entities/char_e001.gif) O and O
O and O![[double bond, length as m-dash]](https://www.rsc.org/images/entities/char_e001.gif) C–OH decrease dramatically, demonstrating that most of the oxygen-containing functional groups have been successfully removed by the heat treatment (Fig. 3d). Fig. 3e gives the Mn 2p spectrum of MnO2@PFG, in which the peaks of Mn 2p3/2 and Mn 2p1/2 are located at 641.9 and 653.6 eV, respectively, with an energy separation of 11.7 eV, agreeing with the reported data of Mn 2p3/2 and Mn 2p1/2 in MnO2.40,41
C–OH decrease dramatically, demonstrating that most of the oxygen-containing functional groups have been successfully removed by the heat treatment (Fig. 3d). Fig. 3e gives the Mn 2p spectrum of MnO2@PFG, in which the peaks of Mn 2p3/2 and Mn 2p1/2 are located at 641.9 and 653.6 eV, respectively, with an energy separation of 11.7 eV, agreeing with the reported data of Mn 2p3/2 and Mn 2p1/2 in MnO2.40,41
3.1 Electrochemical measurement
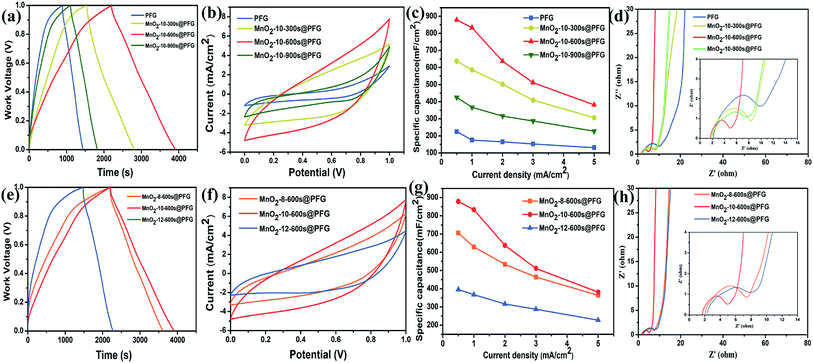
The electrochemical performance of MnO2@PFG as an electrode material was estimated at different disposition times at a deposition current density of 10 mA cm−2. The galvanostatic charge–discharge analysis results of various electrodes are shown in Fig. 4a. All samples have triangular characteristics, indicating relatively ideal capacitor behavior in an acidic aqueous electrolyte. As we can see, the MnO2-10-600 s@PFG electrode has the longest charge/discharge period, indicating the highest capacitance. However, the pristine PFG electrode exhibited an inferior supercapacitor performance at an applied current density of 0.5 mA cm−2 because of significant internal resistance. As shown in Fig. 4b, the MnO2@PFG electrodes obtained at different deposition times exhibit CV curves of nearly rectangular shapes, showing a relatively good capacitive behavior at a measured scan rate of 10 mV s−1. The conductive PFG combined with surface-exposed MnO2 is accessible for fast ion transportation. On the other hand, with the increase in the deposition time of MnO2, the MnO2@PFG electrode showed a larger current response, indicating the controllable capacitive behavior of MnO2@PFG. The Fig. 4b showed the influence of the deposition amount of MnO2 on CV curves and the MnO2-10-600 s@PFG electrode materials is greater than MnO2-10-300 s@PFG and MnO2-10-900 s@PFG, respectively, which is consistent with the GCD data. This confirms that different deposition times affect the morphology of electrode materials and further influence their electrochemical performance. The detailed values of areal specific capacitance (Cs) are calculated from the GCD curves. As shown in Fig. 4c, the areal specific capacitance (Cs = IΔt/(SΔV)) values calculated from the GCD curves of PFG, MnO2-10-300 s@PFG, MnO2-10-600 s@PFG and MnO2-10-900 s@PFG are 225, 637.5, 878.6 and 425.5 mF cm−2, respectively, at a current density of 0.5 mA cm−2. As expected, the deposition of MnO2 on the PFG composite electrode induced 3–4-fold increase in specific capacitance compared with MnO2@PFG EDLC due to the pseudocapacitance brought by the MnO2 nanoparticles. The results of electrochemical impedance spectroscopy (EIS) are shown in Fig. 4d; the nearly vertical lines of all samples indicate a pure capacitive behavior and low diffusion resistance of ions in the structure of the electrode materials at low frequencies. The resistance values of PFG, MnO2-10-300 s@PFG, MnO2-10-600 s@PFG and MnO2-10-900 s@PFG were estimated to be 9.87, 7.64, 4.95 and 8.29 Ω, respectively. The MnO2-10-900 s@PFG electrode presented higher resistance than MnO2-10-600 s@PFG as long deposition times caused the agglomeration of MnO2. The accumulation of the MnO2 nanoparticle layers might cause the film to become too dense, which decreased the specific area and was not conducive to ion transport. These results obtained via electrochemical impedance spectroscopy are consistent with the above-mentioned findings. Therefore, the optimal deposition time is 600 s. The result from Table 1 shows that with the increase in the electro-deposition time, the quality of MnO2 gradually increases. When the electro-deposition time reached 600 s, the quality of MnO2 accounted for 23.48% of the composite electrode.| Deposition time (s) | 0 s | 300 s | 600 s | 900 s |
|---|---|---|---|---|
| Before the electro-deposition (mg) | 2.85 | 2.83 | 2.77 | 2.79 |
| After the electro-deposition (mg) | 2.85 | 3.27 | 3.62 | 4.23 |
| Changes (mg) | 0 | 0.44 | 0.85 | 1.44 |
| MnO2 (%) | 0 | 13.45 | 23.48 | 34.04 |
In order to explore the best electro-deposition conditions, different deposition current densities were further evaluated at the deposition time of 600 s. Fig. 4e shows the GCD curves of all samples with a work voltage of 0–1.0 V at a current density of 0.5 mA cm−2. It can be clearly seen that the MnO2-10-600 s@PFG electrode exhibits the largest charging/discharging time span, suggesting large specific capacitance. It can also be seen in Fig. 4f that the CV curves of all samples with a potential of 0–1.0 V at the same scan rate of 10 mV cm−1 show a nearly rectangular shape, and the MnO2-10-600 s@PFG electrode has the largest enclosed area. Furthermore, the areal specific capacitance (Cs) is shown in Fig. 4g. It can be found that the areal specific capacitances of the MnO2-10-600 s@PFG electrode are 878.6, 833.2, 637, 511.5 and 318.3 mA cm−2 at the current densities of 0.5, 1, 2, 3 and 5 mA cm−2, respectively. These excellent electrochemical performances can be probably attributed to both the 3D porous PFG flexible substrate and electro-deposition of MnO2. Fig. 4h depicts that the Nyquist plot starts from the Z′-axis and progresses almost vertically to the Z′′-axis at low frequencies, indicating the ideal capacitive characteristics of all electrodes. Moreover, MnO2-10-600 s@PFG is the closest to the Z′′-axis, further demonstrating that MnO2-10-600 s@PFG has the best capacitive property. The measured impedance spectra were analyzed according to the semicircle intercepts of the Z′-axis (the inset in Fig. 4h). The resistance values of the MnO2-8-600 s@PFG, MnO2-10-600 s@PFG and MnO2-12-600 s@PFG electrode materials are 7.46 Ω, 4.95 Ω and 8.57 Ω, respectively. The MnO2-10-600 s@PFG electrode material has large resistance, which is mainly because high deposition current density is not conducive to longitudinal growth of MnO2 and is easy to case a dense layer on the PFG electrode. Therefore, the selected deposition current density is 10 mA cm−2.
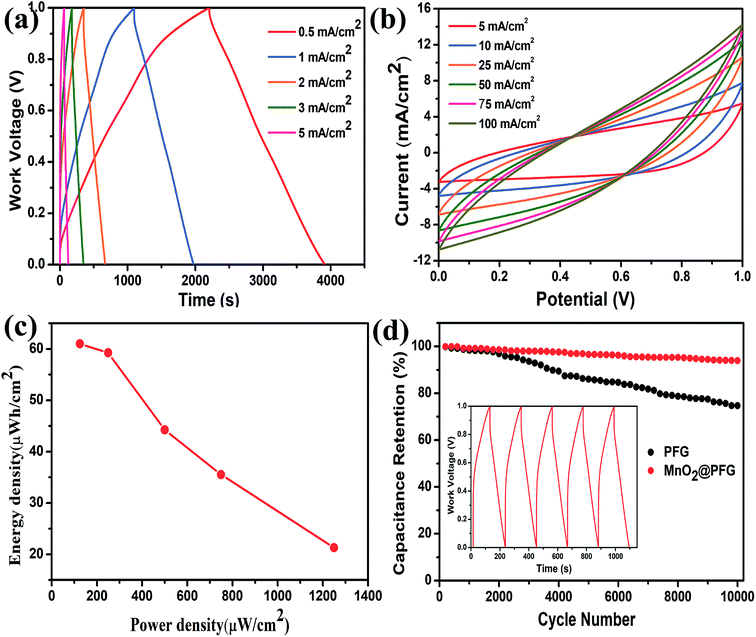
Moreover, Fig. 5a shows the GCD curves of the MnO2-10-600 s@PFG electrodes at different current densities of 0.5–5 mA cm−2. All GCD curves exhibit nearly triangular shapes, with a longer discharge time, indicating that the MnO2-10-600 s@PFG electrode has large specific capacitance and high charge/discharge efficiency. In addition, the CV curves of the MnO2-10-600 s@PFG electrodes at various scan rates of 5, 10, 25, 50, 75 and 100 mV s−1 demonstrate a good and stable capacitive behavior under an operating potential of 0–1.0 V (Fig. 5b). Ragone plots, depicting the relationship between power densities (P) and energy densities (E), are further used to evaluate the performance of the as-assembled device (Fig. 5c). It is worth noting that the device can possess a maximum energy density of 61.01 mW h cm−2 at 0.5 mA cm−2 and a maximum power density of 1249.78 mW cm−2 at 5 mA cm−2. Furthermore, a long cycle life is critical to the practical application of supercapacitors. As shown in Fig. 5d, the PFG and MnO2@PFG electrodes have been evaluated at a current density of 5 mA cm−2. Compared with the PFG electrode (73.65% capacitance retention over 10![[thin space (1/6-em)]](https://www.rsc.org/images/entities/char_2009.gif) 000 cycles), the MnO2@PFG electrode showed excellent electrochemical stability with about 93.85% capacitance retention after 10
000 cycles), the MnO2@PFG electrode showed excellent electrochemical stability with about 93.85% capacitance retention after 10![[thin space (1/6-em)]](https://www.rsc.org/images/entities/char_2009.gif) 000 charge/discharge cycles, further identifying the strong interaction between graphene sheets and MnO2 molecules.
000 charge/discharge cycles, further identifying the strong interaction between graphene sheets and MnO2 molecules.
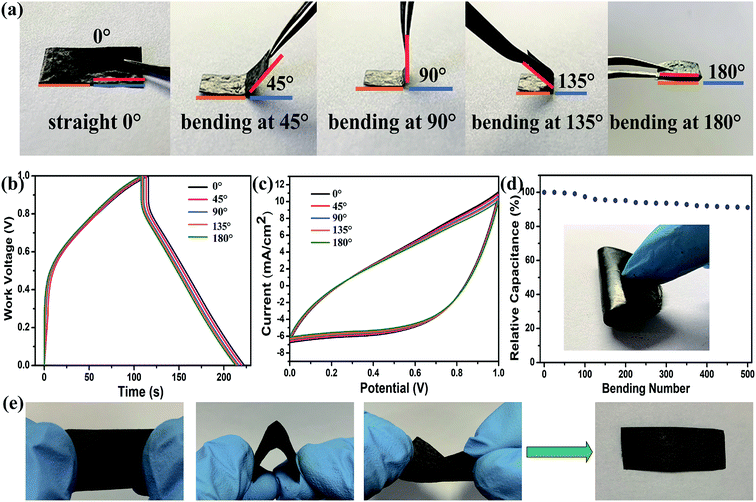
Except the good electrochemical and cyclic properties of our self-standing electrodes, the electrochemical change along with different degrees of bending was measured and presented in Fig. 6 to evaluate their flexibility for assembling flexible energy storage devices. The GCD and CV results of a film bent to different angles of 0°, 45°, 90°, 135° and 180° (in Fig. 6a, the corresponding schematic optical images are shown) are exhibited in Fig. 6b and c, respectively. The charge and discharge curves at 5 mA cm−2 in the GCD curves and CV curves at 10 mV s−1 nearly overlapped when the bending angles of the flexible electrode varied from 0° to 180°. Almost no performance fading could be found here. There was only about 3.5% fading in capacitance when bent to 180°, as seen from the calculated specific capacitances on the basis of the GCD and CV curves at different bending angles, indicating good flexibility of our electrodes. To better clarify the mechanical flexibility of the flexible electrode, the relative capacitance of the MnO2-10-600 s@PFG electrode after 500 bending cycles is shown in Fig. 6d. The fatigue test revealed that the specific capacitance of the flexible electrode was maintained at 91.06% of the original value after 500 stretching–bending cycles. The images in Fig. 6e indicate that the MnO2-10-600 s@PFG electrode can be stretched, bent and even distorted freely without permanent deformation or damage.
4. Conclusions
In summary, we have demonstrated a facile vacuum filtration and electro-deposition method to synthesize MnO2@PFG composite electrodes. In this structure, the paper fiber with a sheath of 3D graphene networks is coated with MnO2 nanoparticles. 3D graphene on paper fibers serves as a highly conductive backbone with a high surface area for the deposition of nanostructured MnO2, which provides high accessibility to electrolyte ions for shortening the diffusion paths. This suggests that the MnO2-10-600 s@PFG composite electrodes have a maximum specific capacitance of 878.6 mF cm−2 with an MnO2 loading mass of 3.62 mg cm−2 (specific capacitance of 187.7 F g−1) at a current density of 0.5 mA cm−2 in a 1 M NaSO4 aqueous solution. Moreover, the MnO2-10-600 s@PFG composite material with the most favorable composite ratio exhibits the highest energy density of 61.01 mW h cm−2, maximum power density of 1249.78 mW cm−2, excellent capacitance retention with no more than 7% capacitance loss after 10![[thin space (1/6-em)]](https://www.rsc.org/images/entities/char_2009.gif) 000 cycles and good mechanical flexibility (about 91.06% of its original capacitance after 500 bending times). Therefore, we can determine that the flexible MnO2-10-600 s@PFG electrode with good mechanical flexibility and superior electrochemical performance is a promising candidate for the preparation of flexible, environmentally friendly and low-price wearable electronics.
000 cycles and good mechanical flexibility (about 91.06% of its original capacitance after 500 bending times). Therefore, we can determine that the flexible MnO2-10-600 s@PFG electrode with good mechanical flexibility and superior electrochemical performance is a promising candidate for the preparation of flexible, environmentally friendly and low-price wearable electronics.
Conflicts of interest
The authors declare that they have no conflict of interest.References
- K.-S. Kim and S.-J. Park, J. Solid State Electrochem., 2012, 16, 2751–2758 CrossRef CAS.
- P. J. Hall, M. Mirzaeian, S. I. Fletcher, F. B. Sillars, A. J. R. Rennie, G. O. Shitta-Bey, G. Wilson, A. Cruden and R. Carter, Energy Environ. Sci., 2010, 3, 1238–1251 RSC.
- P. Simon and Y. Gogotsi, Nat. Mater., 2008, 7, 845–854 CrossRef CAS PubMed.
- R. Kötz and M. Carlen, Electrochim. Acta, 2000, 45, 2483–2498 CrossRef.
- J. R. Miller and P. Simon, Science, 2008, 321, 651–652 CrossRef CAS PubMed.
- M. Jin, G. Han, Y. Chang, H. Zhao and H. Zhang, Electrochim. Acta, 2011, 56, 9838–9845 CrossRef CAS.
- L. L. Zhang and X. S. Zhao, Chem. Soc. Rev., 2009, 38, 2520–2531 RSC.
- S. L. Candelaria, Y. Shao, W. Zhou, X. Li, J. Xiao, J.-G. Zhang, Y. Wang, J. Liu, J. Li and G. Cao, Nano Energy, 2012, 1, 195–220 CrossRef CAS.
- F. Schedin, A. K. Geim, S. V. Morozov, E. W. Hill, P. Blake, M. I. Katsnelson and K. S. Novoselov, Nat. Mater., 2007, 6, 652–655 CrossRef CAS PubMed.
- A. A. Balandin, S. Ghosh, W. Bao, I. Calizo, D. Teweldebrhan, F. Miao and C. N. Lau, Nano Lett., 2008, 8, 902–907 CrossRef CAS PubMed.
- D. A. C. Brownson, D. K. Kampouris and C. E. Banks, J. Power Sources, 2011, 196, 4873–4885 CrossRef CAS.
- D. A. Brownson and C. E. Banks, Analyst, 2010, 135, 2768–2778 RSC.
- D. R. Dreyer, S. Park, C. W. Bielawski and R. S. Ruoff, Chem. Soc. Rev., 2010, 39, 228–240 RSC.
- M. Pumera, Chem. Rec., 2009, 9, 211–223 CrossRef CAS PubMed.
- C. Lee, X. Wei, J. W. Kysar and J. Hone, Science, 2008, 321, 385–388 CrossRef CAS PubMed.
- S. Park and R. S. Ruoff, Nat. Nanotechnol., 2009, 4, 217–224 CrossRef CAS PubMed.
- K. Zhang, L. L. Zhang, X. S. Zhao and J. Wu, Chem. Mater., 2010, 22, 1392–1401 CrossRef CAS.
- W. Deng, X. Ji, Q. Chen and C. E. Banks, RSC Adv., 2011, 1 CAS.
- I. Shown, A. Ganguly, L.-C. Chen and K.-H. Chen, Energy Sci. Eng., 2015, 3, 2–26 CrossRef CAS.
- M. Huang, F. Li, F. Dong, Y. X. Zhang and L. L. Zhang, J. Mater. Chem. A, 2015, 3, 21380–21423 RSC.
- K. Zhou, W. J. Zhou, L. J. Yang, J. Lu, S. Cheng, W. J. Mai, Z. H. Tang, L. G. Li and S. W. Chen, Adv. Funct. Mater., 2015, 25, 7530–7538 CrossRef.
- W. Du, R. Kang, P. Geng, X. Xiong, D. Li, Q. Tian and H. Pang, Mater. Chem. Phys., 2015, 165, 207–214 CrossRef CAS.
- Y.-J. B. Ting, H. Wu, N. P. Kherani and K. Lian, Mater. Chem. Phys., 2015, 154, 118–124 CrossRef CAS.
- L. Li, Z. A. Hu, N. An, Y. Y. Yang, Z. M. Li and H. Y. Wu, J. Phys. Chem. C, 2014, 118, 22865–22872 CrossRef CAS.
- M.-J. Deng, P.-J. Ho, C.-Z. Song, S.-A. Chen, J.-F. Lee, J.-M. Chen and K.-T. Lu, Energy Environ. Sci., 2013, 6, 2178 RSC.
- J. Chen, X.-h. Xia, J.-p. Tu, Q.-q. Xiong, Y.-X. Yu, X.-l. Wang and C.-d. Gu, J. Mater. Chem., 2012, 22, 15056 RSC.
- W. Du, S. Wei, K. Zhou, J. Guo, H. Pang and X. Qian, Mater. Res. Bull., 2015, 61, 333–339 CrossRef CAS.
- A. Achour, R. L. Porto, M.-A. Soussou, M. Islam, M. Boujtita, K. A. Aissa, L. Le Brizoual, A. Djouadi and T. Brousse, J. Power Sources, 2015, 300, 525–532 CrossRef CAS.
- A. K. Mishra and S. Ramaprabhu, J. Phys. Chem. C, 2011, 115, 14006–14013 CrossRef CAS.
- M. S. Song, K. M. Lee, Y. R. Lee, I. Y. Kim, T. W. Kim, J. L. Gunjakar and S. J. Hwang, J. Phys. Chem. C, 2010, 114, 22134–22140 CrossRef CAS.
- A. Vinu, V. Murugesan, W. Böhlmann and M. Hartmann, J. Phys. Chem. B, 2004, 108, 11496–11505 CrossRef CAS.
- M. Mastragostino, C. Arbizzani and F. Soavi, J. Power Sources, 2001, 97–98, 812–815 CrossRef CAS.
- M. Y. Jia, L. S. Xu, Y. Li, C. L. Yao and X. J. Jin, New J. Chem., 2018, 42, 14576–14585 RSC.
- L. Xu, M. Jia, Y. Li, X. Jin and F. Zhang, Sci. Rep., 2017, 7, 12857 CrossRef PubMed.
- S.-B. Ma, K.-Y. Ahn, E.-S. Lee, K.-H. Oh and K.-B. Kim, Carbon, 2007, 45, 375–382 CrossRef CAS.
- N. Iwashita, C. R. Park, H. Fujimoto, M. Shiraishi and M. Inagaki, Carbon, 2004, 42, 701–714 CrossRef CAS.
- S.-L. Chou, J.-Z. Wang, S.-Y. Chew, H.-K. Liu and S.-X. Dou, Electrochem. Commun., 2008, 10, 1724–1727 CrossRef CAS.
- X. Jin, W. Zhou, S. Zhang and G. Z. Chen, Small, 2007, 3, 1513–1517 CrossRef CAS PubMed.
- J. Zhang, X. Zhao, Z. Huang, T. Xu and Q. Zhang, Carbon, 2016, 107, 844–851 CrossRef CAS.
- J. Yan, Z. Fan, T. Wei, J. Cheng, B. Shao, K. Wang, L. Song and M. Zhang, J. Power Sources, 2009, 194, 1202–1207 CrossRef CAS.
- G. Zhu, Z. He, J. Chen, J. Zhao, X. Feng, Y. Ma, Q. Fan, L. Wang and W. Huang, Nanoscale, 2014, 6, 1079–1085 RSC.
| This journal is © The Royal Society of Chemistry 2020 |

