 Open Access Article
High-throughput liquid chromatography mass-spectrometry-driven lipidomics discover metabolic biomarkers and pathways as promising targets to reveal the therapeutic effects of the Shenqi pill†
Wen-xiu Li‡
,
Ai-hua Zhang‡,
Xiao-hang Zhou,
Yang Nan,
Qi Liu,
Hui Sun,
Heng Fang and
Xi-jun Wang *
*
Engineering Research Center of Efficacy Evaluation and Industrial Development of TCM Classic Formulae of the Ministry of Education, National Chinmedomics Research Center, Sino-America Chinmedomics Technology Collaboration Center, National TCM Key Laboratory of Serum Pharmacochemistry, Metabolomics Laboratory, Department of Pharmaceutical Analysis, Heilongjiang University of Chinese Medicine, Heping Road 24, Harbin 150040, China. E-mail: xijunwangls@126.com; Fax: +86-451-82110818; Tel: +86-451-82110818
First published on 13th January 2020
Abstract
Lipidomics, a branch of metabonomics, could provide a powerful technique for discovery of lipid molecules to reveal disease status and drug efficacy. The Shenqi pill (SQP) is a representative prescription for clinical application in the prevention and treatment of kidney-yang deficiency syndrome (KYDS). However, its effect mechanism is still not clear. This article aims to reveal the intervention effect of SQP on KYDS from the perspective of lipid metabolism. In this study, SQP was used to intervene in the rat model of KYDS, on the foundation of successfully replicating the rat model of KYDS induced by corticosterone. The MetaboAnalyst tool was used for analysis of the serum metabolic profile and pattern recognition of KYDS model, based on UPLC-SYNAPT-G2-Si-HDMS. Finally, twenty-two potential lipid biomarkers related to the KYDS model were characterized, and the effects of SQP on regulating potential lipid markers in serum of KYDS model were analyzed. There were 10 biomarkers and seven metabolic pathways closely related to SQP therapy for KYDS were found. The action mechanism and targets of SQP in treating KYDS were explored based on high-throughput lipidomics. This work could provide valuable data and scientific evidence in subsequent studies for the treatment of KYDS.
1. Introduction
Kidney-yang deficiency syndrome (KYDS) is a kind of basic syndrome which often leads to extensive pathophysiological change in the body. Modern research has shown that KYDS can cause various degrees of disorders in the hypothalamus–pituitary-target gland axis,1,2 and it is tightly associated with energy metabolism, the neuroendocrine-immune system, the heart and kidneys, which is a comprehensive manifestation of multi-system and organ functions.3–5 As the glucocorticoid model can better simulate the basic symptoms of KYDS patients, it is the most pervasive method of establishing an animal model of KYDS, which can inhibit the secretion function of the hypothalamus–pituitary-target gland. Once the intake of exogenous corticosteroid is stopped, the inhibition state of the hypothalamus–pituitary-target gland function will be exposed and cannot be restored in a short time.6–8Lipidomics is one of the important branches of metabonomics, which provides a useful technique for development and change of lipid molecules to revealdisease status.9 Lipid metabolites play diverse and important roles in the structure and function of cells and tissues.10,11 As the technology of mass spectrometry (MS) is continuing to thrive, the powerful analysis capability of MS has accelerated the development of this new scientific discipline.12–14 This high-throughput method and process enable us to obtain the metabolism information by means of quantifying changes in individual lipid species that reflect metabolic differences, even provides favorable conditions for the diagnosis of diseases.15,16 Studies have shown that more and more diseases are associated with lipid metabolism disorders, such as hypertension,17 kidney diseases,18 diabetes,19,20 hepatopathy,21 and other diseases.
Based on the previous metabonomic study of effect and regulation of SQP on KYDS,22 for further exploration of mechanism of lipid metabolic regulation, this experiment used the UPLC-HDMS to collect the information about lipid metabolites of blood, combined with pattern recognition analysis method,23 to reveal the possible pathogenesis of KYDS from the perspective of lipidomics, and provide scientific basis for clinical diagnosis of KYDS.
2. Experiment
2.1 Chemical reagents
Methanol and acetonitrile of UPLC were both obtained from Dikma Company (USA). Water for UPLC was made by Milli-Q system (USA). Methanoic acid of UPLC was supplied by Honeywell company (USA); sodium pentobarbital (no. 20080603, purchased from Shanghai Chemical Reagent Factory); corticosterone (analytical grade, purchased from Sigma); olive oil (Oliver grade) was produced from Beijing Huasheng Biological Co., Ltd. leucine-enkephalin (SIGMA Technology Co., Ltd., USA); SQP was provided by Beijing Tongren Tang Drug Store (Harbin, China).2.2 Animals
Wistar rats (SPF), male, weighting 226 g ± 10 g, purchased from Beijing Witonglihua Laboratory. Feeding temperature was controlled at 21 ± 2 °C and the range of humidity was from 65% to 75%. The light and dark by turns per 12 h and with natural drink and food. All the Wistar rats were acclimatized to the environment for one week before model establishment. All the rats were raised and supervised by GAP of Heilongjiang University of Chinese Medicine.2.3 Reproduction of KYDS rat model
According to the weight of rats, they were assigned randomly to three groups: control group, model group and SQP group with each group of 10 rats. The model group was subcutaneously injected with 10 mg mL−1 corticosterone solutions, which were diluted with olive oil, continuous injection at 1 mL kg−1 for 21 days. And then lavage with purified water for 21 consecutive days, injected daily with the same dosages of olive oil last 21 days for the control group. During the first 21 days, rats of SQP group were administrated in exactly the same way as the model group. On the 22nd day, the SQP group was lavage with precise concentrations of SQP (SQP were crushed and dissolved in distilled water to 0.36 g mL−1), 10 mL kg−1 as the weight of rats for 21 consecutive days. The experimental procedures were approved by the Animal Care and Ethics Committee at Heilongjiang University of Chinese Medicine and all experiments were performed in accordance to the declaration of Helsinki.2.4 Preparation and collection of sample
On the last day of the experiment, all rats were taken blood by the hepatic portal vein. The blood samples were kept at 4 °C for 30 minutes, and centrifuged at 4000g for 10 minutes. The upper serum was taken and stored in the refrigerator at −80 °C. The serum sample was defrosted at room temperature before analysis. Then we add 800 μL of methanol into 200 μL of the thawed serum samples to precipitate protein. Centrifuge separates the samples at 13![[thin space (1/6-em)]](https://www.rsc.org/images/entities/char_2009.gif) 000g for 10 minutes after vortexing for 30 seconds. The supernatant was dried by nitrogen on water bath at 40 °C, and the residue was dissolved with 200 μL of 80% methanol, following centrifuged at 13
000g for 10 minutes after vortexing for 30 seconds. The supernatant was dried by nitrogen on water bath at 40 °C, and the residue was dissolved with 200 μL of 80% methanol, following centrifuged at 13![[thin space (1/6-em)]](https://www.rsc.org/images/entities/char_2009.gif) 000g for 10 minutes. The supernatant was filtered byPTFE membrane (0.22 μm) for UPLC-HDMS analysis.
000g for 10 minutes. The supernatant was filtered byPTFE membrane (0.22 μm) for UPLC-HDMS analysis.
2.5 Instruments and experimental conditions
Waters Acquity TM UPLC combined with Waters Synapt G2-Si High Definition Mass Spectrometer (HDMS) system and the MassLynx™ 4.1 workstation were utilised for following data acquisition and processing.Chromatographic conditions: ACQUITY UPLC™ HSS T3 (100 mm × 2.1 mm i.d., 1.8 μm, Waters, USA) was chosen as the chromatographic column. The temperature of column was 40 °C and the autosampler was set at 4 °C. Mobile phase system comprise 0.1% methanoic acid–acetonitrile (A) and 0.1% methanoic acid–water (B), with flow velocity of 0.4 mL min−1. Injection volume of sample was 3 μL for both ESI+ and ESI− mode. Gradient elution as follows: 0–2 min, 5–50% A; 2–4 min, 50–60% A; 4–7 min, 60–80% A; 7–10 min, 80–100% A; 10–12 min, stay 100% A.
Mass spectrometry conditions: the ionization source of ESI was operated inion mode of positive (ESI+) with 30 V of sample cone bore voltage, and 3.0 kV of capillary voltage. Temperature of desolvation was 400 °C, and ion source was 110 °C. Desolvent and cone gas flow velocity were 500 L h−1 and 50 L h−1, respectively. In the ion mode of negative (ESI−), the sample cone bore voltage was 40 V, desolvation temperature was 300 °C, velocity of desolvation gas flow was 550 L h−1. Other parameters of the negative ion mode were the same with the positive ion mode. Data were captured under centroid mode and the range of mass scan was 50–1000 Da. For precise mass detection, leucine-enkephalin ([M + H]+ = 556.2771 and [M − H]− = 554.2615) was selected as internal standard, and the lock-mass solution with the concentration of 0.2 ng mL−1.
2.6 Data processing and screening
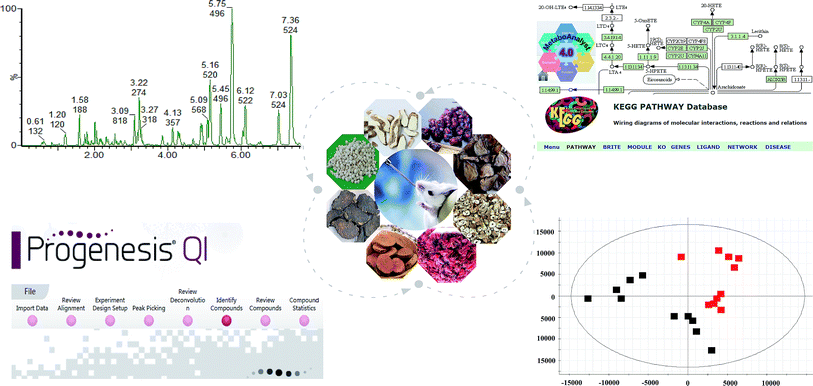
As displayed in Fig. 1, all the source data of serum metabolomics were imported into Progenesis QI 1.0 software for peak processing and normalization. By matching and screening, only the lipid ion peaks were analyzed. The pretreatment data were processed by the method of multivariate statistical analysis, include PCA (principal component analysis) and OPLS-DA (orthogonal partial least squares discriminant analysis) via the EZinfo 3.0.3 software. The value of VIP greater than 1 and P < 0.05 in T-test was selected as potential biomarkers for further identification.3. Results
3.1 Analysis of serum metabolism profile in rats with KYDS model
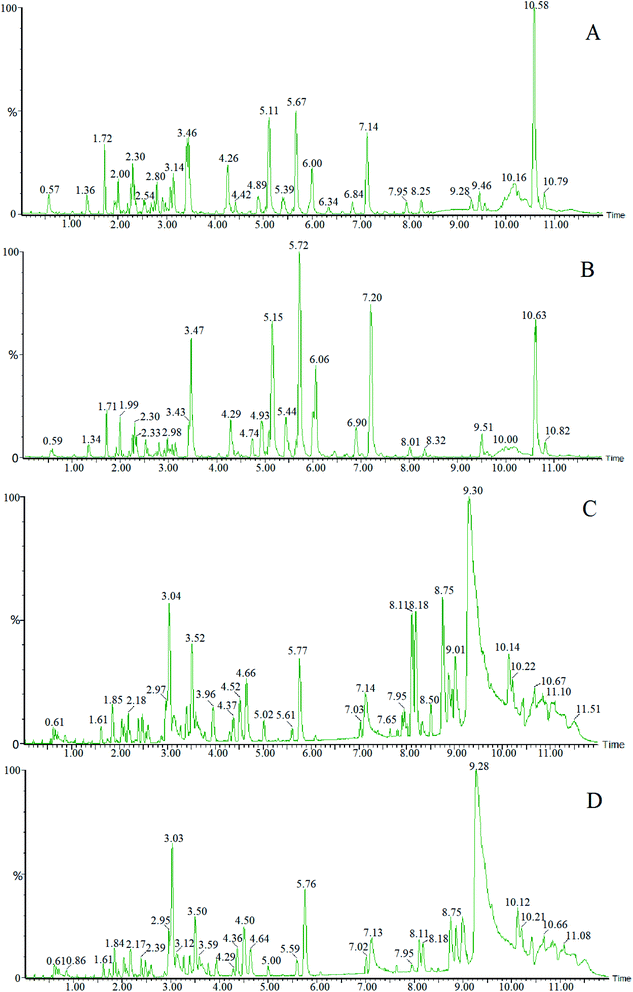
The samples of blank group and model group were collected and processed according to the established analysis conditions of serum endogenous metabolites, and through full scanning analysis by UPLC-HDMS. Typical metabolic profiles of both positive and negative ion pattern were shown in Fig. 2.3.2 Identification of potential lipid biomarkers of KYDS
When used the Progenesis QI to identify compounds, we selected lipid omics and basic lipids as search parameters, and then multiple database searches also be used for data matching and identification, such as LIPID MAPS® Lipidomics Gateway, Metaboanalyst, KEGG, etc. Combining the above databases with the potential biomarkers met the criteria (VIP > 1, P < 0.05), we regarded the screened compound as the lipid biomarkers of KYDS model.3.3 Multivariate statistical analysis of metabolite profiling
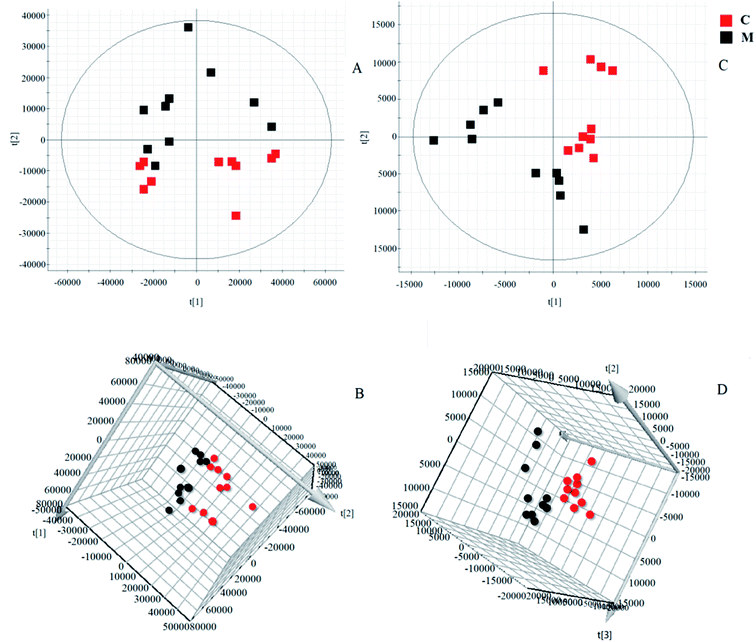
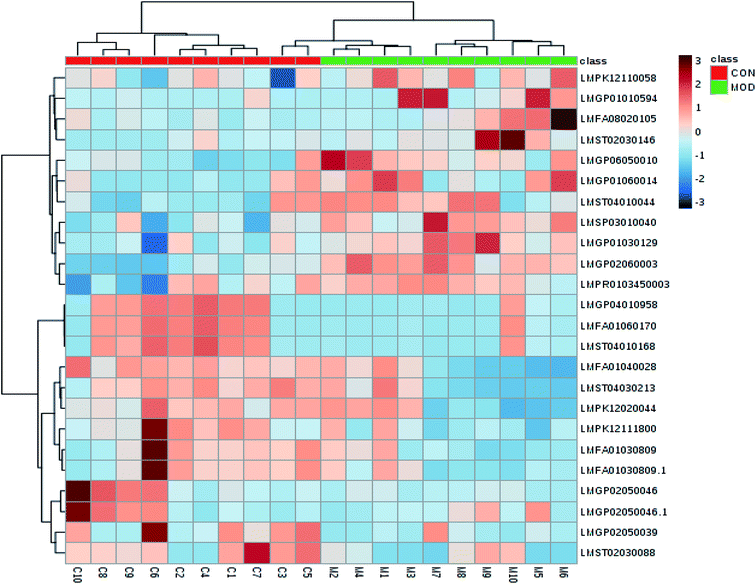
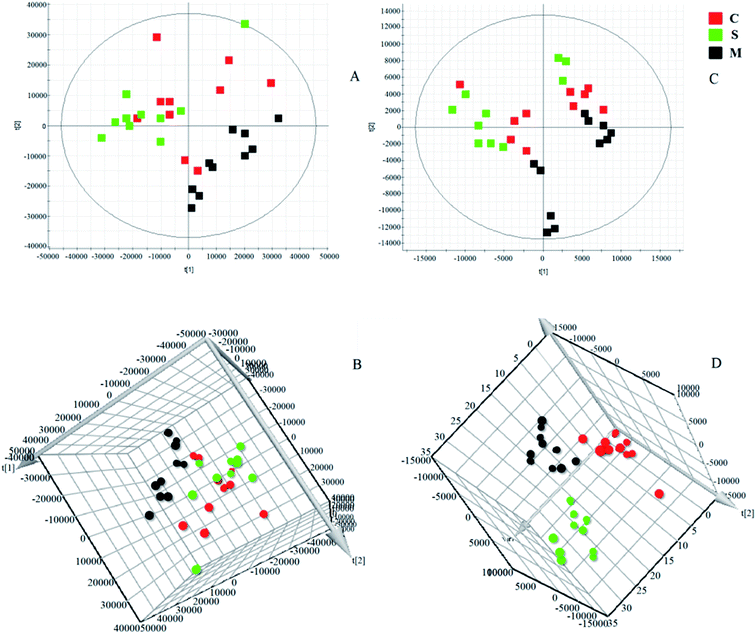
Software of MarkerLynx 4.2 was used for preprocess the raw data of UPLC-HDMS. The results of PCA analysis by EZinfo 3.0.3 software were shown as Fig. 3, included 2D and 3D PCA plots in both positive and negative ion model. As displayed, the control group and the KYDS model group were clustered into two groups with no obvious interaction, it means that the endogenous metabolic network in serum of rats changed significantly after corticosterone injection. VIP-plot (shown in Fig. 4) was obtained by further analysis of OPLS-DA based on serum metabolic profile data, and we chose the ions that satisfy both VIP > 1 and P < 0.05 (t-test) as the target ions. Eventually, according to relative signal intensity of the potential lipid biomarkers, there were 22 lipid biomarkers be discovered. In addition, the significant difference in the lipid metabolites of the control and model group was shown in clustering heatmap as Fig. 5.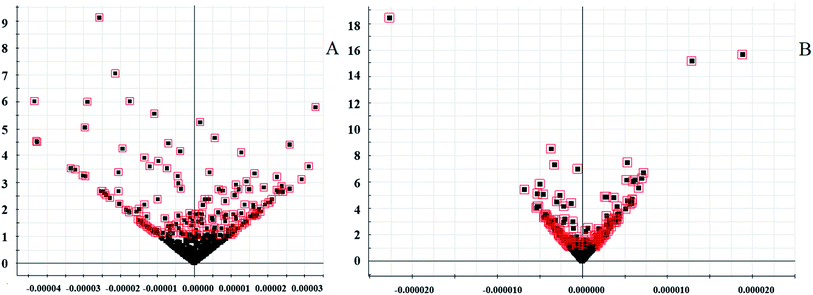 | ||
| Fig. 4 The biomarkers in the VIP and S-plot between control and KYDS model groupanalyzed by OPLS-DA. (A) In positive ion mode; (B) in negative ion mode. | ||
3.4 Intervention and profile analysis of SQP against KYDS
According to the analytical methods mentioned above, three-dimensional information (Rt_m/z_intensity) in serum samples of the control group, model group and SQP group were analyzed, to determine the relative content and the relationship of potential lipid biomarkers in blood of the three groups. The 2D and 3D plots of PLS-DA analysis by EZinfo 3.0.3 software were shown as Fig. 6. The results showed that after SQP treatment, the contents of the 22 potential biomarkers mentioned above all tended to be called back to the control group. Finally, 10 biomarkers with significant differences were identified, compared with the model group. For more detailed information and the intervention effect of SQP on lipid biomarkers based on KYDS were specified in Table S1.† The relative signal intensity of them was displayed in the bar graph as Fig. 7.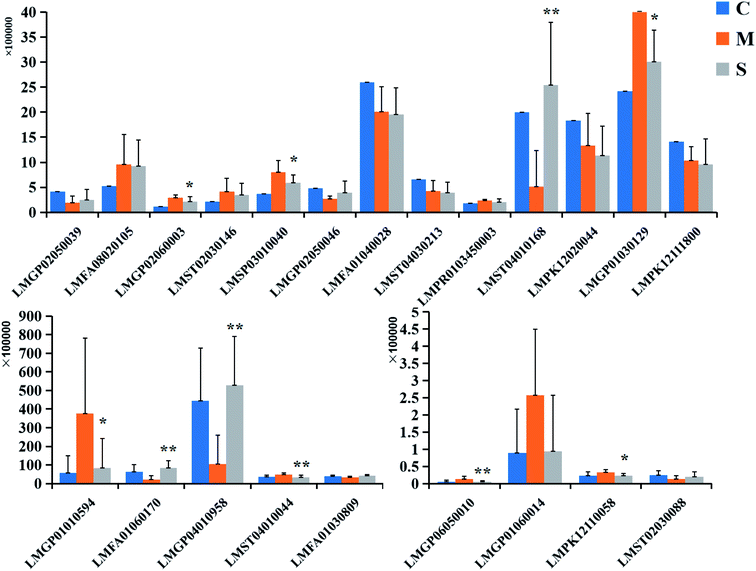 | ||
| Fig. 7 The relative signal intensities of the lipid biomarkers in control, model and SQP group. Compared with KYDS model group: *p < 0.05, **p < 0.01. | ||
4. Discussion
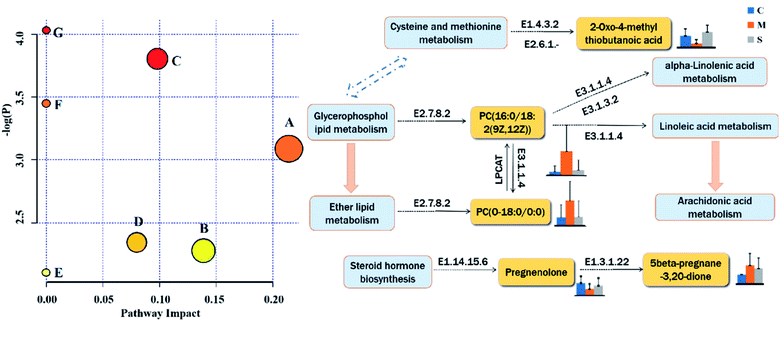
Mass spectrometry (MS)-based omics has developed rapidly in recent years and has become a predictor and interpreter of the relationship between complex phenotypes and metabolic characteristics.24–32 MS is a sensitive, efficient and high throughput method of medicine development, which can provide especially useful structural information for medicine analysis.33–41 In recent years, exponential growth in the application of MS in lipidomics, and separation technology based on MS also got remarkable progress.42–53 It has enabled the discovery of potential biomarkers and explore disease pathogenesis,54–64 disease diagnosis,65–71 prognosis,72–77 and treatment.78–83In our study, based on metabolomics and technology of UPLC-HDMS, the mechanism of SQP related to lipid metabolism was analyzed and characterized, in the model of KYDS induced by corticosterone. Results of PCA and OPLS-DA score plots showed that the metabolic profiling of rats with SQP administration was gradually moving away from the model group, and close to the control group. It means that SQP has a tendency to prevent the occurrence and development of metabolic trajectory in KYDS model. Through various of database and analysis methods, we eventually discovered 22 lipid markers can be regulated by SQP in the model of KYDS, among which, 10 markers were significantly regulated. Combined with the visualized KEGG analysis results, these biomarkers were input into the MetPA platform to analyze the topological characteristics of metabolic pathways, to search the highly correlated metabolic pathways with them. The underlying mechanisms of SQP intervention on KYDS was clarified from the perspective of lipid metabolism as Fig. 8.
Research suggests that there was significant changes of multiple lipid metabolites in the model of KYDS,84,85 and renal damage was also clearly associated with changes in fatty acid metabolism,86 phospholipid level can be used as an indicator of clinical diagnosis and it is a marker of chronic renal failure.87–90 All of the above indicated that lipid metabolism disorders were intimately linked to kidney diseases.91 Glycerophospholipid metabolism includes phosphatidylcholine (PC), phosphatidylethanolamine (PE), phosphatidylglycero (PG), lysophospholipids and so on. Moreover, PC as precursor of alpha-linolenic acid can influence mitochon–drial activity and participate in the tricarboxylic acid cycle through the metabolism of alpha-linolenic acid.92 In the experiment, we found that PC, PE, PG and lysophospholipid were disturbed intensely, however, compared with the model group, SQP has significant callback effect on PE (O-18:0/0:0), PG (18:1 (9Z)/20:1 (11Z)), PC (P-16:0/20:3 (5Z, 8Z, 11Z)), PC (16:0/18:2 (9Z, 12Z)) and SM (d16:1/18:1). Linoleic acid (d4) and 2-oxo-4-methylthiobutanoic acid (P < 0.05) related to fatty acid metabolism also can be up-regulated tends to normal.
Steroid hormone synthesis pathway is an important pathway in the KYDS model, abnormal steroid levels are common in patients with KYDS.93,94 In our study, the steroid content in KYDS model of rats was obviously different from the control group, whereas SQP group can effectively reverse 5beta-pregnane-3,20-dione and pregnenolone in steroid hormone synthesis pathway (P < 0.05).
5. Conclusions
This work mainly emphasizes the establishment of a combination of lipidomics and UPLC-MS technology to clarify the characteristics of lipid metabolism and regulation effect of SQP on KYDS. Based on the current lipidomics platform, we have characterized 22 potential lipid biomarkers associated with the KYDS, and found 10 lipid biomarkers closely related to SQP treating for KYDS. The efficacy of SQP may have significant related to the regulation of 10 potential biomarkers. Consider these markers as the possible drug targets, perturbations in the concentration of them may affect the regulation of relevant lipid metabolic pathways, including ether lipid metabolism, glycerophospholipid metabolism, steroid hormone biosynthesis, cysteine and methionine metabolism. It reveals that SQP could play an intervention role in treatments for KYDS. The UPLC-SYNAPT-G2-Si-HDMS-based lipidomics is a powerful tool to study the essence of disease syndrome. This study also could provide the data basis and scientific method for the further study of SQP therapy for KYDS.Conflicts of interest
There are no conflicts to declare.Acknowledgements
This work was supported by grants from the Key Program of Natural Science Foundation of State (Grant No. 81830110, 81861168037, 81973745, 81903818, 81903847), National Key Research and Development Program of China (2018YFC1706103), National Key Subject of Drug Innovation (Grant No. 2015ZX09101043-005, 2015ZX09101043-011), TCM State Administration Subject of Public Welfare (Grant No. 2015468004), Major Projects of Application Technology Research and Development Plan in Heilongjiang Province (GA18C004, GX16C003), Natural Science Foundation of Heilongjiang Province (YQ2019H030, LH2019H056, QC2018117, H2016056), Chinese Postdoctoral Science Foundation (2017M621319b), University Nursing Program for Young Scholars with Creative Talents in Heilongjiang Province (UNPYSCT-2015118, UNPYSCT-2016213, UNPYSCT-2016212), Foundation of Heilongjiang University of Chinese Medicine (2018jc01, 2018bs02, 2018bs05, 201809), Nursing Program for Young Scholars with Creative Talents of Heilongjiang University of Chinese Medicine (2018RCQ13, 2018RCD21), Heilongjiang Touyan Innovation Team Program.References
- Z. Shen, The location of deficiency syndrome of kidney Yang, Chin. Med. J., 1999, 112(11), 973–975 CAS.
- B. Li, Q. L. Luo and M. Nurahmat, et al., Establishment and comparison of combining disease and syndrome model of asthma with “kidney yang deficiency” and “abnormal savda”, J. Evidence-Based Complementary Altern. Med., 2013, 2013, 1–15 Search PubMed.
- P. D. Boccio, D. Pieragostino and M. D. Ioia, et al., Lipidomic investigations for the characterization of circulating serum lipids in multiple sclerosis, Proteomics, 2011, 74(12), 2826–2836 CrossRef PubMed.
- A. Atac, M. Karabacak and E. Kose, et al., Spectroscopic (NMR, UV, FT-IR and FT-Raman) analysis and theoretical investigation of nicotinamide N-oxide with density functional theory, Spectrochim. Acta, Part A, 2011, 83(1), 250–258 CrossRef CAS PubMed.
- L. Zhao, H. Wu and M. Qiu, et al., Metabolic signatures of kidney yang deficiency syndrome and protective effects of two herbal extracts in rats using GC/TOF MS, J. Evidence-Based Complementary Altern. Med., 2013, 2013, 540957 Search PubMed.
- Y. Tan, X. Liu and C. Lu, et al., Metabolic profiling reveals therapeutic biomarkers of processed Aconitum carmichaeli Debx in treating hydrocortisone induced kidney-yang deficiency syndrome rats, J. Ethnopharmacol., 2014, 152(3), 585–593 CrossRef CAS PubMed.
- D. Huang, J. Yang and X. Lu, et al., An integrated plasma and urinary metabonomic study using UHPLC-MS: Intervention effects of Epimedium koreanum on ‘Kidney-Yang Deficiency syndrome’ rats, J. Pharm. Biomed. Anal., 2013, 76, 200–206 CrossRef CAS PubMed.
- X. Xiong, P. Wang and X. Li, et al., Shenqi pill, a traditional Chinese herbal formula, for the treatment of hypertension: A systematic review, Complement. Ther. Med., 2015, 23(3), 484–493 CrossRef PubMed.
- H. Miao, Y. H. Zhao and D. Nosratola, et al., Lipidomics Biomarkers of Diet-Induced Hyperlipidemia and Its Treatment withPoria cocos, J. Agric. Food Chem., 2016, 64(4), 969–979 CrossRef CAS PubMed.
- Y. Y. Zhao, N. D. Vaziri and R. C. Lin, Lipidomics: new insight into kidney disease, Adv. Clin. Chem., 2015, 68, 153–175 CAS.
- X. J. Wang, A. H. Zhang and X. H. Zhou, et al., An integrated chinmedomics strategy for discovery of effective constituents from traditional herbal medicine, Sci. Rep., 2016, 6, 18997 CrossRef CAS PubMed.
- H. L. Zhang, A. H. Zhang and X. H. Zhou, et al., High-throughput lipidomics reveal mirabilite regulating lipid metabolism as anticancer therapeutics, RSC Adv., 2018, 8, 35600 RSC.
- H. L. Gao, A. H. Zhang and J. B. Yu, et al., High-throughput lipidomics characterize key lipid molecules as potential therapeutic targets of Kaixinsan protects against Alzheimer's disease in APP/PS1 transgenic mice, J. Chromatogr. B: Anal. Technol. Biomed. Life Sci., 2018, 1092, 286–295 CrossRef CAS PubMed.
- T. Cajka and O. Fiehn, LC-MS-Based Lipidomics and Automated Identification of Lipids Using the LipidBlast In-Silico MS/MS Library, Methods Mol. Biol., 2017, 1609, 149–170 CrossRef CAS PubMed.
- X. Han, Lipidomics for studying metabolism, Nat. Rev. Endocrinol., 2016, 12(11), 668–680 CrossRef CAS PubMed.
- X. Han, K. Yang and R. W. Gross, Multi-dimensional mass spectrometry-based shotgun lipidomics and novel strategies for lipidomic analyses, Mass Spectrom. Rev., 2012, 31(1), 134–178 CrossRef CAS PubMed.
- C. Hu, H. Kong and F. Qu, et al., Application of plasma lipidomics in studying the response of patients with essential hypertension to antihypertensive drug therapy, Mol. BioSyst., 2011, 7(12), 3271–3279 RSC.
- B. C. H. Kwan, F. Kronenberg and S. Beddhu, et al., Lipoprotein Metabolism and Lipid Management in Chronic Kidney Disease, J. Am. Soc. Nephrol., 2007, 18(4), 1246–1261 CrossRef CAS PubMed.
- D. F. Markgraf, H. Al-Hasani and S. Lehr, Lipidomics-Reshaping the Analysis and Perception of Type 2 Diabetes, Int. J. Mol. Sci., 2016, 17(11), 1841 CrossRef PubMed.
- K. Huynh, R. N. Martins and P. J. Meikle, Lipidomic Profiles in Diabetes and Dementia, J. Alzheimer's Dis., 2017, 59(2), 433–444 CAS.
- A. H. Zhang, S. Qiu and H. Sun, et al., Scoparone affects lipid metabolism in primary hepatocytes using lipidomics, Sci. Rep., 2016, 6, 28031 CrossRef CAS PubMed.
- Y. Nan, X. H. Zhou and Q. Liu, et al., Serum metabolomics strategy for understanding pharmacological effects of ShenQi Pill acting on kidney yang deficiency syndrome, J. Chromatogr. B: Anal. Technol. Biomed. Life Sci., 2015, 1026, 217–226 CrossRef PubMed.
- A. H. Zhang, H. Sun and G. L. Yan, et al., Metabolomics study of type 2 diabetes using ultra-performance LC-ESI/quadrupole-TOF high-definition MS coupled with pattern recognition methods, J. Physiol. Biochem., 2014, 70(1), 117–128 CrossRef CAS PubMed.
- X. Li, A. Zhang and H. Sun, et al., Metabolic characterization and pathway analysis of berberine protects against prostate cancer, Oncotarget, 2017, 8, 65022–65041 Search PubMed.
- X. N. Li, A. Zhang and M. Wang, et al., Screening the active compounds of Phellodendri Amurensis cortex for treating prostate cancer by high-throughput chinmedomics, Sci. Rep., 2017, 7, 46234 CrossRef CAS PubMed.
- H. Sun, A. H. Zhang and Q. Song, et al., Functional metabolomics discover pentose and glucuronate interconversion pathways as promising targets for Yang Huang syndrome treatment with Yinchenhao Tang, RSC Adv., 2018, 8, 36831–36839 RSC.
- Y. Han, F. Wu and A. Zhang, et al., Characterization of multiple constituents in rat plasma after oral administration of Shengmai San using ultra-performance liquid chromatography coupled with electrospray ionization/quadrupole-time-of-flight high-definition mass spectrometry, Anal. Methods, 2015, 7(3), 830–837 RSC.
- A. Zhang, G. Yan, Y. Han and X. Wang, Metabolomics approaches and applications in prostate cancer research, Appl. Biochem. Biotechnol., 2014, 174, 6–12 CrossRef CAS PubMed.
- Y. Li, S. Qiu and A. H. Zhang, et al., High-throughput metabolomics to identify metabolites to serve as diagnostic biomarkers of prostate cancer, Anal. Methods, 2016, 8, 3284–3290 RSC.
- X. J. Wang, J. L. Ren and A. H. Zhang, et al., Novel applications of mass spectrometry-based metabolomics in herbal medicines and its active ingredients: Current evidence, Mass Spectrom. Rev., 2019, 38(4–5), 380–402 CrossRef CAS PubMed.
- A. Zhang, H. Sun and Y. Yuan, et al., An in vivo analysis of the therapeutic and synergistic properties of Chinese medicinal formula Yin-Chen-Hao-Tang based on its active constituents, Fitoterapia, 2011, 82, 1160–1168 CrossRef CAS PubMed.
- H. Wang, G. Yan and A. Zhang, et al., Rapid discovery and global characterization of chemical constituents and rats metabolites of Phellodendri amurensis cortex by ultra-performance liquid chromatography-electrospray ionization/quadrupole-time-of- flight mass spectrometry coupled with pattern recognition approach, Analyst, 2013, 138, 3303–3312 RSC.
- A. Zhang, H. Sun and X. Wu, et al., Urine metabolomics, Clin. Chim. Acta, 2012, 414, 65–69 CrossRef CAS PubMed.
- J. Xie, A. H. Zhang and S. Qiu, et al., Identification of the perturbed metabolic pathways associating with prostate cancer cells and anticancer affects of obacunone, J. Proteomics, 2019, 206, 103447 CrossRef CAS PubMed.
- A. Zhang, H. Sun and H. Xu, et al., Cell metabolomics, OMICS, 2013, 17(10), 495–501 CrossRef CAS PubMed.
- A. H. Zhang, Z. M. Ma, H. Sun, Y. Zhang, J. H. Liu, F. F. Wu and X. J. Wang, High-Throughput Metabolomics Evaluate the Efficacy of Total Lignans From Acanthophanax Senticosus Stem Against Ovariectomized Osteoporosis Rat, Front. Pharmacol., 2019, 10, 553 CrossRef PubMed.
- A. Zhang, H. Sun and Y. Han, et al., Urinary metabolic biomarker and pathway study of hepatitis B virus infected patients based on UPLC-MS system, PLoS One, 2013, 8(5), e64381 CrossRef CAS.
- A. Zhang, G. Yan and Y. Han, et al., Metabolomics approaches and applications in prostate cancer research, Appl. Biochem. Biotechnol., 2014, 174, 6–12 CrossRef CAS PubMed.
- H. Zhang, A. Zhang and J. Miao, et al., Targeting regulation of tryptophan metabolism for colorectal cancer therapy: a systematic review, RSC Adv., 2019, 9, 3072–3080 RSC.
- H. Sun, A. H. Zhang and S. B. Liu, et al., Cell metabolomics identify regulatory pathways and targets of magnoline against prostate cancer, J. Chromatogr. B: Anal. Technol. Biomed. Life Sci., 2018, 1102–1103, 143–151 CrossRef CAS PubMed.
- A. Zhang, S. Qiu, H. Sun, T. Zhang, Y. Guan, Y. Han, G. Yan and X. Wang, Scoparone affects lipid metabolism in primary hepatocytes using lipidomics, Sci. Rep., 2016, 6, 28031 CrossRef CAS PubMed.
- Y. Zhang, P. Liu and Y. Li, et al., Exploration of metabolite signatures using high-throughput mass spectrometry coupled with multivariate data analysis, RSC Adv., 2017, 7, 6780–6787 RSC.
- X. Liu, A. Zhang and H. Fang, et al., Serum metabolomics strategy for understanding the therapeutic effects of Yin-Chen-Hao-Tang against Yanghuang syndrome, RSC Adv., 2018, 8, 7403–7413 RSC.
- H. Xiong, A. H. Zhang, Q. Q. Zhao, G. L. Yan, H. Sun and X. J. Wang, Discovery of quality-marker ingredients of Panax quinquefolius driven by high-throughput chinmedomics approach, Phytomedicine, 2019, 152928, DOI:10.1016/j.phymed.2019.152928.
- H. Fang, A. H. Zhang and H. Sun, et al., High-throughput metabolomics screen coupled with multivariate statistical analysis identifies therapeutic targets in alcoholic liver disease rats using liquid chromatography-mass spectrometry, J. Chromatogr. B: Anal. Technol. Biomed. Life Sci., 2019, 1109, 112–120 CrossRef CAS PubMed.
- A. H. Zhang, H. Sun and G. L. Yan, et al., Chinmedomics: A Powerful Approach Integrating Metabolomics with Serum Pharmacochemistry to Evaluate the Efficacy of Traditional Chinese Medicine, Engineering, 2019, 5, 60–68 CrossRef CAS.
- H. Sun, H. Wang and A. Zhang, et al., Berberine ameliorates nonbacterial prostatitis via multi-target metabolic network regulation, OMICS, 2015, 19(3), 186–195 CrossRef CAS PubMed.
- H. Sun, H. L. Zhang and A. H. Zhang, et al., Network pharmacology combined with functional metabolomics discover bile acid metabolism as a promising target for mirabilite against colorectal cancer, RSC Adv., 2018, 8, 30061–30070 RSC.
- H. Sun, H. L. Zhang and A. H. Zhang, et al., Network pharmacology combined with functional metabolomics discover bile acid metabolism as a promising target for mirabilite against colorectal cancer, RSC Adv., 2018, 8, 30061–30070 RSC.
- X. Wang, J. Li and A. H. Zhang, Urine metabolic phenotypes analysis of extrahepatic cholangiocarcinoma disease using ultra-high performance liquid chromatography-mass spectrometry, RSC Adv., 2016, 6(67), 63049–63057 RSC.
- Y. Zhao, H. Lv and S. Qiu, et al., Plasma metabolic profiling and novel metabolite biomarkers for diagnosing prostate cancer, RSC Adv., 2017, 7(48), 30060–30069 RSC.
- Y. F. Li, S. Qiu and L. J. Gao, et al., Metabolomic estimation of the diagnosis of hepatocellular carcinoma based on ultrahigh performance liquid chromatography coupled with time-of-flight mass spectrometry, RSC Adv., 2018, 8(17), 9375–9382 RSC.
- A. H. Zhang, J. B. Yu and H. Sun, et al., Identifying quality-markers from Shengmai San protects against transgenic mouse model of Alzheimer's disease using chinmedomics approach, Phytomedicine, 2018, 45, 84–92 CrossRef CAS PubMed.
- T. Zhang, A. Zhang, S. Qiu, S. Yang and X. Wang, Current Trends and Innovations in Bioanalytical Techniques of Metabolomics, Crit. Rev. Anal. Chem., 2016, 46(4), 342–351 CrossRef CAS PubMed.
- H. Cao, A. Zhang and H. Zhang, et al., The application of metabolomics in traditional Chinese medicine opens up a dialogue between Chinese and Western medicine, Phytother. Res., 2015, 29(2), 159–166 CrossRef PubMed.
- A. Zhang, H. Sun and H. Xu, et al., Cell metabolomics, OMICS, 2013, 17(10), 495 CrossRef CAS PubMed.
- S. Qiu, A. Zhang, T. Zhang, H. Sun, Y. Guan, G. Yan and X. Wang, Dissect new mechanistic insights for geniposide efficacy on the hepatoprotection using multiomics approach, Oncotarget, 2017, 8(65), 108760–108770 Search PubMed.
- A. Zhang, H. Sun and G. Yan, et al., Metabolomics study of type 2 diabetes using ultra-performance LC-ESI/quadrupole-TOF high-definition MS coupled with pattern recognition methods, J. Physiol. Biochem., 2014, 70(1), 117–128 CrossRef CAS PubMed.
- A. Zhang, H. Sun and X. Wang, Emerging role and recent applications of metabolomics biomarkers in obesity disease research, RSC Adv., 2017, 7(25), 14966–14973 RSC.
- H. Sun, A. Zhang and L. Yang, et al., High-throughput chinmedomics strategy for discovering the quality-markers and potential targets for Yinchenhao decoction, Phytomedicine, 2019, 54, 328–338 CrossRef CAS PubMed.
- Y. Zhang, P. Liu and Y. Li, et al., Exploration of metabolite signatures using high-throughput mass spectrometry coupled with multivariate data analysis, RSC Adv., 2017, 7, 6780–6787 RSC.
- A. Zhang, H. Sun and Y. Han, et al., Urinary metabolic biomarker and pathway study of hepatitis B virus infected patients based on UPLC-MS system, PLoS One, 2013, 8(5), e64381 CrossRef CAS PubMed.
- H. Sun, A. H. Zhang and Q. Song, et al., Functional metabolomics discover pentose and glucuronate interconversion pathways as promising targets for Yang Huang syndrome treatment with Yinchenhao Tang, RSC Adv., 2018, 8, 36831–36839 RSC.
- X. Wang, A. Zhang and H. Sun, Future perspectives of Chinese medical formulae: chinmedomics as an effector, OMICS, 2012, 16(7–8), 414–421 CrossRef CAS PubMed.
- Q. Liang, H. Liu and H. Xing, et al., Urinary UPLC-MS metabolomics dissecting the underlying mechanisms of huaxian capsule protects against sepsis, RSC Adv., 2016, 6, 40436–40441 RSC.
- X. Wang, A. Zhang and X. Zhou, et al., An integrated chinmedomics strategy for discovery of effective constituents from traditional herbal medicine, Sci. Rep., 2016, 6, 18997 CrossRef CAS PubMed.
- X. Wang, A. Zhang and G. Yan, et al., UHPLC-MS for the analytical characterization of traditional Chinese medicines, TrAC, Trends Anal. Chem., 2014, 63, 180–187 CrossRef CAS.
- H. Sun, M. Wang and A. Zhang, et al., UPLC–Q-TOF–HDMS Analysis of Constituents in the Root of Two Kinds of Aconitum Using a Metabolomics Approach, Phytochem. Anal., 2013, 24(3), 263–276 CrossRef CAS PubMed.
- W. Dong, P. Wang and X. Meng, et al., Ultra-performance Liquid Chromatography–High-definition Mass Spectrometry Analysis of Constituents in the Root of Radix Stemonae and those Absorbed in Blood after Oral Administration of the Extract of the Crude Drug, Phytochem. Anal., 2012, 23(6), 657–667 CrossRef CAS PubMed.
- H. Sun, F. Wu and A. Zhang, et al., Profiling and identification of the absorbed constituents and metabolites of schisandra lignans by ultra-performance liquid chromatography coupled to mass spectrometry, Biomed. Chromatogr., 2013, 27(11), 1511–1519 CrossRef CAS PubMed.
- H. Sun, A. Zhang and G. Yan, et al., Proteomics study on the hepatoprotective effects of traditional Chinese medicine formulae Yin-Chen-Hao-Tang by a combination of two-dimensional polyacrylamide gel electrophoresis and matrix-assisted laser desorption/ionization-time of flight mass spectrometry, J. Pharm. Biomed. Anal., 2013, 75, 173–179 CrossRef CAS PubMed.
- H. Wang, H. Sun and A. Zhang, et al., Rapid identification and comparative analysis of the chemical constituents and metabolites of P hellodendri amurensis cortex and Z hibai dihuang pill by ultra-performance liquid chromatography with quadrupole TOF-MS, J. Sep. Sci., 2013, 36(24), 3874–3882 CrossRef CAS PubMed.
- X. Wang, A. Zhang and H. Sun, et al., Systems biology technologies enable personalized traditional Chinese medicine: a systematic review, Am. J. Chin. Med., 2012, 40(06), 1109–1122 CrossRef PubMed.
- A. Zhang, Q. Liu and H. Zhao, et al., Phenotypic characterization of nanshi oral liquid alters metabolic signatures during disease prevention, Sci. Rep., 2016, 6, 19333 CrossRef CAS PubMed.
- X. Wang, H. Lv and A. Zhang, et al., Metabolite profiling and pathway analysis of acute hepatitis rats by UPLC-ESI MS combined with pattern recognition methods, Liver Int., 2014, 34(5), 759–770 CrossRef CAS PubMed.
- A. Zhang, H. Sun and G. Wu, et al., Proteomics analysis of hepatoprotective effects for scoparone using MALDI-TOF/TOF mass spectrometry with bioinformatics, OMICS, 2013, 17(4), 224–229 CrossRef CAS PubMed.
- H. Cao, A. Zhang and F. Zhang, et al., Ultra-performance liquid chromatography tandem mass spectrometry combined with automated MetaboLynx analysis approach to screen the bioactive components and their metabolites in Wen-Xin-Formula, Biomed. Chromatogr., 2014, 28(12), 1774–1781 CrossRef CAS PubMed.
- Y. Zhang, A. Zhang and Y. Zhang, et al., Application of ultra-performance liquid chromatography with time-of-flight mass spectrometry for the rapid analysis of constituents and metabolites from the extracts of Acanthopanax senticosus harms leaf, Pharmacogn. Mag., 2016, 12(46), 145 CrossRef PubMed.
- H. Cao, A. Zhang and H. Sun, et al., Metabolomics-proteomics profiles delineate metabolic changes in kidney fibrosis disease, Proteomics, 2015, 15(21), 3699–3710 CrossRef CAS PubMed.
- H. Sun, H. Wang and A. Zhang, et al., Chemical discrimination of cortex Phellodendri amurensis and cortex Phellodendri chinensis by multivariate analysis approach, Pharmacogn. Mag., 2016, 12(45), 41 CrossRef CAS PubMed.
- C. Liu, A. Zhang and Y. Han, et al., Ultra-high performance liquid chromatography coupled with time-of-flight mass spectrometry screening and analysis of potential bioactive compounds from traditional chinese medicine Kai-Xin-San, using a multivariate data processing approach and the MetaboLynx tool, RSC Adv., 2015, 5(1), 85–92 RSC.
- T. Zhang, A. Zhang and S. Qiu, et al., Current trends and innovations in bioanalytical techniques of metabolomics, Crit. Rev. Anal. Chem., 2016, 46(4), 342–351 CrossRef CAS PubMed.
- X. N. Li, A. Zhang and H. Sun, et al., Rapid discovery of absorbed constituents and metabolites in rat plasma after the oral administration of Zi Shen Wan using high-throughput UHPLC–MS with a multivariate analysis approach, J. Sep. Sci., 2016, 39(24), 4700–4711 CrossRef CAS PubMed.
- E. S. Schaeffner, T. Kurth and G. C. Curhan, et al., Cholesterol and the risk of renal dysfunction in apparently healthy men, J. Am. Soc. Nephrol., 2003, 14(8), 2084–2091 CAS.
- S. C. Chen, et al., Association of Dyslipidemia with Renal Outcomes in Chronic Kidney Disease, PLoS One, 2013, 8(2), e55643 CrossRef CAS PubMed.
- Y. Y. Zhao, X. L. Chen and F. Wei, et al., Intrarenal metabonoimc investigation of chronic kidey disease and its TGF-B1 mechanism in induced-adenine rats using UPLC Q-TOF/HSMS/MSE, J. Proteome Res., 2013, 12(2), 692–703 CrossRef CAS PubMed.
- Y. Y. Zhao, X. L. Cheng and J. H. Cui, et al., Effect of ergosta-4,6,8(14),22-tetraen-3-one (ergone) on adenine-induced chronic renal failure rat: a serum metabonomic study based on ultra performance liquid chromatography/high-sensitivity mass spectrometry coupled with MassLynx i-FIT algorithm, Clin. Chim. Acta, 2012, 413(19–20), 1438–1445 CrossRef CAS PubMed.
- R. M. Kostrzewa and J. Segura-Aguilar, Plasma metabolic profiling of normal and dysmenorrhea syndrome rats and the effects of Xiang-Fu-Si-Wu Decoction intervention, Neurotoxic. Res., 2003, 5(6), 375–383 CrossRef PubMed.
- Y. Y. Zhao, P. Lei and D. Q. Chen, et al., Renal metabolic profiling of early renal injury and renoprotective effects of Poria cocos epidermis using UPLC Q-TOF/HSMS/MSE, J. Pharm. Biomed. Anal., 2013, 81–82, 202–209 CAS.
- P. Liu, J. A. Duan and J. M. Guo, et al., Plasma metabolic profiling of normal and dysmenorrhea syndrome rats and the effects of Xiang-Fu-Si-Wu Decoction intervention, Pharm. Biol., 2014, 52(5), 603–613 CrossRef PubMed.
- J.-M. Kim and Ji-M. Yu, et al., Analysis of Global Gene Expression Profile of Human Adipose Tissue Derived Mesenchymal Stem Cell Cultured with Cancer Cells, J. Life Sci., 2011, 21(5), 631–646 CrossRef.
- Z. H. Zhang, N. D. Vaziri and F. Wei, An integrated lipidomics and metabolomics reveal nephroprotective effect and biochemical mechanism of Rheum officinale in chronic renal failure, Sci. Rep., 2016, 6(3), 22151 CrossRef CAS PubMed.
- N. Tang, L. Liu and H. Qiu, et al., Analysis of gene expression and functional changes of adrenal gland in a rat model of kidney yang deficiency syndrome treated with Sini decoction, Exp. Ther. Med., 2018, 16(4), 3107–3115 Search PubMed.
- Q. Liu, H. W. Zhao and A. H. Zhang, et al., Chinmedomics strategy to discover effective constituents and elucidate action mechanism of Nanshi capsule against kidney-yang deficiency syndrome, Zhongguo Zhongyao Zazhi, 2016, 41(15), 2901–2914 Search PubMed.
Footnotes |
| † Electronic supplementary information (ESI) available. See DOI: 10.1039/c9ra07621b |
| ‡ These authors contributed equally to this work. |
| This journal is © The Royal Society of Chemistry 2020 |

