 Open Access Article
Oleogelation using pulse protein-stabilized foams and their potential as a baking ingredient†
Athira Mohanan,
Yan Ran Tang,
Michael T. Nickerson and
Supratim Ghosh *
*
Department of Food and Bioproduct Sciences, University of Saskatchewan, 51 Campus Drive, Saskatoon, SK, Canada S7N5A8. E-mail: supratim.ghosh@usask.ca; Tel: +1 306 966 2555
First published on 15th April 2020
Abstract
Structuring liquid oil into a self-standing semisolid material without trans and saturated fat has become a challenge for the food industry after the recent ban of trans fat by the US Food and Drug Administration and Health Canada. Lately, the use of hydrocolloids such as animal proteins and modified cellulose for oleogel preparation has gained more attention. However, plant proteins have never been explored for the development of oleogels. The present study explored the use of freeze-dried foams prepared using protein concentrates and isolates of pea and faba bean with xanthan gum at different pH values for oil adsorption and subsequent oleogelation. Compared to protein isolate stabilized foams, protein concentrate-stabilized foams displayed (i) higher oil binding capacity (OBC) due to a higher number of smaller pore size; and (ii) lower storage modulus and firmness due to the higher oil content. At all pH values, there was no significant difference between the OBC of different protein isolates, but among the concentrates, pea displayed higher OBC than faba bean at pH 5 and faba bean displayed higher OBC than pea at pH 9. Results showed that such oleogels could be used as a shortening alternative. Cakes prepared using the pea protein-based oleogel at pH 9 displayed a similar specific volume as that of shortening-based cake, although with higher hardness and chewiness.
1. Introduction
Structuring liquid oils into self-standing semisolid materials is essential for their use in baked products, such as cakes, pastries, muffins and cookies, where functionality, texture and palatability of the final product depend on the type of fat present.1 Owing to the harmful effects of using trans fats in food, and their recent ban by the US Food and Drug Administration and Health Canada, food scientists are searching for alternative approaches to structuring liquid oils with tunable physicochemical properties. Oleogelators, such as plant waxes, fatty esters, mono and diglycerides, and ethyl cellulose, capable of converting a liquid oil into a self-standing semi-solid structure (known as an ‘oleogel’), have widely been considered as a potential alternatives to trans and saturated fats.1 Recently, the use of food hydrocolloids for the preparation of oleogels has gained more attention, and significant research effort is underway.1–7Proteins are a widely used food-grade polymer with high nutritional value and have shown potential for use as oleogelators.8,9 However, since proteins are insoluble in oil, a direct approach cannot be used to bind oil and induce gelation. Many indirect oleogelation approaches, such as the conversion of protein-stabilized emulsions,5 foams,7 and hydrogels4,8,9 into oleogels, have been investigated. The foam-templated approach of oleogelation seems more feasible since there is no high-temperature drying as in the emulsion-templated approach or several steps of solvent exchange processes required for hydrogels to oleogel conversion. However, so far only hydroxyl propyl methylcellulose (HPMC)7 and a combination of gelatin and xanthan gum (XG) have been used for foam-templated oleogelation.2
A number of plant-derived proteins are also available, which have the functional properties required for foam stabilization,10 and hence have the potential for the oleogel preparation using the foam-templated approach. However, despite the growing consumer demand for plant-based protein sources, research on the use of plant proteins as oleogelators is non-existent. Therefore, the aim of this study was to examine the suitability of foams stabilized by different pulse proteins (e.g., pea and faba bean protein concentrates and isolates) combined with xanthan gum for the oleogelation of canola oil (CO) and to evaluate their functionality as shortening alternatives. To our knowledge, pulse proteins have never been used for oleogelation. We recently showed that two pulse proteins from pea and faba bean along with xanthan gum at a range of pH values could be successfully used for foam generation.11 Here we investigated how protein–polysaccharide interactions in the freeze-dried foam affect oil binding capacity, rheological and structural properties of the oleogels. The most suitable pulse protein foam-based oleogel was also tested in cake baking and compared with cakes baked with CO and conventional highly saturated shortening.
2. Materials and methods
2.1. Materials
Pea protein concentrate (PPC; 47.9% protein, wet basis (w.b.); 6.1% moisture, 4.9% ash, 38.8% carbohydrate, and 2.2% lipid) was kindly donated by Parrheim Foods (Saskatoon, SK, Canada). Faba bean protein concentrate (FPC; 58.9% protein, wet basis (w.b.), 6.2% moisture, 5.9% ash, 26.6% carbohydrate, and 2.4% lipid) and isolate (FPI; 83.0% protein w.b., 5.9% moisture, 3.4% ash, 3.8% carbohydrate, and 3.9% lipid) were kindly donated by AGT Food and Ingredients (Saskatoon, SK, Canada). Pea protein isolate (PPI; 78.2% protein, w.b., 6.0% moisture, 6.0% ash, 8.2% carbohydrate and 3.6% lipid) was kindly donated by Nutri-Pea Limited (Portage la Prairie, MB, Canada); while xanthan gum (XG 83.7% carbohydrate, 9.4% moisture, 6.9% ash) was purchased from Bulk Barn Store (supplied by Duinkerken Foods Inc., Summerside, PEI, Canada). CO (Great Value brand) and 100% vegetable shortening (Crisco brand, composed of soybean oil, hydrogenated palm oil, modified palm oil, mono and diglycerides, TBHQ and citric acid) were purchased from Walmart Canada grocery store. Milli-Q™ water (Millipore Corporation, MA, USA) was used for all the solution preparation. All other chemicals were purchased from Sigma Aldrich, Canada.2.2. Preparation and properties of foams
2.3. Preparation and properties of the oleogels
| Wf = Wi − (Wa − Wb) | (1) |
The oil binding capacity (OBC), a measure of final oil content per unit foam weight, was calculated by dividing Wf with the dry foam weight used to hold the oil according to eqn (2):
 | (2) |
2.4. Preparation and characterization of cakes
The viscosity and viscoelasticity of cake batters were measured using the AR-G2 rheometer (TA Instruments, Montreal, QC, Canada) with a 40 mm acrylic parallel plate. Viscosity analysis was carried out by rotational shear mode at 25 °C with a gap of 500 μm and as a function of increasing shear rate from 0.01 to 1000 s−1. For viscoelasticity, oscillatory strain sweep (from 0.01% to 100%) was applied at a constant frequency of 1 Hz at 25 °C to find out the linear viscoelastic region, and then a frequency sweep measurement was performed from 0.01 to 10 Hz at a constant strain of 0.05%.
The specific gravity of the cake batters was determined from the ratio of the weight of a certain volume of batter to the weight of the same volume of water. The specific volume of the cakes was obtained using the ratio of the volume of cake, to the weight of the cake. The cake volume was determined using rapeseed displacement procedure according to AACC 10-05 method.15
Texture profile analysis of prepared cakes was measured using a texture analyzer (TA-Plus texture analyzer, Stable Micro Systems Ltd. Surrey, UK), 24 h after baking according to Kim et al.16 with slight modification. Pieces of cake samples were cut into 2 cm cubes and compressed two times with a cylindrical probe of diameter 2.5 cm at a speed of 2 mm s−1 until the height of the cake pieces were 50%. The hardness, springiness, cohesiveness, gumminess, and chewiness were measured from the texture profile analysis using the Exponent software (version 6.1.4.0, Stable Micro Systems Ltd.) according to Friedman et al.17
2.5. Statistical analysis
All foams and oleogels were prepared in triplicates. Three batches of cakes were prepared for each formulation. All the other experimental measurements were carried out in triplicate using different foam, oleogel and cake samples, and the average and standard deviation are reported in the manuscript. The results were statistically analyzed from the analysis of variance and t-test at a significance level of 5% using Microsoft Excel 2013.3. Results and discussions
3.1. Development of pulse protein-stabilized foams
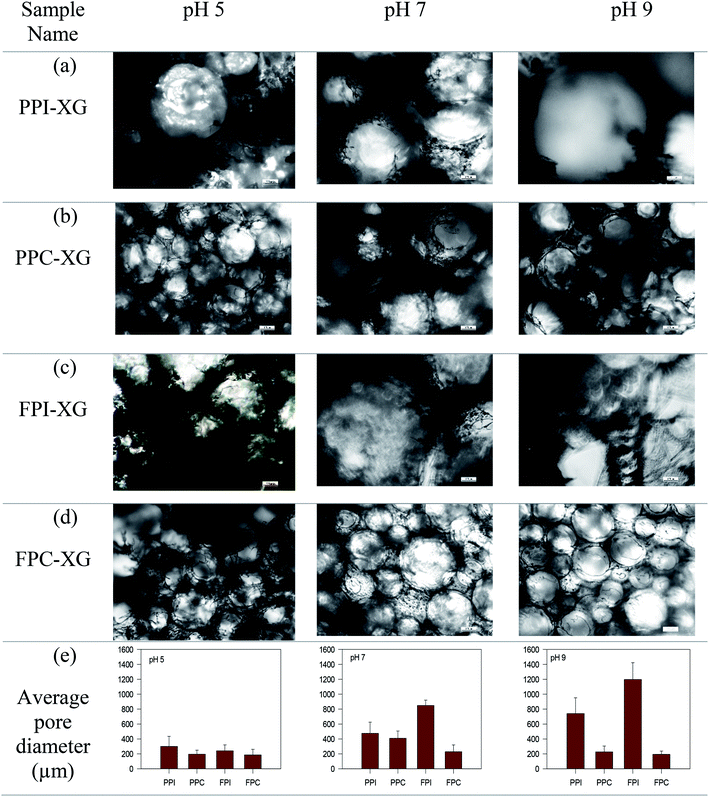
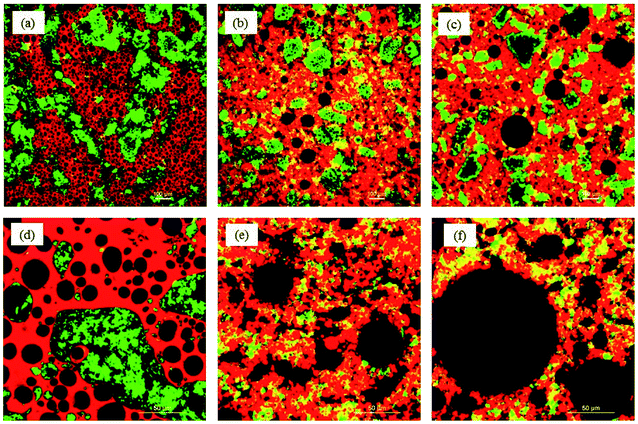
Foams were freeze-dried to obtain a porous structure essential for oil absorption. Freeze drying resulted in the formation of a self-standing porous sponge-like structure, except for the foams prepared at pH 3, which destabilized during freeze-drying, and appeared as a powder. Therefore, the foams prepared at pH 3 were excluded from oleogel preparation. The ability of any porous structure to adsorb oil is related to their microscopic pore size, pore density, connectivity between the pores and the interaction between the oil and the material used for the preparation of porous structure.18,19 Therefore, the microstructure of the freeze-dried foams was determined and their average pore (bubble) size was calculated from the corresponding microscopic images (Fig. 1). In general, the protein concentrate foams (Fig. 1b and d) displayed smaller pore sizes, and a homogeneous distribution of pores at all pH values compared to the corresponding protein isolate-stabilized foams (Fig. 1a and c). For example, the average pore size of PPC and FPC foams was 227.4 ± 78.7 μm and 193.6 ± 45.4 μm at pH 9 compared to the pore size of 741.1 ± 210.8 μm and 1197.9 ± 224.1 μm for PPI and FPI foams, respectively. PPC and FPC foams displayed thick boundaries around the pores at both pH 7 and pH 9 compared to pH 5, such that a clear separation between the bubbles could be observed in the majority of the foam microstructure (Fig. 1b and d). For PPI and FPI foams at pH 5, no clear boundaries between the pores were observed, most of the pores were broken, and some powders of freeze-dried protein–XG mixtures were also observed (Fig. 1a and c). A stronger dry-foam structure at pH 7 and 9 compared to pH 5 could be due to a thicker and stronger viscoelastic interface formed at the higher pH values. Also, the ability of protein concentrates to provide a stronger dry foam structure compared to the isolates could be due to the presence of additional polysaccharides in the concentrates which could provide additional stability to the air bubbles by forming a viscous and thick barrier around them.20 Moreover, the higher lipid content present in the protein isolates might have also negatively affected the adsorption of proteins on the air–water boundaries and decreased the strength of the protein foam network. It is known that the foamability of proteins are influenced by the presence of lipid. For example, the foaming properties of egg white proteins were negatively affected by the addition of fat.213.2. Oleogelation
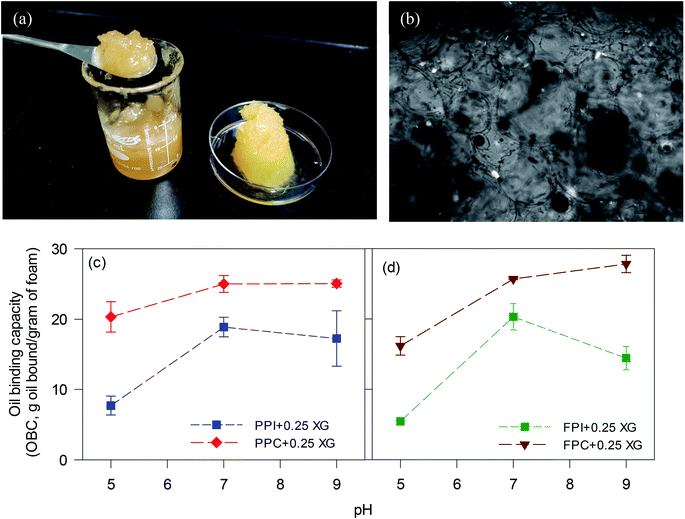
Oleogels were prepared by adding CO to the freeze-dried porous foams. Dry foams readily adsorbed liquid CO and facilitated the formation of soft self-standing gel-like structures, as seen in Fig. 2a. The protein foam network holding the oil was clearly visible under polarized light as dark rings (Fig. 2b). The affinity of these porous structures to the oil might be due to the interaction of oil with the hydrophobic patches on the proteins at the pore surface, similar to the mechanism of oil binding of HPMC foam described by Patel et al.7 It is known that to accommodate the hydrophobic phase (such as air and oil), proteins must open up their structure to expose the internal hydrophobic patches.22,23 In the present case, hydrophobic patches exposed during foam formation remained at the air bubble interface after the freeze-drying and interacted with the oil at the pore surface.Higher OBC for protein concentrate-stabilized foams compared to protein isolates could be due to the smaller pore size and a higher number of pores in the former (Fig. 1). Since the hydrophobic patches on the proteins may cover a large surface area when the pores are smaller, protein concentrate-foams could effectively bind a larger amount of oil compared to protein isolate-foams. Also, as discussed before, the presence of a significantly higher amount of polysaccharide in the concentrates compared to the isolates could provide additional stability to the freeze-dried foam against oil loss during centrifugation, leading to a higher OBC. Although the pore sizes in PPC and FPC foams at pH 5 were similar (p > 0.05) as that of pH 7 and pH 9 (Fig. 1e), the foams prepared at pH 5 were weaker (Fig. 1) and they shrank and collapsed during oil addition, indicating a poor foam strength, which resulted in significantly lower OBC at pH 5 compared to pH 7 and 9. Therefore, not only the microscopic pore size but also the strength of the protein network was responsible for the OBC of freeze-dried protein foams. It should be noted that the strength of the protein network discussed here is qualitatively based on their microstructure and behaviour during oil addition as quantitative determination of protein network strength of foam or freeze-dried foam was not possible. Our previous work on foam stability revealed no significant difference between these pH values,11 and interfacial rheology of quiescent protein film would not represent the appropriate interface of foam bubbles.24
![[double bond, length as m-dash]](https://www.rsc.org/images/entities/char_e001.gif) O), 1744 cm−1 (C
O), 1744 cm−1 (C![[double bond, length as m-dash]](https://www.rsc.org/images/entities/char_e001.gif) O, originated from CO), 2852–2874 cm−1 (symmetric CH2 stretching), 2924–2925 cm−1 (antisymmetric CH2 stretching) and 3280–3295 cm−1 (hydroxyl groups (–OH) of polymers in the freeze-dried foams), which was similar to the FTIR spectra of oleogels prepared using gelatin–XG stabilized foam2 and other biopolymer-stabilized oleogels.27,30 In the present case, the shift of peak positions of symmetric and antisymmetric stretching vibrations of C–H bonds of canola oil towards higher wavenumber (2921 in canola oil to 2924–2925 in oleogel, and 2852 in canola oil to 2854–2875 in oleogel) was observed (Table S1†), indicating the change in chemical environment of protein and oil due to their interaction. Moreover, shift in peaks around 3280–3285 cm−1 in foams towards higher wavenumbers in oleogels (around 3290–3295 cm−1), and shifts in amide II band positions indicate decrease in hydrogen bonding between protein–XG or intramolecular hydrogen bonding present in protein and concomitant increase in hydrophobic interaction between the protein and oil during oleogel formation.28,29 Therefore the protein–protein and protein–XG network formed via hydrogen bonding is altered by the addition of liquid oil during the formation of oleogels. Stretching of –OH bands were mostly influenced by the change in pH of the foams used for oleogel preparation, which indicates that the intermolecular and the intramolecular hydrogen bonding in the oleogels were mostly influenced by pH of the foams used for oleogel preparation.
O, originated from CO), 2852–2874 cm−1 (symmetric CH2 stretching), 2924–2925 cm−1 (antisymmetric CH2 stretching) and 3280–3295 cm−1 (hydroxyl groups (–OH) of polymers in the freeze-dried foams), which was similar to the FTIR spectra of oleogels prepared using gelatin–XG stabilized foam2 and other biopolymer-stabilized oleogels.27,30 In the present case, the shift of peak positions of symmetric and antisymmetric stretching vibrations of C–H bonds of canola oil towards higher wavenumber (2921 in canola oil to 2924–2925 in oleogel, and 2852 in canola oil to 2854–2875 in oleogel) was observed (Table S1†), indicating the change in chemical environment of protein and oil due to their interaction. Moreover, shift in peaks around 3280–3285 cm−1 in foams towards higher wavenumbers in oleogels (around 3290–3295 cm−1), and shifts in amide II band positions indicate decrease in hydrogen bonding between protein–XG or intramolecular hydrogen bonding present in protein and concomitant increase in hydrophobic interaction between the protein and oil during oleogel formation.28,29 Therefore the protein–protein and protein–XG network formed via hydrogen bonding is altered by the addition of liquid oil during the formation of oleogels. Stretching of –OH bands were mostly influenced by the change in pH of the foams used for oleogel preparation, which indicates that the intermolecular and the intramolecular hydrogen bonding in the oleogels were mostly influenced by pH of the foams used for oleogel preparation.Smoothed second derivatives amide I band of FTIR spectra for each protein powder, foams and their oleogels are provided in Fig. S2 (ESI†). Examples of second derivatives amide I band and their corresponding de-convoluted peaks for FPC-XG mixed powder, foam and oleogel are also shown in Fig. S3 (ESI†). Each secondary structure component was quantified by their peak area percentage and is shown in Fig. 3. The changes in percent peak areas of protein concentrates and isolates displayed similar trends in the secondary structure during foam and oleogel formation. In general, beta-sheet reduced in all protein–XG mixtures during foam formation, while it increased when the foam transformed into the oleogel. Alpha helix increased in all foams, but it decreased when the foam was transformed into the oleogel for PPI and PPC (Fig. 3a and b). For FPI (Fig. 3c) insignificant change in alpha-helix content was observed when the foam was transformed into the oleogel, while for FPC, it was increased (Fig. 3d). The content of beta-turn decreased for all when powder protein samples transformed into foams and oleogels. Random coil content decreased during the transformation of powder into foam and increased when the foam was transformed into the oleogel for both the pea proteins (Fig. 3a and b), while for both the faba bean proteins it decreased during both the foam and oleogel formation (Fig. 3c and d).
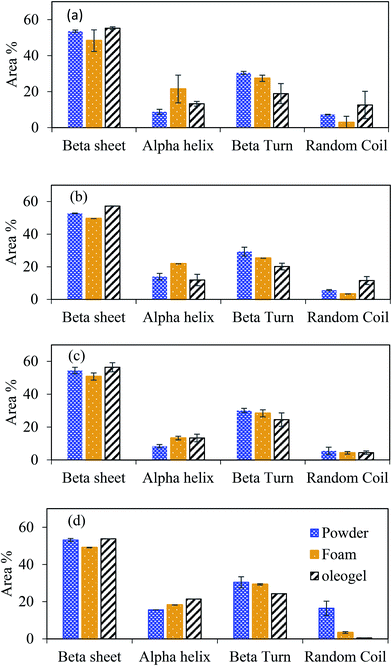 | ||
| Fig. 3 The area% of characteristics secondary structure peaks of (a) PPI-XG, (b) PPC-XG, (c) FPI-XG and (d) FPC-XG powder, freeze-dried foam and corresponding oleogels at pH 9. | ||
Analysis of protein secondary structure indicates that beta turns are unfavourable to accommodate hydrophobic oil into the protein network; hence their content decreased significantly when the protein foams were converted into oleogel. However, the suitability of the random coil structure towards oil depends on the protein type. It was reported previously that the proteins adsorbed on a hydrophobic surface take random coil structure at the early stage of adsorption, and at a later stage, convert into an alpha helix and beta-sheet conformation.25 In the present case, an increase in the beta-sheet structure was seen for all proteins upon oil adsorption, indicating more hydrophobic interactions. For alpha helix, an increase was observed for the faba bean proteins at the expense of random coil; however, for both the pea proteins, alpha helix decreased while the random coils remained higher. Therefore, the changes in alpha-helix and random coil structures in different oleogels depended on the protein type and the presence of non-protein materials.
Overall, the FTIR analysis showed that during the formation of oleogels, hydrogen bonding between the biopolymers decreased while hydrophobic interaction increased. Similar changes in intermolecular interactions were also observed in gelatin–XG foam stabilized oleogels.2 Also, an increase in oil loading was reported in the case of whey protein aerogel with increased hydrophobic interaction.30 All of these reveals that the hydrophobic interaction might be the major interaction in the formation of protein-stabilized oleogels. Both van der Waals and hydrophobic interactions reduce when the distance between the two objects increases. Therefore, when the pores were large in size, the interaction between the protein foam surface and the oil in the middle of the pore would be weak, leading to a lower OBC for the foams with a larger pore size (Fig. 1 and 2).
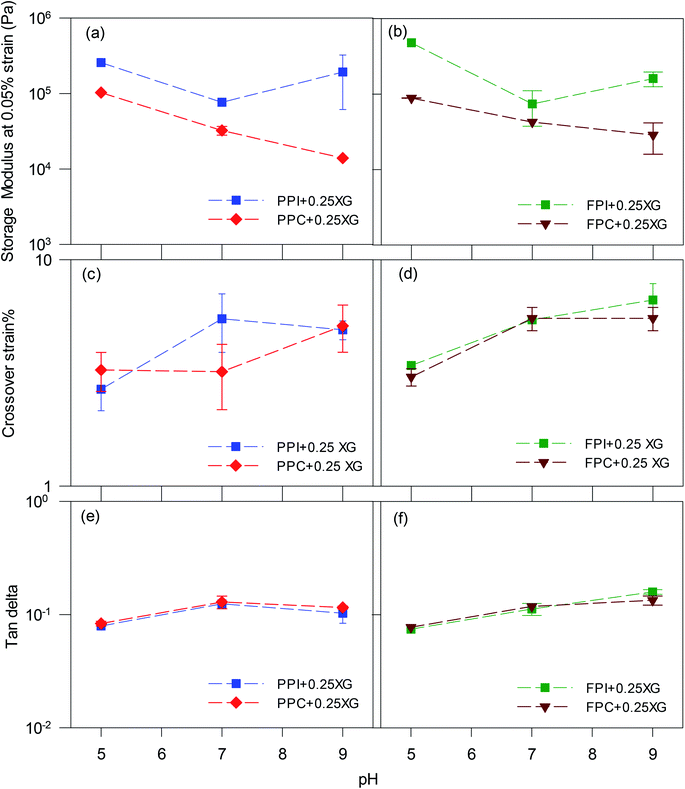
To directly compare, G′ at 0.05% strain and crossover strain of all oleogels were re-plotted in Fig. 4. The strain 0.05% fell within the linear viscoelastic region of the oleogels; therefore, the G′ values would be representative of an un-disturbed gel structure. Oleogels prepared with protein isolates displayed higher G′ than the corresponding protein concentrate-stabilized oleogels at all pH values (p < 0.05) (Fig. 4a and b), which could be due to the lower oil content of the protein isolate-stabilized oleogels (Fig. 2c and d). Also, the protein isolate-oleogels had a higher quantity of protein which might have exerted higher resistance against oscillatory strain, thereby increasing the gel strength. Irrespective of protein type, all oleogels made with pH 5 foams displayed the highest gel strength but least crossover strain (Fig. 4c and d), indicating a brittle foam network which could be broken at a lower strain. Crossover strain increased with an increase in pH, indicating more force will be required to break the gel network at higher pH values. The tan delta values (Fig. 4e and f) remain around 0.1 for all oleogels at any pH value indicating elastic gel-like structure within the LVR.
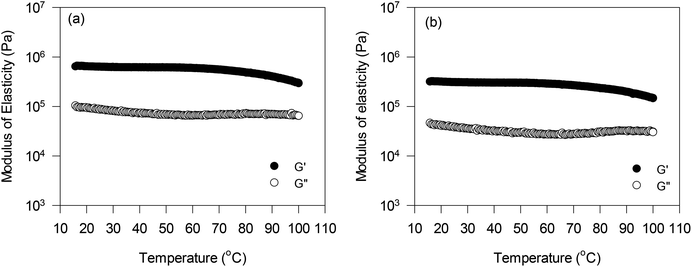
The effect of temperature on the viscoelastic behaviour of oleogels was also investigated at a constant strain and frequency within the linear viscoelastic region. Results for only PPC and FPC oleogels at pH 9 are shown in Fig. 5, since they had higher oil content, and could be used in the baking application. The G′ values of both the oleogels were significantly higher than the G′′ values in the temperature range studied. Initially, very little change in G′ was observed up to 80 °C, then it started decreasing with further increase in temperature. This could be due to some structural breakdown due to the decrease in hydrogen bonding within the protein network at a higher temperature, which led to an increase in the flowability of the oleogels. Patel et al.7 also reported a similar decrease in both G′ and G′′ values of HPMC foam-stabilized oleogels with an increase in temperature. It should be noted that the PPC and FPC oleogels displayed higher G′ and G′′ values than the HPMC oleogels,7 which were in the order of 104 Pa.
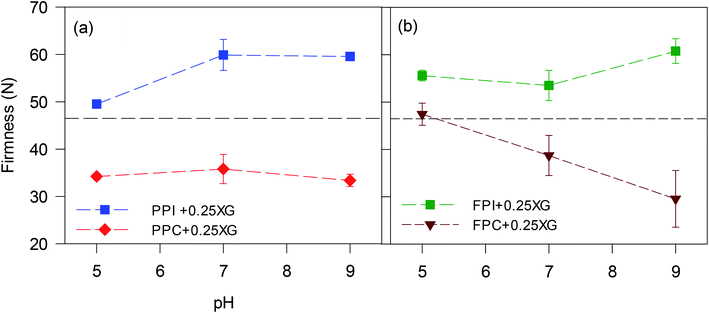
Overall, the microstructures of the foams, as well as the affinity of foams to bind the oil, played crucial roles in determining the viscoelasticity and spreadability of oleogels. PPI and FPI oleogels, with lower oil content and higher firmness, were not suitable for replacing shortening. Protein concentrate foams at pH 9, with smaller pore size, stronger protein network for pore stability displayed higher ability to bind oil and made consistent oleogel, which were easy to spread and could be suitable for shortening replacement in a baking application.
3.3. Cake baking with oleogel
The role of shortening (rich in saturated fat) in cake is to increase air incorporation, cover the gluten and starch particles present in the flour, reduce the gluten network, and increase the lubrication and moisture retention.31 Shortening helps produce a softer final product with a delicate flavour. To see the effectiveness of oleogel as a shortening alternative, cakes were prepared by entirely replacing shortening with an oleogel prepared from PPC-stabilized freeze-dried foam at pH 9. The oleogel prepared from this particular foam was chosen since it provided a stable oleogel with high oil binding capacity (Fig. 2a) and a firmness closest to the shortening (Fig. 6a). This particular oleogel had more than 95% liquid CO (OBC of 25.05 g oil/g dry PPC foam is equivalent to 95.6% oil content). Cakes were also baked using 100% CO for comparison.| Sample | Batter specific gravity | Cake specific volume (mL g−1) |
|---|---|---|
| Shortening | 0.87 ± 0.06a | 2.21 ± 0.05a |
| Canola oil | 1.23 ± 0.03c | 2.14 ± 0.16a |
| Oleogel | 1.15 ± 0.01b | 2.33 ± 0.05a |
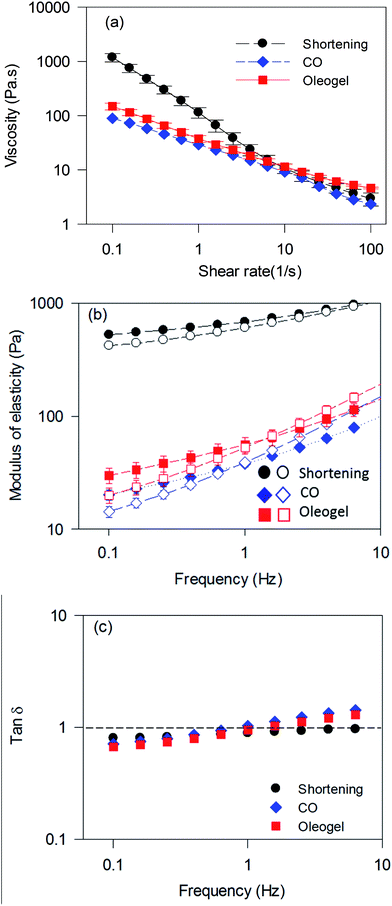
Optimum batter rheology is required to incorporate air bubbles as well as to stabilize them during baking.34 The change in batter viscosity with respect to the change in shear rate is displayed in Fig. 8a. All three batter samples showed pseudoplastic behaviour, where viscosity decreased with an increase in shear rate. The batter prepared using shortening displayed about 6-times higher viscosity at a lower shear rate (less than 0.1 s−1) compared to the batters prepared using the oleogel and CO (Fig. 8a). Reduction in viscosity and increase in specific gravity of batters were also reported when shortening was replaced by sesame oil35 and rapeseed oil.33
Fig. 8b and c show the frequency-dependent viscoelastic properties of cake batters. All batters displayed higher G′ than G′′ in the lower frequency range, but both G′ and G′′ reduced significantly when shortening was replaced by CO or the oleogel. tan![[thin space (1/6-em)]](https://www.rsc.org/images/entities/char_2009.gif) δ (ratio of G′′ to G′) for shortening batter increased with an increase in frequency but remained less than 1 throughout the frequency range, indicating dominant elastic behaviour. Both CO and oleogel batters briefly displayed lower tan
δ (ratio of G′′ to G′) for shortening batter increased with an increase in frequency but remained less than 1 throughout the frequency range, indicating dominant elastic behaviour. Both CO and oleogel batters briefly displayed lower tan![[thin space (1/6-em)]](https://www.rsc.org/images/entities/char_2009.gif) δ than shortening batter below 0.5 Hz frequency; however, it raised rapidly going over more than 1 beyond 1 Hz, indicating transformation from elastic to viscous behaviour. The higher viscosity and gel strength of shortening batter compared to the others could be attributed to the presence of solid fat crystals and the associated stabilization of a higher amount of air. Similar changes in batter rheology were also observed when shortening was replaced with wax-based oleogel3,17 and HPMC foam-stabilized oleogel3 in the preparation of muffin batters. Although the oleogel consists of a significant amount of liquid oil, it's batter showed slightly higher G′ than CO batters, which could be due to increased air incorporation and water-binding capacity of the pea proteins.36 It has been reported that water-binding capacity of ingredients reduce availability of free water and movement of particles during shear leading to an increased viscosity.37 A higher G′ was also observed when HPMC foam-stabilized oleogels were utilized for batter preparation compared to a liquid oil, which was ascribed to the higher amount of air incorporation in the former.6
δ than shortening batter below 0.5 Hz frequency; however, it raised rapidly going over more than 1 beyond 1 Hz, indicating transformation from elastic to viscous behaviour. The higher viscosity and gel strength of shortening batter compared to the others could be attributed to the presence of solid fat crystals and the associated stabilization of a higher amount of air. Similar changes in batter rheology were also observed when shortening was replaced with wax-based oleogel3,17 and HPMC foam-stabilized oleogel3 in the preparation of muffin batters. Although the oleogel consists of a significant amount of liquid oil, it's batter showed slightly higher G′ than CO batters, which could be due to increased air incorporation and water-binding capacity of the pea proteins.36 It has been reported that water-binding capacity of ingredients reduce availability of free water and movement of particles during shear leading to an increased viscosity.37 A higher G′ was also observed when HPMC foam-stabilized oleogels were utilized for batter preparation compared to a liquid oil, which was ascribed to the higher amount of air incorporation in the former.6
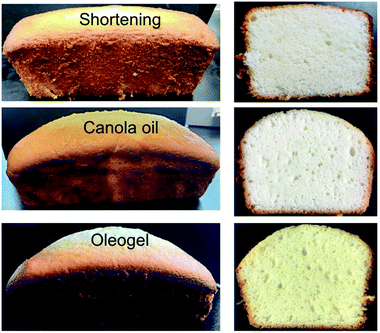 | ||
| Fig. 9 The images of final cakes made with different types of fat. Cross section of the cakes is also shown on the right side. | ||
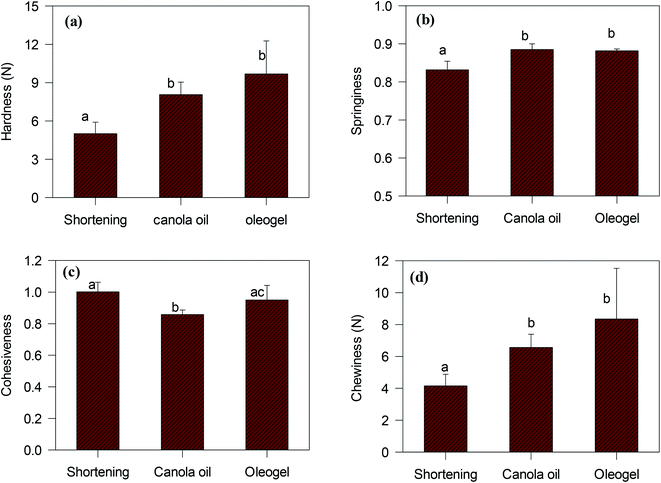
Texture profile analysis was performed on the cake samples to understand how the oleogel-based cakes would differ from traditional shortening-based cakes. An example of the texture profile curves for the three different cakes is shown in the ESI (Fig. S5†). The textural properties of different cakes (hardness, springiness, cohesiveness, chewiness), calculated from the “two-bite” texture profile analysis,38 are compared in Fig. 10. Hardness, defined as the force necessary to attain a given deformation, was calculated from the height of the first peak (Fig. S5†).38 Cohesiveness, a measure of internal bond-strength against ‘chewing’ action, was determined from the ratio of the second to the first peak area. The springiness of a cake is a measure of its compressibility during ‘chewing’, which was calculated from the length of the second compression to the total compression. Finally, chewiness, a secondary parameter, defined as the energy required to masticate a solid food product, was calculated from the product of primary parameters (hardness, cohesiveness and springiness).17
According to Fig. 10, oleogel cakes displayed higher hardness, springiness, and chewiness than the shortening cake (p < 0.05). The hardness and the chewiness of the oleogels cakes were double as that of the shortening cake. An increase in hardness and chewiness of cakes were also reported when shortening was replaced with foam-stabilized oleogels.7 The cakes made with CO also displayed higher hardness and chewiness than the shortening cake, which were similar to the report of Sowmya et al.35 Hardness is an indicator of staling of baked products. Monoglycerides present in the shortening could form a complex with amylose of wheat flour and reduce the staling process,39 which could produce a softer crust for the cake. Lack of monoglyceride might have facilitated adhesion of starch and protein particles40 and resulted in higher hardness and chewiness of the CO and oleogel cakes.
Overall, the inability of the oleogel to stabilize the air bubbles during batter preparation and unwanted interaction between protein and starch remains a major issue limiting the quality of the cakes prepared with the oleogel. To overcome this, a small amount of solid fat, such as saturated monoglyceride or plant wax, might be added to the oil phase before adsorption into the foam matrix. It could improve oil binding capacities of the foam-stabilized oleogels and therefore texture and rheological properties of the oleogels. Moreover, emulsifiers such as saturated monoglyceride can help incorporate more air into the batter and develop a softer cake crust. In the future, we will incorporate them into the oleogels to improve the quality of the cakes.
4. Conclusions
Porous structures prepared by freeze-dried aqueous foams of PPC, PPI, FPC and FPI were found to bind liquid CO and lead to the formation of oleogels. Protein secondary structure uncovered using FTIR spectroscopy revealed that the freeze-dried foams interaction with oil changes protein conformation during oleogel preparation. Oil binding capacities of the foams were found to be controlled by the size, number and connectivity of the pores in the freeze-dried foams. The mechanical properties of the oleogels were influenced by the OBC, as well as the ability of the foams to retain oil under stress. The oleogels with higher oil content, made with foams stabilized by protein concentrates at pH 7 and pH 9, were less elastic and easily spreadable. Therefore, protein concentrates were better than the isolates for the preparation of oleogels using the foam-templated approach. In the end, cakes were successfully made using oleogel as a shortening alternative, but the textural qualities of the oleogel cakes were not as good as shortening cakes which could be ascribed to poor air incorporation in the oleogel batter and unwanted protein and starch interactions in the cakes, compared to the shortening.Conflicts of interest
There are no conflicts to declare.Acknowledgements
This work was supported by the Agriculture Development Fund (ADF) from the Saskatchewan Ministry of Agriculture, Canada – Saskatchewan Growing Forward 2 bi-lateral agreement, Saskatchewan Pulse Growers (project# 20160136); CFI-John R. Evans Leaders Fund (2012-31292), and Innovation and Science Fund (ISF) from Saskatchewan Ministry of Advanced Education.References
- A. R. Patel and K. Dewettinck, Food Funct., 2016, 7, 20–29 RSC.
- M. Abdollahi, S. A. H. Goli and N. Soltanizadeh, Eur. J. Lipid Sci. Technol., 2019, 1900196 Search PubMed.
- S. Lee, Food Hydrocolloids, 2018, 77, 796–802 CrossRef.
- L. Manzocco, F. Valoppi, S. Calligaris, F. Andreatta, S. Spilimbergo and M. C. Nicoli, Food Hydrocolloids, 2017, 71, 68–75 CrossRef CAS.
- A. R. Patel, N. Cludts, M. D. B. Sintang, A. Lesaffer and K. Dewettinck, Food Funct., 2014, 5, 2833–2841 RSC.
- A. R. Patel and K. Dewettinck, Eur. J. Lipid Sci. Technol., 2015, 117, 1772–1781 CrossRef CAS PubMed.
- A. R. Patel, D. Schatteman, A. Lesaffer and K. Dewettinck, RSC Adv., 2013, 3, 22900–22903 RSC.
- A. De Vries, J. Hendriks, E. Van Der Linden and E. Scholten, Langmuir, 2015, 31, 13850–13859 CrossRef CAS PubMed.
- A. De Vries, A. Wesseling, E. van der Linden and E. Scholten, J. Colloid Interface Sci., 2017, 486, 75–83 CrossRef CAS PubMed.
- S. Damodaran, J. Food Sci., 2005, 70, R54–R66 CrossRef CAS.
- A. Mohanan, M. T. Nickerson and S. Ghosh, Accepted in Food Chemistry, 2019 Search PubMed.
- H. Pehlivanoğlu, M. Demirci, O. S. Toker, N. Konar, S. Karasu and O. Sagdic, Crit. Rev. Food Sci. Nutr., 2018, 58, 1330–1341 CrossRef PubMed.
- J. Kong and S. Yu, Acta Biochim. Biophys. Sin., 2007, 39, 549–559 CrossRef CAS PubMed.
- AACC International, Approved Methods of Analysis, 11th edn, Method 90-10.01, Baking Quality of Cake Flour, approved October 08, 1976, reapproval November 3, 1999, AACC International, St. Paul, MN, U.S.A., 1999 Search PubMed.
- AACC International, Approved Methods of Analysis, 11th edn, AACC Method 10-05.01 Guidelines for Measurement of Volume by Rapeseed Displacement, AACC International, St. Paul, MN, U.S.A., 2001 Search PubMed.
- J. Y. Kim, J. Lim, J. Lee, H. S. Hwang and S. Lee, J. Food Sci., 2017, 82, 445–452 CrossRef CAS PubMed.
- H. H. Friedman, J. E. Whitney and A. S. Szczesniak, J. Food Sci., 1963, 28, 390–396 CrossRef.
- J. Pinto, A. Athanassiou and D. Fragouli, J. Phys. D: Appl. Phys., 2016, 49, 145601 CrossRef.
- M. O. Adebajo, R. L. Frost, J. T. Kloprogge, O. Carmody and S. Kokot, J. Porous Mater., 2003, 10, 159–170 CrossRef CAS.
- S. Turgeon, C. Schmitt and C. Sanchez, Curr. Opin. Colloid Interface Sci., 2007, 12, 166–178 CrossRef CAS.
- K. Lomakina and K. Mikova, Czech J. Food Sci., 2006, 24, 110–118 CrossRef CAS.
- S. Damodaran, Protein functionality in food systems, 1994, pp. 1–37 Search PubMed.
- P. J. Hailing and P. Walstra, Crit. Rev. Food Sci. Nutr., 1981, 15, 155–203 CrossRef PubMed.
- F. A. Husband, P. J. Wilde, A. R. Mackie and M. J. Garrood, J. Colloid Interface Sci., 1997, 195, 77–85 CrossRef CAS PubMed.
- H. Wu, Y. Fan, J. Sheng and S.-F. Sui, Eur. Biophys. J., 1993, 22, 201–205 CrossRef CAS PubMed.
- E. Dickinson, Colloids Surf., B, 1999, 15, 161–176 CrossRef CAS.
- Z. Meng, K. Qi, Y. Guo, Y. Wang and Y. Liu, Food Chem., 2018, 246, 137–149 CrossRef CAS PubMed.
- F. R. Lupi, V. Greco, N. Baldino, B. de Cindio, P. Fischer and D. Gabriele, J. Colloid Interface Sci., 2016, 483, 154–164 CrossRef CAS PubMed.
- M. Suzuki, Y. Nakajima, M. Yumoto, M. Kimura, H. Shirai and K. Hanabusa, Langmuir, 2003, 19, 8622–8624 CrossRef CAS.
- M. Ahmadi, A. Madadlou and A. A. Saboury, Food Chem., 2016, 196, 1016–1022 CrossRef CAS PubMed.
- E. Wilderjans, A. Luyts, K. Brijs and J. A. Delcour, Trends Food Sci. Technol., 2013, 30, 6–15 CrossRef CAS.
- J. Wootton, N. Howard, J. Martin, D. McOsker and J. Holme, Cereal Chem., 1967, 44, 333–343 CAS.
- N. Hesso, C. Garnier, C. Loisel, S. Chevallier, B. Bouchet and A. Le-Bail, Food Struct., 2015, 5, 31–41 CrossRef.
- F. Ronda, B. Oliete, M. Gómez, P. A. Caballero and V. Pando, J. Food Eng., 2011, 102, 272–277 CrossRef.
- M. Sowmya, T. Jeyarani, R. Jyotsna and D. Indrani, Food Hydrocolloids, 2009, 23, 1827–1836 CrossRef CAS.
- J. P. Peters, F. J. Vergeldt, R. M. Boom and A. J. van der Goot, Food Hydrocolloids, 2017, 65, 144–156 CrossRef CAS.
- S. F. Dogan, S. Sahin and G. Sumnu, Eur. Food Res. Technol., 2005, 220, 502–508 CrossRef CAS.
- M. Peleg, J. Food Sci., 1976, 41, 721–722 CrossRef.
- S. Cauvain, Trends Food Sci. Technol., 1998, 9, 56–61 CrossRef CAS.
- K. Mattil, Bailey's industrial oil and fat products, 1964, pp. 265–388 Search PubMed.
Footnote |
| † Electronic supplementary information (ESI) available. See DOI: 10.1039/c9ra07614j |
| This journal is © The Royal Society of Chemistry 2020 |

