DOI:
10.1039/C9RA07302G
(Paper)
RSC Adv., 2020,
10, 1142-1151
Investigating the biodegradation of sulfadiazine in soil using Enterobacter cloacae T2 immobilized on bagasse†
Received
11th September 2019
, Accepted 11th December 2019
First published on 8th January 2020
Abstract
The application of the wide-spectrum antibiotic sulfadiazine (SD) in veterinary medicine has created serious environmental issues due to its high mobility and non-degradability. This research details the investigation of SD biodegradation in soil, as well as the degradation pathways of SD by immobilized SD-degrading bacterial strains on a biomass carrier. Soil remediation is generally expected to be more difficult compared with in an aqueous and air environment because of the stealth and diversity of pollutants and the complexity of soil matrices (soil texture, pH and organic matter). In this study, an immobilization system consisting of bagasse and a microorganism is proven to have a high degradation potential, and is non-toxic, low-cost, renewable and applicable for SD biodegradation in soil. Single colonies were obtained by repeatedly streaking cultures supplemented with increment (50 mg L−1) of SD concentration. According to biochemical tests, 16S rDNA gene sequence homology and internal transcribed spacer (ITS) sequence analysis, they are identified as T2 (Enterobacter cloacae) and Z3 (fungal entophyte), respectively. Batch tests were conducted to establish a link between the SD degradation rate and environmental conditions, such as the temperature, pH and heavy metal ions. Under optimum conditions (28 °C, pH = 3.5, 15% inoculation amounts of T2), the degradation of SD in soil reached 78.19%. The degradation pathway of SD is summarized on the basis of the ultra-high performance liquid chromatography-quadrupole time-of-flight (UPLC-Q-TOF) analyses of the biodegradation products.
1 Introduction
A rising trend has been observed in global antibiotic consumption, in which the defined daily doses (DDDs) rose from 21.1 (2010) to 34.8 billion (2015), and this is projected to continue, reaching 128 billion in 2030 without policy changes.1 Sulfadiazine [4-amino-N-(2-pyrimidinyl) benzene sulfonamide], one of the sulfonamide antibiotics, has been widely used on humans and livestock for the treatment of bacterial infections.2 The majority of antibiotic like sulfonamides are excreted via feces and urine and may enter the soil through manure application to agricultural fields,3,4 while other pathways such as application of sewage sludge disposal5 and biosolids,6 use of industrial waste water for irrigation,7 and the excessive grazing of animals8 also contribute to the accumulation of such antibiotics in the soil. Some of the sulfonamide compounds are not permanently adsorbed by the soil matrix, which may lead to a continuous flow of sulfonamide into the groundwater.9 The detected concentrations of sulfonamides in the aqueous environment are in the sequence: waste water from waste water treatment plants (WWTPs) or animal farms (2–60 μg L−1)10,11 > surface water (10 ng L−1–1.4 μg L−1)12,13 > ground water (below 10 ng L−1).14–16 The residual concentration of sulfadiazine (SD) in soil matrices adjacent to livestock farms reaches up to 2.45 mg kg−1,17 but it ranges from 100–1000 μg kg−1 in other fields.18–20 Similar to other antibiotics, the introduction of SD into the environment will inevitably accelerate the generation of antimicrobial genes among the microbial community. In addition, Hu et al. (2010) developed a mathematical model to depict the relationship between the residual rate of antibiotics in vegetable fields and the concentration of antibiotics in manure, suggesting that SD demonstrates the second highest bioaccumulation capacity (residual rate = 1.6%) among three typical antibiotics (tetracyclines, sulfonamides and quinolones.). As a consequence, SD and the corresponding antibiotic resistance can transfer from vegetables and animals via the food chain,16 thus causing infectious diseases,21 allergies22 and the risk of acute kidney injury.23 Therefore, it is vital to conduct novel and efficient research on the degradation of SD. To remove residual SD in the environment, several methods have been proposed, involving oxidation, biodegradation, adsorption and photodegradation.24 Yadav et al. (2018)25 explored the extent of SD removal via photo-persulfate-oxidation (UV-C/PS). In this system, a complete degradation of SD (99.8%) was observed within 10 min under optimal conditions. Microbacterium lacus strain SDZm4, isolated by Wolfgang et al. (2013)26 from soil treated with manure containing 14C-labeled SD, was found to degrade SD (35 μmol L−1) completely after 10 d of incubation. Malesic-Eleftheriadou et al. (2019)27 synthesized biobased-PET-TiO2 composite films and this system showed a high catalytic activity towards sulfadiazine (0.007 min−1) in an aqueous environment after five cycles. The functionalized biochar system with high hydrophobicity and aromaticity was utilized as a sorbent and a high equilibrium concentration (13.3 mg g−1) was obtained after being introduced into stock solutions (100 mg L−1) of sulfonamides.28 Although some experiments associated with SD biodegradation and the mechanism of whole procedure have been carried out via a variety of advanced techniques (membrane bioreactors,29,30 activated sludge systems31,32 and microbial medium26,33), the majority of efforts were merely made to investigate the remediation of SD contaminated wastewater rather than soil matrices, which may be due to the fact that microbial adaptation to soil environment takes a reasonably long time, as well as the high cost of the remediation procedure.34 Thus, a novel biodegradation system that not only reduces costs, but also enhances survival and stability of microorganisms is imperative. The cell immobilization technique has been considered to be a promising method when it comes to the treatment of pollutants due to its practicality, low-cost and environmental-friendliness in comparison to conventional pathways.35 Immobilized cells have many advantages over free living cells: high cell density in the matrix; protection against changing environmental conditions (pH, temperature and toxic substances); few secondary pollutants; convenient recovery; and reuse. Research on the degradation of contaminants through cell immobilization has attained remarkable results over the last few years.36–38 Hence, the immobilized cells technique has the potential to degrade toxic substances efficiently. The correct selection of immobilization carriers is essential for designing an effective system that suits each particular purpose.39 In recent years, sugarcane bagasse, a cheap, renewable, abundant and eco-friendly biomass support, has gained increasing attention in the bioremediation of toxic substances.40,41 Compared with other biomass carrier materials, sugarcane bagasse has some advantages: (1) reduction of the mass transfer of cells due to its highly porous nature; (2) suitability for gas evolution during cell growth; (3) it is nontoxic; (4) it is easily available; (5) provides carbon and energy for cell growth.41–43 In this research, some potential bio-carrier materials were investigated for determining an optimal carrier (peanut shell and straw). Finally, sugarcane bagasse was employed as a matrix for cell immobilization to degrade SD on the basis of the cell immobilization status. We reported the isolation of two strains, T2 and Z3, which were found to have an excellent capacity for SD degradation in soil. Based on the 16S rDNA gene sequence analysis and the internal transcribed spacer (ITS) sequence analysis, two SD-degrading strains were identified within the species of the bacterium Enterobacter cloacae (GenBank accession no. KU049659) and fungal entophyte (GenBank accession no. KR016777), respectively. The colonies of T2 are milky white with a rod, edge-ordered and smooth morphology. Strain Z3 is green and rough with irregular edges. Enterobacter cloacae (T2) widely exists in soil, manure and intestines,44,45 while fungal endophyte (Z3) can be isolated from plants.46 During the last few years, numerous bacterial species, such as Shewanella sp47 and Microbacterium lacus sp,26 have been well applied for sulfadiazine biodegradation. The aims of this study were: (1) to determine the optimal biomass material according to the microbial growth status and investigate the degradation behavior of SD-degrading strains immobilized on the optimal carrier in soil under different environmental conditions (temperature, pH, inoculum biomass and heavy metal ions); (2) to explore SD degradation using immobilized cells and freely suspended cells; (3) to reveal the degradation pathway of SD based on the biodegradation metabolites.
2 Materials and methods
2.1 Chemicals
Sulfadiazine (98%) was purchased from Macklin, Shanghai, China. All other chemicals and solvents used in this study were of analytical grade and purchased in Guangzhou Chemical Reagent Factory (Guangdong, China). The SD degrading strains were isolated from samples of pig manure from a local pig farm in Guangdong, China. Before the collection of pig manure, the pigs were administrated with SD for more than 5 d for the treatment of meningitis. Sugarcane bagasse, straw and peanut shells were collected from the South China Agricultural University farm to determine the optimum bio-carrier material. The soil samples were obtained from South China Agricultural University arboretum, air-dried, sieved through a 3 mm mesh and stored at ambient temperature. The soil samples had no history of exposure to SD. A summary of the characteristics of the soil samples is shown in Table 1.
Table 1 Physico-chemical characteristics of the soil samples
| pH |
Total organic matter (g kg−1) |
Total nitrogen (g kg−1) |
Total phosphorus (g kg−1) |
Cation-exchange capacity (cmol kg−1) |
Particle size (% content of total soil) |
| (0.2–0.02 mm) |
(0.02–0.002 mm) |
(<0.002 mm) |
| 4.59 |
32.15 |
0.76 |
0.22 |
32.60 |
42.15 |
18.32 |
39.53 |
2.2 Isolation of the microorganism
Pig manure (1.5 g) and 100 mL of sterilized water was added to a 250 mL Erlenmeyer flask and shaken for 30 min to obtain a bacterial suspension. The bacterial suspension was transferred to a selective medium with 10 mg L−1 of SD. After 7 d of incubation, the microbial colonies were transferred to another selective medium containing 50 mg L−1 of SD. This transfer was repeated six times to obtain a pure microbial strain. The selective medium contained the following per liter: K2HPO4 0.5 g, KH2PO4 0.5 g, NaCl 0.2 g, MgSO4 0.2 g, NH4NO3 1.0 g, SD 0.05 g, trace element solution 10 mL, 25 g agar. The trace element solution contained: FeSO4 0.1 g L−1, MnSO4 0.1 g L−1, ZnSO4 0.1 g L−1, Na2MoO4 0.01 g L−1, CaCl2 0.1 g L−1, MgSO4 3 g L−1, CuSO4 0.1 g L−1. 0.1 g SD was dissolved in ammonia and added to 50 g sterile soil. Ammonia was removed through evaporation. The contaminated soil was mixed with 950 g of sterile soil to obtain a final SD concentration of 100 mg kg−1.
2.3 Identification of microorganisms
It is widely accepted that gene coding for 16S ribosomal RNA (16S rRNA) sequences are the ideal targets for bacterial classification because of the presence of the conserved domain and variable domain.48,49 Direct analysis of 16S rRNA sequences is generally hindered by practical problems such as “sequence anomalies”, or the massive requirements of a complete rRNA.50 In comparison to rRNA, their corresponding DNA sequences possess a higher stability and availability.51 Thus, the method of sequencing of enzymatically amplified DNA is considered to be an indirect alternative for determination of ribosomal RNA sequences.50,52 After the extraction of DNA, amplification procedure (polymerase chain reaction (PCR)), analysis via agarose gel electrophoresis and purification, the products were sequenced and compared with those sequences which have been deposited in the GenBank database. For fungi, the ITS located in the spacer region between the 16S–5.8S–26S region of ribosomal DNA is widely applied in identification53 and phylogeny analysis. The entire identification procedure for fungi is similar to bacteria.53
After isolation, cultivation and enrichment, two pure strains, T2 and Z3, which were capable of utilizing SD as a carbon source, were selected for the following experiments. The isolated strains were characterized based on the 16S rDNA gene sequence, ITS sequence analysis and studies of the physico-biochemistry and morphology. PCR reactions were conducted in 50 μL of solution containing the following: 2 μL DNA, 25 μL Taq plus mix, 21 μL ddH2O, 4 μL primers. The PCR amplification procedures were: initial denaturation at 95 °C for 5 min, 30 cycles of denaturation for 30 s at 95 °C, annealing for 30 s at 55 °C, extension for 35 s at 72 °C, and a final elongation for 10 min at 72 °C. The PCR products were sequenced by the Honortech Corporation (Guangzhou, China), and the obtained nucleotide sequences were compared to those available in the Genbank database via a BLAST search. Finally, a neighbor-joining phylogenetic tree was constructed based on the nucleotide sequences from the SD-degrading strain T2 and Z3 and the closely related species.
2.4 Cell growth and optimum biomass carrier
The pure SD-degrading strains were transferred into a sterile selective medium with SD under dark conditions at 28 °C on a rotary shaker at 120 rpm. After 48 h, the microbial strains were washed with 5 mL of mineral salt solution to create cell suspensions. The mineral salt solution contained the following per liter of distilled water: K2HPO4 0.5 g, KH2PO4 0.5 g, NaCl 0.2 g, MgSO4 0.2 g, NH4NO3 1.0 g, trace element solution 10 mL. Cell suspension samples were obtained every 6 h for the measurement of the cell density using a UV-Vis spectrophotometer at a wavelength of 600 nm.54 The SD-degrading strains were immobilized on sugarcane bagasse, straw, and peanut shells. Cell immobilization was conducted by mixing 3.5 mL of cell suspension and 1 g of biomass material in a mineral salt solution and placed on a rotary shaker at 120 rpm and 28 °C under dark conditions. After 48 h, the microorganism-biomass carrier mixture was washed with 13.5 mL of phosphate buffer solution to obtain the cell suspension samples. The OD600 values of the samples were measured using a UV-Vis spectrophotometer.
2.5 Extraction of SD from soil
The extraction process was then conducted. 50 mL of the extraction solvent was added to the soil samples. The extraction solvent consisted of a buffer solution and methanol (1![[thin space (1/6-em)]](https://www.rsc.org/images/entities/char_2009.gif) :
:![[thin space (1/6-em)]](https://www.rsc.org/images/entities/char_2009.gif) 1). The buffer solution was prepared by mixing 21.0 g of citric acid and 20.4 g of MgCl2 per liter. After that, the mixture was transferred into two 50 mL centrifuge tubes equally and agitated in a horizontal shaker at 120 rpm for 5 min. The mixture was subsequently placed into an ultrasonic bath for 15 min followed by centrifuging at 4500 rpm for 10 min. The above described processes were performed in triplicate. The supernatant was combined and transferred into a 250 mL round bottom flask. The resulting supernatant volume was reduced under vacuum using rotary evaporation. The supernatant was adjusted to 20 mL with methanol–water (3
1). The buffer solution was prepared by mixing 21.0 g of citric acid and 20.4 g of MgCl2 per liter. After that, the mixture was transferred into two 50 mL centrifuge tubes equally and agitated in a horizontal shaker at 120 rpm for 5 min. The mixture was subsequently placed into an ultrasonic bath for 15 min followed by centrifuging at 4500 rpm for 10 min. The above described processes were performed in triplicate. The supernatant was combined and transferred into a 250 mL round bottom flask. The resulting supernatant volume was reduced under vacuum using rotary evaporation. The supernatant was adjusted to 20 mL with methanol–water (3![[thin space (1/6-em)]](https://www.rsc.org/images/entities/char_2009.gif) :
:![[thin space (1/6-em)]](https://www.rsc.org/images/entities/char_2009.gif) 2) and filtered through 0.22 μm syringe filters for analysis using high performance liquid chromatography (HPLC).55–59 The SD concentrations were detected by a HPLC (Agilent 1100) equipped with a UV detector at 267 nm and a ZORBAX Eclipse XDB-C18 column (4.6 × 250 mm, 5 μm). The column temperature was 25 °C and the injection volume was 20 μL. For separation, ultrapure water containing 0.3 acetic acid (A) and acetonitrile (B) (A
2) and filtered through 0.22 μm syringe filters for analysis using high performance liquid chromatography (HPLC).55–59 The SD concentrations were detected by a HPLC (Agilent 1100) equipped with a UV detector at 267 nm and a ZORBAX Eclipse XDB-C18 column (4.6 × 250 mm, 5 μm). The column temperature was 25 °C and the injection volume was 20 μL. For separation, ultrapure water containing 0.3 acetic acid (A) and acetonitrile (B) (A![[thin space (1/6-em)]](https://www.rsc.org/images/entities/char_2009.gif) :
:![[thin space (1/6-em)]](https://www.rsc.org/images/entities/char_2009.gif) B = 75
B = 75![[thin space (1/6-em)]](https://www.rsc.org/images/entities/char_2009.gif) :
:![[thin space (1/6-em)]](https://www.rsc.org/images/entities/char_2009.gif) 25) were applied as a mobile phase for isocratic elution with a flow rate of 1.0 mL min−1.55–57 The average recovery of standard addition was higher than 80%. These experiments were carried out using pure cultures of T2 immobilized on bagasse. All experiments and measurements were performed in triplicate and the arithmetic averages were taken for data analysis. The recoveries of SD at different concentrations can be found in Table S2.†
25) were applied as a mobile phase for isocratic elution with a flow rate of 1.0 mL min−1.55–57 The average recovery of standard addition was higher than 80%. These experiments were carried out using pure cultures of T2 immobilized on bagasse. All experiments and measurements were performed in triplicate and the arithmetic averages were taken for data analysis. The recoveries of SD at different concentrations can be found in Table S2.†
2.6 Sulfadiazine biodegradation experiments
2.6.1 Temperature. To facilitate the biodegradation process, strain T2 was appointed as the sole microorganism for subsequent experiments owing to its good growth status on bio-carriers. The initial environmental conditions were set at: 28 °C, pH 3.5, and 3.5 mL pure T2 bacterial suspensions (106 CFU mL−1). The colony forming unit (CFU mL−1) was determined using the pour-plate method. The SD contaminated soil (100 mg kg−1) and sugarcane bagasse were sterilized under UV conditions for 2 h, before being autoclaved at 121 °C for 20 min. The cell suspensions of T2 were adjusted to 106 CFU mL−1 and immobilized by homogenously mixing with mineral media and bagasse at ratio of 3.5![[thin space (1/6-em)]](https://www.rsc.org/images/entities/char_2009.gif) :
:![[thin space (1/6-em)]](https://www.rsc.org/images/entities/char_2009.gif) 7
7![[thin space (1/6-em)]](https://www.rsc.org/images/entities/char_2009.gif) :
:![[thin space (1/6-em)]](https://www.rsc.org/images/entities/char_2009.gif) 1. Cultivation was carried at 28 °C for 48 h until the biofilm was formed. Each microorganism-bagasse composite sample was fully mixed with 10 g soil spiked with 100 mg kg−1 of SD, sealed and incubated at 23, 28, 33, 38 and 43 °C. The amount of residue was determined after 5, 10, 15, 20, 25, and 30 d.
1. Cultivation was carried at 28 °C for 48 h until the biofilm was formed. Each microorganism-bagasse composite sample was fully mixed with 10 g soil spiked with 100 mg kg−1 of SD, sealed and incubated at 23, 28, 33, 38 and 43 °C. The amount of residue was determined after 5, 10, 15, 20, 25, and 30 d.
2.6.2 pH value. The pH values of the soil were adjusted to the series 2.5, 3.5, 4.5, 5.5 and 6.5, respectively. Immobilization of the pure strain and SD extraction were conducted in the similar procedures as previously mentioned. The concentrations of SD were measured at 5, 10, 15, 20, 25, and 30 d.
2.6.3 Inoculum biomass. Various volumes of pure T2 suspensions (5%, 10%, 15%, 20% and 25%) were seeded into 100 mL flasks containing 1 g of bagasse and 7 mL of mineral solution and incubated in the dark at 28 °C. Subsequent processes were conducted as mentioned previously.
2.6.4 Free and immobilized cells. Each flask containing 10 g of sample spiked with 100 mg kg−1 of SD was inoculated with 11 g of microorganism-bagasse composite and 11 mL of free T2 or Z3 cell suspensions and incubated in the dark at 28 °C. The concentrations of SD were determined under the same conditions as described above.
2.6.5 Heavy metals. Cd2+ and Pb2+ stock solutions were prepared using CdCl2 and PbCl2 in sterile deionized water and added to soil to make concentrations of 194.7 mg kg−1 and 119.3 mg kg−1, respectively. Samples without the presence of Cd2+ and Pb2+ were used as controls. The concentrations of SD were measured after culturing for 5, 10, 15, 20, 25 and 30 d, respectively.
2.7 Kinetic analysis of biodegradation
The kinetic data for ciprofloxacin (CIP) biodegradation were obtained under optimal conditions, and the mathematical relationship between CIP concentration and time was developed in the form of a pseudo first-order kinetic formula described as follows:
C = C0![[thin space (1/6-em)]](https://www.rsc.org/images/entities/char_2009.gif) e(−kt) e(−kt) |
In which C0 is the initial SD concentration (mg kg−1) and C is the time dependent SD concentration (mg kg−1), k is the degradation rate constant (mg kg−1 d−1), and t is the time point (d). The half-life was calculated via the following formula:
2.8 Identification of SD biodegradation metabolites
The SD biodegradation metabolites in the mineral medium were extracted separately with ethyl acetate and n-butanol three times. The organic fraction was combined and placed into a centrifuge at 5000 rpm for 10 min. The upper layer was transferred into a 250 mL round bottom flask and evaporated to dryness at 50 °C with nitrogen gas using a nitrogen blowing instrument. The residue was dissolved in ethyl acetate. The ethyl acetate phase was filtered through 0.22 μm syringe filters to remove the biomass and other particles and analyzed using ultra-high performance liquid chromatography-quadrupole time-of-flight (UPLC-Q-TOF). Detail data about the analysis of obtained metabolic products is shown in (ESI†). The intermediate compounds were tentatively identified according to the mass/charge values.
3 Results and discussion
3.1 Identification of microorganisms
Based on the 16S rDNA gene sequence analysis and ITS sequence analysis, pure SD-degrading strains were identified within the species of the bacterium Enterobacter cloacae (GenBank accession no. KU049659) and fungal entophyte (GenBank accession no. KR016777), which were further designated as T2 and Z3, respectively. The phylogenetic trees of T2 and Z3 were constructed using Mega X software. The phylogenetic tree and morphologies of strain T2 are shown in Fig. 1 and S2 (ESI†), respectively. For the identification of the unknown bacterium, biochemical tests such as the indole and methyl red tests were carried out. The results of the biochemical tests for strain T2 are presented in Table S1.† 60
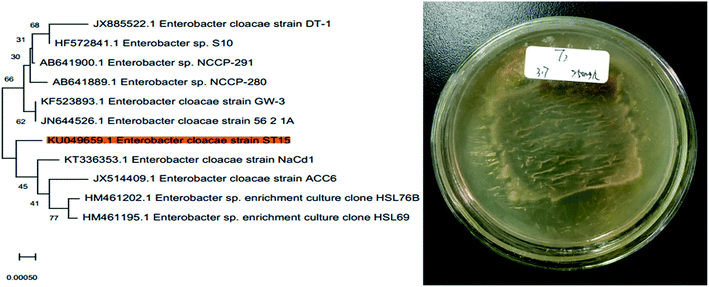 |
| | Fig. 1 Phylogenetic tree and morphology of strain T2. | |
3.2 Cell growth and optimum bio-carrier
The bacterial growth curve showed that the exponential phase of T2 occurred at the beginning of cultivation and entered a stationary phase after 36 h. For Z3, there was a significant lag phase from 6 to 18 h and an exponential phase from 24 to 56 h before it entered into a stationary phase after 56 h. It can be seen from Fig. 3 that T2 demonstrated faster growth rates, shorter lag phase periods, and higher cell concentrations than Z3. As shown in Fig. 2, strains T2 and Z3 were immobilized on the biomass materials bagasse, straw and peanuts, respectively. The results showed that the growth of strains T2 and Z3 was greatest on bagasse, followed by peanut and lastly straw. Bagasse, as an excellent biomaterial for immobilizing T2 and Z3, has the following advantages in comparison to other biomass carriers:61,62 the superb mechanical stability of bagasse makes it easier to maintain a high cell concentration; many carbohydrates such as glucose and xylose that are available on bagasse can serve as the carbon source during cultivation. The highly porous spatial structure of bagasse allows gas evolution which may cause disruption in the immobilization system.
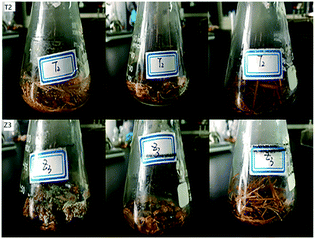 |
| | Fig. 2 T2 and Z3 on various bio-carriers. | |
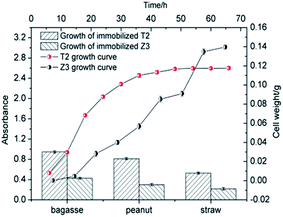 |
| | Fig. 3 T2 and Z3 growth and immobilization on various bio-carriers. | |
3.3 Factors affecting SD degradation
3.3.1 Temperature. The effect of temperature on the SD degradation performance was evaluated by increasing the temperature of the biological cabinet from 23 °C to 43 °C in increments of 5 °C. All error bars on the experimental data are shown and were calculated as the standard deviation of the mean (average SD concentration). Fig. 4 shows that the degradation of SD by immobilized T2 occurred over a range of temperatures. The SD degradation in soil was the lowest at 23 °C, peaked at 28 °C, and then gradually decreased with the increasing temperature. The SD degradation reached a maximum value of 78.19% at 28 °C. Lin et al. (2017)63 proposed that the growth and metabolism of most bacteria are generally optimal at 30 °C and most would not survive 60 °C. Temperature has a significant effect on biological processes.64 The effect of temperature on the enzymes involved in biodegradation resulted in different amount of SD degradation under various temperature treatments. A decrease in the degradation of SD at a cultivation temperature higher than 28 °C may affect the activity of some key enzymes responsible for SD biodegradation. Exposure to lower temperatures is expected to slow the rate of microbial activity. These results may indicate that the isolated SD-degrading strain could not tolerate thermophilic conditions and preferred mesophilic conditions. A temperature of 28 °C is designated as the optimal temperature for T2 growth, as well as SD biodegradation in this study. In addition, it can also be deduced from Fig. 4 that more significant dissipation of SD was observed under high temperatures (38 °C, 66.93%; 43 °C, 41.79%) in this study when comparing with the results obtained from previous studies,65,66 indicating that immobilization materials serve as favorable shelters for microorganism and enable them to survive extreme environmental conditions (pH, metal ions, temperature).35,67,68
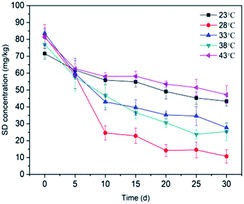 |
| | Fig. 4 Effect of temperature on SD degradation by T2. All error bars represent the standard deviation of the mean. | |
3.3.2 pH value. The effect of the pH value on SD degradation was also found to be significant, which could be attributed to the electrostatic interaction between SD and the cell membrane, as well as its hydrolysis under acidic conditions.69 The SD degradation after 30 d of cultivation at varying pH values (2.5, 3.5, 4.5, 5.5 and 6.5) by immobilized T2 on bagasse is shown in Fig. 5. The amounts of degradation of SD at different pH values were 53.19% (pH 2.5), 78.19% (pH 3.5), 61.89% (pH 4.5), 57.83% (pH 5.5) and 54.71% (pH 6.5). The results show that the degradation rate reached a maximum value at pH 3.5 and declined significantly at around pH 4.5–6.5. Previous studies indicated that the hydrolysis of sulfonamides occurs in acidic conditions through bond breaking to produce sulfanilic acid, which may accelerate the biodegradation process.70 The lowest degradation rate was observed at pH 2.5. Too low pH values were able to kill the microbes, leading to a decrease of biodegradation.71 It is widely believed that the cell surface is generally negatively charged owing to the wide presence of polyanions in the membrane.72 When the pH ranges from 4.5 to 6.5, the majority of SD was neutrally charged, while the percentage of anionic SD climbed with the increase in the pH.73 Thus, there would be an increasing repulsive interaction between SD and the immobilized cell, which resulted in a significant decrease in the SD biodegradation.74 Based on the obtained results, slightly acidic pH values are favorable for SD degradation.
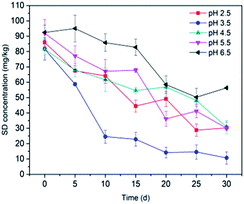 |
| | Fig. 5 Effect of pH on SD degradation by T2. All error bars represent the standard deviation of the mean. | |
3.3.3 Inoculum biomass. In order to illustrate the association between bacteria biomass and SD degradation, batch experiments were conducted under different volumes of bacterial suspension (5%, 10%, 15%, 20% and 25%). Fig. 6 reveals that the degradation of SD is proportional to the bacterial biomass between 5% to 15%, and then decreases with the increasing biomass. The residual SD concentration in soil reached a minimum value at treatment with a 15% cell suspension. It is acknowledged that a high biomass could result in rapid consumption of energy sources and retention of metabolic waste, which may lead to a significant inhibition on cell growth.75,76 Contrary to this, lower bacterial biomass may lead to the decline of the ability of the bacterium to adapt to the environment, thus posing inhibition to the growth of the microorganism.
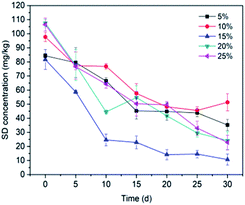 |
| | Fig. 6 Effect of inoculum biomass on SD degradation by T2. All error bars represent the standard deviation of the mean. | |
3.3.4 Free and immobilized cells. Immobilization is defined as the confinement of the microbial cells to certain regions with the preservation of some desired catalytic activity and their viability.35 Fig. 7 shows that immobilized T2 is able to degrade almost 80% of SD within 30 d, while free living T2 degraded a significantly lower amount (around 6%) of the SD. In the batch experiments, SD-degrading strains of T2 immobilized on sugarcane bagasse showed a higher SD degradation efficiency compared to that of free living cells. Similar trends could also be found in immobilized Z3. In contrast to the free living cells, immobilized cells better tolerate SD at a concentration of 100 mg kg−1. Lin et al. showed that immobilized A. venetianus can survive in difficult conditions despite being polluted by heavy metals and PAHs and exhibited an excellent degradation efficiency. Ruan et al. (2018)77 found that immobilized Sphingomonas spp. showed a higher rate of phenol degradation (16.79 ± 0.81 mg (L−1 h−1)) than freely suspended cells (11.49 ± 1.29 mg (L−1 h−1)).
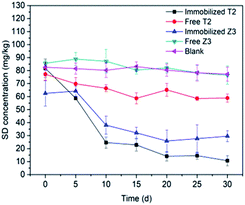 |
| | Fig. 7 SD degradation by free living cells and immobilized cells. All error bars represent the standard deviation of the mean. | |
3.3.5 Heavy metals. Microorganisms in the soil environment are typically simultaneously exposed to a variety of pollutants, such as heavy metals.78 At present, sites are commonly co-contaminated with heavy metals and organic compounds, which may cause a more complicated issue for their synergistic effect on ecotoxicity.79,80 The degradation rates obtained during experiments carried out in the presence of different heavy metal ions (Pb2+ and Cd2+) are depicted in Fig. 8. In comparison to the control group, decreases in the degradation rate have been observed in the presence of Pb2+ and Cd2+ in soil. The inhibitory effect of Pb2+ on SD degradation (53.20%) performance was more significant than Cd2+ treatment (75.70%). The significant difference between Pb2+ and Cd2+ may be related to the low Cd2+ concentration in the soil. Some studies have demonstrated that the toxicity of heavy metals is attributed to the inhibition of enzyme function and disruption of its structure by binding of the metals by thiol and other groups on the enzyme molecules.81 Tiwary and Dubey (2016)82 found that there was a significant inhibition (about 40%) in the biodegradation of Cypermethrin by free strain Bacillus sp. AKD1 in the presence of 7.0 mM kg−1 Li2+. Jiang et al. (2015)83 investigated the combined remediation of Cd–phenanthrene co-contaminated soil by Bacillus thuringiensis FQ1. The results showed that the concentration of phenanthrene decreased by 94.16% at 200 mg kg−1, but the figure rapidly declined to 76.15% when the treatment was spiked with 20 mg kg−1 Cd. It can be concluded that the immobilization system has the ability to protect microorganisms against adverse environmental conditions such as heavy metals.
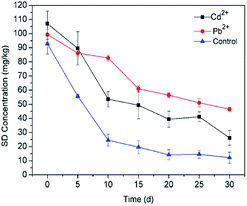 |
| | Fig. 8 Effect of heavy metal ions on SD degradation by T2. All error bars represent the standard deviation of the mean. | |
3.4 Kinetic analysis
A high correlation coefficient (0.90345) implied that there is a good correlation between the predicted and the actual values. The obtained k value and t1/2 in this study were 0.04719 mg kg−1 d−1 and 14.68 mg kg−1 d−1. Previous studies84–86 have reported the degradation kinetics of sulfonamides in soil environments by microorganisms. The higher degradation constant and lower half-life value compared to those obtained by Yang et al. (k = 0.0389 mg kg−1 d−1, t1/2 = 18 d) suggests that immobilized FQ-XX1 has a significant SD degradation capacity. In addition, Zhang et al. (2017)85 confirmed that the introduction of manure to soil would accelerate the SD biodegradation in soil (k = 0.0817 mg kg−1 d−1, t1/2 = 8.48 d) (Fig. 9).
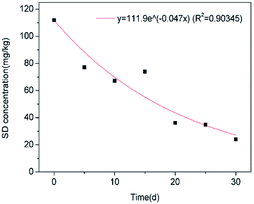 |
| | Fig. 9 Kinetic modeling for SD biodegradation. | |
3.5 Proposed biodegradation pathway of SD
Many recent studies have been reported regarding the SD degradation pathway. According to Dong et al. (2019)87, mono-hydroxylated sulfadiazine (m/z = 267) was confirmed to be the major degradation product on the basis of chromatogram analysis. Feng et al. (2016)88 proposed four possible pathways of sulfadiazine degradation, including SD hydroxylation, SO2 extrusion, cleavage of the S–N bond and cleavage of the C–N bond, on the basis of ten products. Similar pathways were also proposed in other studies.89 The formula, chemical structure and mass/charge (m/z) are included in Table 2. According to the detected mass/charge rate of the degradation intermediates and previous study results, we proposed five degradation pathways for SD in this study. The SD biodegradation metabolic products were identified using UPLC-Q-TOF and the proposed degradation pathways are displayed in Fig. 10. The principal biodegradation products at m/z of 183 were found in several peaks at the retention time with a high signal intensity. Further information based on the MS2 fragments and previous research proved that the ions at m/z of 283 were X,X-dihydroxy-SD (compound 1) and its structural isomers. The reaction of ·OH with SD may be responsible for the formation of compound 1 and its isomers during the biodegradation process in this research. According to Yadav et al. (2018), SD can easily be attacked by the ·OH radical because of its electrophilic property and high redox potential. This theory could also be applied to illustrate the formation of 4-hydroxy-SD (compound 4). The bond cleavage of compound 1 between the sulfonic group and the aniline ring resulted in the formation of X,X-dihydroxy-aniline (compound 6), followed by its transformation into X-hydroxy-phenol (compound 7). Compound 4 was further converted into vinylpyruvic acid through an open-loop reaction of the benzene ring. The ion at a m/z of 293 was identified as N4-acetyl-SD (compound 2), which was suggested as an acetylation product of SD on the basis of the MS2 data and previous results.34 Previous research90 has shown that formylation and acetylation were proposed as the main reactions during the sulfonamides biodegradation process. The acetamidphenol (compound 10) was generated by the desulphurization of N4-acetyl-x-hydroxy-SD (compound 9), and subsequently transformed into N-phenylacetamide (compound 11). In addition, SD could be decomposed into compound 5 by the breakdown of the pyridine ring. To the best of our knowledge, compound 5 has not yet been analytically confirmed in other research. Therefore, we could attribute the main biodegradation mechanism of SD to substitution by ·OH radicals and acetylation (Fig. 11).
Table 2 Proposed formula of degradation products
| Proposed formula |
Mass |
Significant ion m/z |
Metabolite |
| C10H10N4O2S |
250.0543 |
251.062 |
SD |
| C10H10N4O4S |
282.04228 |
283.0492 |
X,X-Dihydroxy-SD |
| C12H12N4O3S |
292.06313 |
293.0705 |
N4-Acetyl-SD |
| C10H10N4O3S |
266.04749 |
267.0547 |
X-Hydroxy-SD |
| C10H12N2O5S |
272.04685 |
273.0541 |
SD1 |
| C10H9N3O3S |
251.03646 |
252.0439 |
4-Hydroxy-SD |
| C12H12N4O4S |
308.05766 |
309.0648 |
N4-Acetyl-x-hydroxy-SD |
| C6H7NO2 |
125.04761 |
126.0548 |
X,X-Dihydroxy-aniline |
| C6H6O2 |
110.03686 |
111.0441 |
X-Hydroxy-phenol |
| C5H6O3 |
114.03181 |
115.0389 |
Vinylpyruvic acid |
| C8H9NO2 |
151.06315 |
152.0704 |
Acetamidphenol |
| C8H9NO |
135.06873 |
136.0757 |
N-Phenylacetamide |
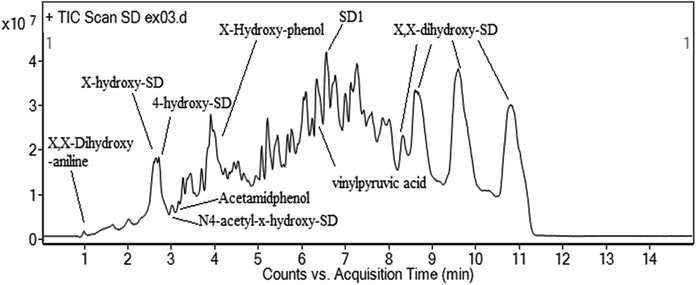 |
| | Fig. 10 MS spectrum of SD intermediates by UPLC-Q-TOF. | |
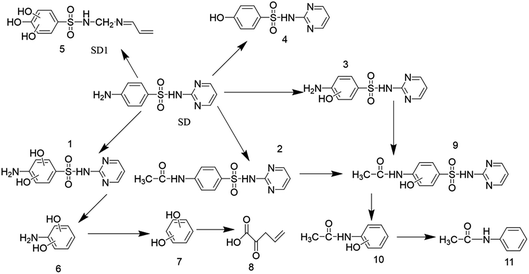 |
| | Fig. 11 Proposed SD degradation pathway. | |
4 Conclusion
In this study, two pure strains with SD degradation potential, namely T2 and Z3, were isolated from manure and identified as Enterobacter cloacae and fungal entophyte after being commercially sequenced. After batch growth tests, strain T2 and bagasse were designated as the optimal microorganisms and immobilization material, subsequently being introduced into SD biodegradation tests. The effects of experimental factors (pH, temperature, inoculum dose) on SD dissipation were investigated and the optimal conditions were determined to be 28 °C, pH 3.5, and a 15% inoculum dose with SD removal at 78.19%. In comparison to free living cells, immobilized cells significantly enhance SD degradation efficiency within 30 d, which can be illustrated by the theory that the presence of the bio-carrier promotes microorganism growth. A slight decrease (13.10%) in the SD removal was observed in soil spiked with 119.3 mg kg−1 Cd in comparison to the control group, indicating that bagasse offers a stable microenvironment to the microorganism, thereby weakening the negative effects resulting from metal ions. The kinetic data fitted well with a pseudo first-order kinetic formula. A plausible degradation pathway involving a series of acetylation, hydroxylation and breakdown of benzene rings occurring in the SD molecule was proposed according to the Q-TOF analysis. Bagasse, as a degradable biosorbent, was utilized as an immobilization material for SD bioremediation in soil. A high degradation efficiency, low cost and ease of operation make the bagasse-microorganism immobilization system a promising method when referring to soil remediation.
Conflicts of interest
There are no conflicts of interest to declare.
Acknowledgements
This project was supported by the Science and Technology Planning Project of Guangdong Province of China (No. 2015A020209125 and 2017A020208047). We especially thank Dr Sally Gadsdon for the language revision of this manuscript.
References
- E. Y. Klein, T. P. Van Boeckel, E. M. Martinez, S. Pant, S. Gandra, S. A. Levin, H. Goossens and R. Laxminarayan, Proc. Natl. Acad. Sci. U. S. A., 2018, 201717295 Search PubMed.
- S. Summa, M. S. Lo, A. Armentano and M. Muscarella, Food Chem., 2015, 187, 477 CrossRef CAS PubMed.
- J. Tolls, Environ. Sci. Technol., 2001, 35, 3397–3406 CrossRef CAS PubMed.
- F. Liu, G.-G. Ying, J.-F. Yang, L.-J. Zhou, R. Tao, L. Wang, L.-J. Zhang and P.-A. Peng, Environ. Chem., 2010, 7, 370–376 CrossRef CAS.
- E. Z. Harrison, S. R. Oakes, M. Hysell and A. Hay, Sci. Total Environ., 2006, 367, 481–497 CrossRef CAS PubMed.
- L. Yang, L. Wu, W. Liu, Y. Huang and P. Christie, Environ. Sci. Pollut. Res., 2016, 25, 104–114 CrossRef PubMed.
- J. C. Duran-Alvarez, B. Prado-Pano and B. Jimenez-Cisneros, Chemosphere, 2012, 88, 84–90 CrossRef CAS PubMed.
- M. Pan and L. M. Chu, Sci. Total Environ., 2016, 545–546, 48–56 CrossRef CAS PubMed.
- A. Spielmeyer, H. Höper and G. Hamscher, Chemosphere, 2017, 177, 232–238 CrossRef CAS PubMed.
- J. Rossmann, S. Schubert, R. Gurke, R. Oertel and W. Kirch, J. Chromatogr. B, 2014, 969, 162–170 CrossRef CAS PubMed.
- M. Gbylik-Sikorska, A. Posyniak, T. Sniegocki and J. Zmudzki, Chemosphere, 2015, 119, 8–15 CrossRef CAS PubMed.
- C. L. Chitescu, G. Kaklamanos, A. I. Nicolau and A. A. M. Stolker, Sci. Total Environ., 2015, 532, 501–511 CrossRef CAS.
- D. Quoc Tuc, F. Alliot, E. Moreau-Guigon, J. Eurin, M. Chevreuil and P. Labadie, Talanta, 2011, 85, 1238–1245 CrossRef PubMed.
- S. Huntscha, H. P. Singer, C. S. McArdell, C. E. Frank and J. Hollender, J. Chromatogr. B: Anal. Technol. Biomed. Life Sci., 2012, 1268, 74–83 CrossRef CAS.
- Y. Cabeza, L. Candela, D. Ronen and G. Teijon, J. Hazard. Mater., 2012, 239, 32–39 CrossRef PubMed.
- I. T. Carvalho and L. Santos, Environ. Int., 2016, 94, 736–757 CrossRef PubMed.
- X. Ji, Q. Shen, F. Liu, J. Ma, G. Xu, Y. Wang and M. Wu, J. Hazard. Mater., 2012, 235–236, 178–185 CrossRef CAS PubMed.
- M. Qiao, G. G. Ying, A. C. Singer and Y. G. Zhu, Environ. Int., 2018, 110, 160–172 CrossRef CAS PubMed.
- X. Hu, Q. Zhou and Y. Luo, Environ. Pollut., 2010, 158, 2992–2998 CrossRef CAS PubMed.
- J. Hou, W. Wan, D. Mao, C. Wang, Q. Mu, S. Qin and Y. Luo, Environ. Sci. Pollut. Res., 2015, 22, 4545–4554 CrossRef CAS PubMed.
- V. Economou and P. Gousia, Infect. Drug Resist., 2015, 8, 49–61 CrossRef CAS PubMed.
- A. Giles, J. Foushee, E. Lantz and G. Gumina, Pharmacy, 2019, 7, 3 CrossRef PubMed.
- T. J. W. Rennie, N. De Souza, P. T. Donnan, C. A. Marwick, P. Davey, T. Dreischulte and S. Bell, Nephrol., Dial., Transplant., 2019, 34, 1910–1916 CrossRef PubMed.
- P. Shihui, Y. Ning, L. Xinyue, W. Wenbing, Z. Yongming, L. Rui and B. E. Rittmann, Biodegradation, 2014, 25, 911–921 CrossRef PubMed.
- M. Yadav, N. Neghi, M. Kumar and G. K. Varghese, J. Environ. Manage., 2018, 222, 164–173 CrossRef CAS PubMed.
- T. Wolfgang, H. Michael, H. Diana, K. Stephan, K. Sirgit, T. Björn and G. Joost, Appl. Environ. Microbiol., 2013, 79, 2572–2577 CrossRef PubMed.
- N. Malesic-Eleftheriadou, E. N. Evgenidou, G. Z. Kyzas, D. N. Bikiaris and D. A. Lambropoulou, Chemosphere, 2019, 234, 746–755 CrossRef CAS PubMed.
- M. B. Ahmed, J. L. Zhou, H. H. Ngo, W. Guo, M. A. H. Johir and D. Belhaj, Bioresour. Technol., 2017, 238, 306–312 CrossRef CAS PubMed.
- M. J. G. Galán and M. S. Díaz-Cruz, Anal. Bioanal. Chem., 2012, 404, 1505–1515 CrossRef PubMed.
- W. Zhao, Q. Sui, X. Mei and X. Cheng, Sci. Total Environ., 2018, 633, 668–676 CrossRef CAS PubMed.
- E. Muller, W. Schussler, H. Horn and H. Lemmer, Chemosphere, 2013, 92, 969–978 CrossRef CAS PubMed.
- N. Yang, J. F. Wan, S. J. Zhao and Y. Wang, PeerJ, 2015, 3, 15 Search PubMed.
- I. A. Vasiliadou, R. Molina, F. Martínez and J. A. Melero, Biochem. Eng. J., 2013, 81, 108–119 CrossRef CAS.
- J. Chen and S. Xie, Sci. Total Environ., 2018, 640–641, 1465–1477 CrossRef CAS PubMed.
- A. Dzionek, D. Wojcieszyńska and U. Guzik, Electron. J. Biotechnol., 2016, 23, 28–36 CrossRef CAS.
- C. Ma, D. Qin, Q. Sun, F. Zhang, H. Liu and C. P. Yu, Chemosphere, 2016, 144, 607–614 CrossRef CAS PubMed.
- H. Zhuang, H. Han, P. Xu, B. Hou, S. Jia, D. Wang and K. Li, Biochem. Eng. J., 2015, 99, 44–47 CrossRef CAS.
- P. Rashmi, U. Shivani and J. P. N. Rai, Environ. Sci. Pollut. Res., 2015, 22, 1–12 CrossRef PubMed.
- J. Lin, L. Gan, Z. Chen and R. Naidu, Biochem. Eng. J., 2015, 100, 76–82 CrossRef CAS.
- B. Basak, B. Bhunia and A. Dey, Int. Biodeterior. Biodegrad., 2014, 93, 107–117 CrossRef CAS.
- J. Liu, S. Chen, J. Ding, Y. Xiao, H. Han and G. Zhong, Appl. Microbiol. Biotechnol., 2015, 99, 10839–10851 CrossRef CAS PubMed.
- J. C. Santos, Í. R. G. Pinto, W. Carvalho, I. M. Mancilha, M. G. A. Felipe and S. S. Silva, Sugarcane Bagasse as Raw Material and Immobilization Support for Xylitol Production, Humana Press, 2005 Search PubMed.
- S. Hu, H. Hu, W. Li, Y. Ke, M. Li and Y. Zhao, RSC Adv., 2017, 7, 55240–55248 RSC.
- P. Chakraborty, R. K. Sarker, R. Roy, A. Ghosh, D. Maiti and P. Tribedi, 3 Biotech, 2019, 9, 10 CrossRef PubMed.
- Y. Zhu, W. Zhang, S. Schwarz, C. Wang, W. Liu, F. Chen, T. Luan and S. Liu, J. Antimicrob. Chemother., 2019, 74, 1799–1806 CrossRef PubMed.
- T. Chen, C. Li, J. F. White and Z. Nan, Plant Soil, 2019, 436, 29–48 CrossRef CAS.
- F. Mao, X. Liu, K. Wu, C. Zhou and Y. Si, Biodegradation, 2018, 29, 1–12 CrossRef PubMed.
- W. G. S. Weisburg, S. M. Barns, D. A. Pelletier and D. J. Lane, J. Bacteriol., 1991, 173, 697–703 CrossRef CAS PubMed.
- D. J. Lane, B. Pace, G. J. Olsen, D. A. Stahl, M. L. Sogin and N. R. Pace, Proc. Natl. Acad. Sci. U. S. A., 1985, 82, 6955–6959 CrossRef CAS PubMed.
- E. C. Böttger, FEMS Microbiol. Lett., 1989, 65, 171–176 CrossRef.
- R. Saiki, D. Gelfand, S. Stoffel, S. Scharf, R. Higuchi, G. Horn, K. Mullis and H. Erlich, Science, 1988, 239, 487–491 CrossRef.
- U. Edwards, T. Rogall, H. Blocker, M. Emde and E. C. Bottger, Nucleic Acids Res., 1989, 17, 7843–7853 CrossRef CAS PubMed.
- M. Gardes and T. D. Bruns, Methods Mol. Biol., 1996, 50, 177–186 CAS.
- S. I. Mulla, A. Hu, Q. Sun, J. Li, F. Suanon, M. Ashfaq and C. P. Yu, J. Environ. Manage., 2017, 206, 93–102 CrossRef PubMed.
- J. Raich-Montiu, J. L. Beltrán, M. D. Prat and M. Granados, Anal. Bioanal. Chem., 2010, 397, 807–814 CrossRef CAS PubMed.
- A. Spielmeyer, J. Ahlborn and G. Hamscher, Anal. Bioanal. Chem., 2014, 406, 2513–2524 CrossRef CAS PubMed.
- X. Yu, H. Liu, C. Pu, J. Chen, Y. Sun and L. Hu, J. Sep. Sci., 2018, 41, 713–722 CrossRef CAS.
- T. L. T. Laak, W. A. Gebbink and J. Tolls, Environ. Toxicol. Chem., 2006, 25, 904–911 CrossRef PubMed.
- A. M. Jacobsen, B. Halling-Sørensen, F. Ingerslev and S. H. Hansen, J. Chromatogr. B: Anal. Technol. Biomed. Life Sci., 2004, 1038, 157–170 CrossRef CAS PubMed.
- B. Jiang, A. Li, D. Cui, R. Cai, F. Ma and Y. Wang, Appl. Microbiol. Biotechnol., 2014, 98, 4671–4681 CrossRef CAS PubMed.
- Y. Xu and M. Lu, J. Hazard. Mater., 2010, 183, 395–401 CrossRef CAS PubMed.
- M. Hazaimeh, S. A. Mutalib, P. S. Abdullah, W. K. Kee and S. Surif, Ann. Microbiol., 2014, 64, 1769–1777 CrossRef CAS.
- H. Lin, J. Zhang, H. Chen, J. Wang, W. Sun, X. Zhang, Y. Yang, Q. Wang and J. Ma, Sci. Total Environ., 2017, 607–608, 725–732 CrossRef CAS PubMed.
- E. Adamek, W. Baran and A. Sobczak, J. Hazard. Mater., 2016, 313, 147–158 CrossRef CAS PubMed.
- W. Zhang, D. Xu, Z. Niu, K. Yin, P. Liu and L. Chen, Biodegradation, 2012, 23, 431–439 CrossRef CAS PubMed.
- M. Huang, S. Tian, D. Chen, W. Zhang, J. Wu and L. Chen, J. Environ. Sci., 2012, 24, 1594–1599 CrossRef CAS.
- S. A. Ahmad, N. A. Shamaan, N. M. Arif, B. K. Gan, M. Y. A. Shukor and M. A. Syed, World J. Microbiol. Biotechnol., 2012, 28, 347–352 CrossRef CAS PubMed.
- A. Banerjee and A. K. Ghoshal, Int. Biodeterior. Biodegrad., 2011, 65, 1052–1060 CrossRef CAS.
- L.-j. Pan, X.-d. Tang, C.-x. Li, G.-w. Yu and Y. Wang, World J. Microbiol. Biotechnol., 2017, 33, 85 CrossRef PubMed.
- P. Sukul and M. Spiteller, Sulfonamides in the Environment as Veterinary Drugs, Springer, New York, 2006 Search PubMed.
- F. Ríos, M. Lechuga, M. Fernández-Serrano and A. Fernández-Arteaga, Chemosphere, 2017, 171, 324–331 CrossRef PubMed.
- I. W. Sutherland, Microbiology, 2001, 147, 3–9 CrossRef CAS.
- B. Chu, K. W. Goyne, S. H. Anderson, C. H. Lin and R. N. Lerch, J. Environ. Qual., 2013, 42, 794–805 CrossRef CAS PubMed.
- K. Muda, A. Aris, M. R. Salim, Z. Ibrahim, M. C. M. V. Loosdrecht, M. Z. Nawahwi and A. C. Affam, Int. Biodeterior. Biodegrad., 2014, 93, 202–209 CrossRef CAS.
- H. J. Jia and Q. Y. Yuan, Biodegradation, 2018, 29, 105–115 CrossRef CAS PubMed.
- J. Krishnan, A. A. Kishore, A. Suresh, B. Madhumeetha and D. G. Prakash, Int. Biodeterior. Biodegrad., 2017, 119, 16–27 CrossRef CAS.
- B. Ruan, P. X. Wu, M. Q. Chen, X. L. Lai, L. Y. Chen, L. F. Yu, B. N. Gong, C. X. Kang, Z. Dang, Z. Q. Shi and Z. H. Liu, Ecotoxicol. Environ. Saf., 2018, 162, 103–111 CrossRef CAS PubMed.
- A. O. Olaniran, A. Balgobind and B. Pillay, Int. J. Mol. Sci., 2013, 14, 10197–10228 CrossRef.
- X. Li, A. Y. Chen, Y. Wu, L. Wu, L. Xiang, H. M. Zhao, Q. Y. Cai, Y. W. Li, C. H. Mo and H. W. Ming, Sci. Total Environ., 2018, 634, 417–426 CrossRef CAS.
- C. Long, G. P. Fan, D. M. Zhou and Q. Y. Wang, Chemosphere, 2013, 90, 2326–2331 CrossRef PubMed.
- K. P. Gopinath, M. N. Kathiravan, R. Srinivasan and S. Sankaranarayanan, Bioresour. Technol., 2011, 102, 3687–3693 CrossRef CAS PubMed.
- M. Tiwary and A. K. Dubey, Int. Biodeterior. Biodegrad., 2016, 108, 42–47 CrossRef CAS.
- J. Jiang, H. Liu, Q. Li, N. Gao, Y. Yao and H. Xu, Ecotoxicol. Environ. Saf., 2015, 120, 386–393 CrossRef CAS PubMed.
- J. F. Yang, G. G. Ying, L. H. Yang, J. L. Zhao and P. A. Peng, J. Environ. Sci. Health, Part B, 2009, 44, 241–248 CrossRef CAS.
- Y. Zhang, S. Hu, H. Zhang, G. Shen, Z. Yuan and W. Zhang, Sci. Total Environ., 2017, 607–608, 1348 CrossRef CAS PubMed.
- K. Lin and J. Gan, Chemosphere, 2011, 83, 240–246 CrossRef CAS PubMed.
- Y. Dong, X. Cui, X. Lu, X. Jian, Q. Xu and C. Tan, Sci. Total Environ., 2019, 662, 490–500 CrossRef CAS.
- Y. Feng, D. Wu, Y. Deng, T. Zhang and K. Shih, Environ. Sci. Technol., 2016, 50, 3119–3127 CrossRef CAS PubMed.
- N. Katherine, Z. Xia and A. T. Lemley, J. Agric. Food Chem., 2010, 58, 1068 CrossRef PubMed.
- M. Majewsky, T. Glauner and H. Horn, Anal. Bioanal. Chem., 2015, 407, 5707–5717 CrossRef CAS PubMed.
Footnote |
| † Electronic supplementary information (ESI) available. See DOI: 10.1039/c9ra07302g |
|
| This journal is © The Royal Society of Chemistry 2020 |
Click here to see how this site uses Cookies. View our privacy policy here.  Open Access Article
 *
*
![[thin space (1/6-em)]](https://www.rsc.org/images/entities/char_2009.gif) :
:![[thin space (1/6-em)]](https://www.rsc.org/images/entities/char_2009.gif) 1). The buffer solution was prepared by mixing 21.0 g of citric acid and 20.4 g of MgCl2 per liter. After that, the mixture was transferred into two 50 mL centrifuge tubes equally and agitated in a horizontal shaker at 120 rpm for 5 min. The mixture was subsequently placed into an ultrasonic bath for 15 min followed by centrifuging at 4500 rpm for 10 min. The above described processes were performed in triplicate. The supernatant was combined and transferred into a 250 mL round bottom flask. The resulting supernatant volume was reduced under vacuum using rotary evaporation. The supernatant was adjusted to 20 mL with methanol–water (3
1). The buffer solution was prepared by mixing 21.0 g of citric acid and 20.4 g of MgCl2 per liter. After that, the mixture was transferred into two 50 mL centrifuge tubes equally and agitated in a horizontal shaker at 120 rpm for 5 min. The mixture was subsequently placed into an ultrasonic bath for 15 min followed by centrifuging at 4500 rpm for 10 min. The above described processes were performed in triplicate. The supernatant was combined and transferred into a 250 mL round bottom flask. The resulting supernatant volume was reduced under vacuum using rotary evaporation. The supernatant was adjusted to 20 mL with methanol–water (3![[thin space (1/6-em)]](https://www.rsc.org/images/entities/char_2009.gif) :
:![[thin space (1/6-em)]](https://www.rsc.org/images/entities/char_2009.gif) 2) and filtered through 0.22 μm syringe filters for analysis using high performance liquid chromatography (HPLC).55–59 The SD concentrations were detected by a HPLC (Agilent 1100) equipped with a UV detector at 267 nm and a ZORBAX Eclipse XDB-C18 column (4.6 × 250 mm, 5 μm). The column temperature was 25 °C and the injection volume was 20 μL. For separation, ultrapure water containing 0.3 acetic acid (A) and acetonitrile (B) (A
2) and filtered through 0.22 μm syringe filters for analysis using high performance liquid chromatography (HPLC).55–59 The SD concentrations were detected by a HPLC (Agilent 1100) equipped with a UV detector at 267 nm and a ZORBAX Eclipse XDB-C18 column (4.6 × 250 mm, 5 μm). The column temperature was 25 °C and the injection volume was 20 μL. For separation, ultrapure water containing 0.3 acetic acid (A) and acetonitrile (B) (A![[thin space (1/6-em)]](https://www.rsc.org/images/entities/char_2009.gif) :
:![[thin space (1/6-em)]](https://www.rsc.org/images/entities/char_2009.gif) B = 75
B = 75![[thin space (1/6-em)]](https://www.rsc.org/images/entities/char_2009.gif) :
:![[thin space (1/6-em)]](https://www.rsc.org/images/entities/char_2009.gif) 25) were applied as a mobile phase for isocratic elution with a flow rate of 1.0 mL min−1.55–57 The average recovery of standard addition was higher than 80%. These experiments were carried out using pure cultures of T2 immobilized on bagasse. All experiments and measurements were performed in triplicate and the arithmetic averages were taken for data analysis. The recoveries of SD at different concentrations can be found in Table S2.†
25) were applied as a mobile phase for isocratic elution with a flow rate of 1.0 mL min−1.55–57 The average recovery of standard addition was higher than 80%. These experiments were carried out using pure cultures of T2 immobilized on bagasse. All experiments and measurements were performed in triplicate and the arithmetic averages were taken for data analysis. The recoveries of SD at different concentrations can be found in Table S2.†
![[thin space (1/6-em)]](https://www.rsc.org/images/entities/char_2009.gif) :
:![[thin space (1/6-em)]](https://www.rsc.org/images/entities/char_2009.gif) 7
7![[thin space (1/6-em)]](https://www.rsc.org/images/entities/char_2009.gif) :
:![[thin space (1/6-em)]](https://www.rsc.org/images/entities/char_2009.gif) 1. Cultivation was carried at 28 °C for 48 h until the biofilm was formed. Each microorganism-bagasse composite sample was fully mixed with 10 g soil spiked with 100 mg kg−1 of SD, sealed and incubated at 23, 28, 33, 38 and 43 °C. The amount of residue was determined after 5, 10, 15, 20, 25, and 30 d.
1. Cultivation was carried at 28 °C for 48 h until the biofilm was formed. Each microorganism-bagasse composite sample was fully mixed with 10 g soil spiked with 100 mg kg−1 of SD, sealed and incubated at 23, 28, 33, 38 and 43 °C. The amount of residue was determined after 5, 10, 15, 20, 25, and 30 d.![[thin space (1/6-em)]](https://www.rsc.org/images/entities/char_2009.gif) e(−kt)
e(−kt)


