 Open Access Article
A novel drug–drug coamorphous system without molecular interactions: improve the physicochemical properties of tadalafil and repaglinide†
Meiling Su‡
a,
Yanming Xia‡b,
Yajing Shenb,
Weili Henga,
Yuanfeng Weib,
Linghe Zhangc,
Yuan Gaob,
Jianjun Zhang*a and
Shuai Qian *b
*b
aSchool of Pharmacy, China Pharmaceutical University, Nanjing, 211198, P. R. China. E-mail: amicute@163.com; Fax: +86 25 83379418; Tel: +86 25 83379418
bSchool of Traditional Chinese Pharmacy, China Pharmaceutical University, Nanjing, 211198, P. R. China. E-mail: silence_qs@163.com; Tel: +86 139 1595 7175
cDepartment of Chemistry, Smith College, Northampton, MA 01063, USA
First published on 2nd January 2020
Abstract
Tadalafil and repaglinide, categorized as BCS class II drugs, have low oral bioavailabilities due to their poorly aqueous solubilities and dissolutions. The aim of this study was to enhance the dissolution of tadalafil and repaglinide by co-amorphization technology and evaluate the storage and compression stability of such coamorphous system. Based on Flory–Huggins interaction parameter (χ ≤ 0) and Hansen solubility parameter (δt ≤ 7 MPa0.5) calculations, tadalafil and repaglinide was predicted to be well miscible with each other. Coamorphous tadalafil–repaglinide (molar ratio, 1![[thin space (1/6-em)]](https://www.rsc.org/images/entities/char_2009.gif) :
:![[thin space (1/6-em)]](https://www.rsc.org/images/entities/char_2009.gif) 1) was prepared by solvent-evaporation method and characterized with respect to its thermal properties, possible molecular interactions. A single Tg (73.1 °C) observed in DSC and disappearance of crystallinity in PXRD indicated the formation of coamorphous system. Principal component analysis of FTIR in combination with Raman spectroscopy and Ss 13C NMR suggested the absence of intermolecular interactions in coamorphous tadalafil–repaglinide. In comparison to pure crystalline forms and their physical mixtures, both drugs in coamorphous system exhibited significant increases in intrinsic dissolution rate (1.5–3-fold) and could maintain supersaturated level for at least 4 hours in non-sink dissolution. In addition, the coamorphous tadalafil–repaglinide showed improved stability compared to the pure amorphous forms under long-term stability and accelerated storage conditions as well as under high compressing pressure. In conclusion, this study showed that co-amorphization technique is a promising approach for improving the dissolution rate of poorly water-soluble drugs and for stabilizing amorphous drugs.
1) was prepared by solvent-evaporation method and characterized with respect to its thermal properties, possible molecular interactions. A single Tg (73.1 °C) observed in DSC and disappearance of crystallinity in PXRD indicated the formation of coamorphous system. Principal component analysis of FTIR in combination with Raman spectroscopy and Ss 13C NMR suggested the absence of intermolecular interactions in coamorphous tadalafil–repaglinide. In comparison to pure crystalline forms and their physical mixtures, both drugs in coamorphous system exhibited significant increases in intrinsic dissolution rate (1.5–3-fold) and could maintain supersaturated level for at least 4 hours in non-sink dissolution. In addition, the coamorphous tadalafil–repaglinide showed improved stability compared to the pure amorphous forms under long-term stability and accelerated storage conditions as well as under high compressing pressure. In conclusion, this study showed that co-amorphization technique is a promising approach for improving the dissolution rate of poorly water-soluble drugs and for stabilizing amorphous drugs.
1. Introduction
With about 40% of marketed drugs and 75% of drug candidates in high-throughput drug testing platforms regarded as poorly soluble in water, which is associated with various formulation-related performance issues,1 improving the bioavailability of these drugs by solubility/dissolution enhancement has raised widespread concern in the pharmaceutical industry.2 One of the effective strategies is to convert crystalline drugs (especially BCS class II and IV drugs) to their respective amorphous forms, in order to improve their solubility/dissolution and hence bioavailability/efficacy.3–5 However, amorphous systems are thermodynamically unstable due to their high Gibbs energy and tend to recrystallize during manufacturing, storage and dissolution, thus restricting their wide application in drug development.5–7Polymer-based amorphous solid dispersion is a common approach to improve physical stability of amorphous drugs.8 It can reduce the molecular mobility of the amorphous drugs via intermolecular interactions to lower the recrystallization risk of amorphous drugs.9–11 Nevertheless, high hygroscopicity of polymers may increase the molecular mobility of drugs.12,13 In addition, the increased volume of final product due to large quantities of polymers used may cause problems for a high-dose drug formulation and toxicity.14,15
Coamorphous, a homogenous single-phase amorphous system combining a drug with a co-former (i.e. a drug or a low-molecular-weight excipient), has recently been introduced and proved to be an effective alternative to the polymer-based amorphous solid dispersion.15–17 Various methods have been successfully applied for preparation of coamorphous systems such as milling,18 solvent evaporation,19 melt quenching,20 etc. In drug-excipient coamorphous systems, the excipients can be urea, sugars, nicotinamide, amino acids and carboxylic acid, etc.16 For instance, coamorphous lurasidone hydrochloride–saccharin prepared by solvent-evaporation method showed a significant increase in dissolution and physical stability in comparison to amorphous lurasidone hydrochloride. Moreover, the coamorphous system exhibited greatly improved solubility with pH-independent solubility behavior.19 In the drug–drug coamorphous systems, apart from the improvement of physical stability and dissolution profiles, the use of two pharmacologically relevant drugs has potential benefits to achieve the synergistic effect of combined therapy, such as protease inhibitor with anti-inflammatory drugs (e.g. coamorphous ritonavir–indomethacin21), NSAIDs with H2-receptor antagonists (e.g. coamorphous naproxen–cimetidine22), antipsychotics with antidiabetic agents (e.g. coamorphous lurasidone hydrochloride–repaglinide19).
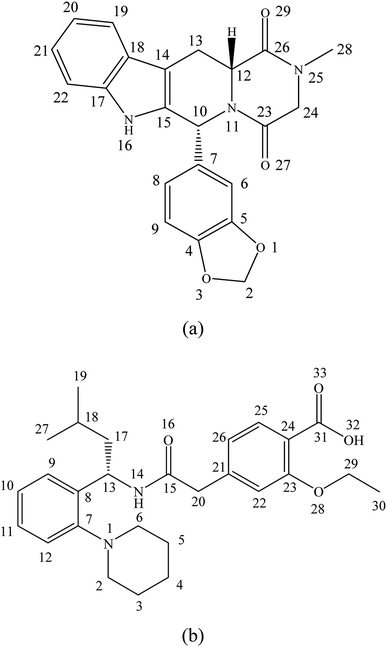
Tadalafil (Fig. 1a), a 5-type phosphodiesterase inhibitor for clinical treatment against erectile dysfunction, belongs to BCS class II drug. Its relatively low aqueous solubility (<5 μg mL−1) and dissolution rate limit its in vivo absorption.23,24 It is reported that erectile dysfunction is highly prevalent affecting at least 50% of men with diabetes mellitus worldwide. Such situation has a profound negative impact on the life quality of these patients and their family.25,26 Nowadays, tadalafil proved to be effective in the treatment of erectile dysfunction in diabetes patients.26 In addition, Popovic et al. reported that combination of antidiabetic drugs and tadalafil can even improve the bioavailability and efficacy of tadalafil.27 Repaglinide (Fig. 1b), a BCS class II drug with poor aqueous solubility, is an oral antidiabetic drug for clinical treatment of type II diabetes mellitus by stimulating insulin release from pancreatic β-cells.28 In addition, it could also reduce the incidence of erectile dysfunction complication for diabetic patients.29,30
Currently, developing multi-targeting drugs and drug combinations is a promising trend for treating complex diseases in drug research and development.31,32 Entresto™, the first multidrug cocrystal for the treatment of heart failure developed by Novartis, has been approved by the FDA in 2015. As a multidrug formulation that combines valsartan with sacubitril, it not only improves the solubility/dissolution of both drugs, but also has synergistic pharmacological effects.33,34 Here, we expect to improve the physicochemical properties of tadalafil and repaglinide by coamorphization technology. Besides, it is speculated that the combination of tadalafil and repaglinide may produce potential synergistic pharmacological effect. In the current study, coamorphous tadalafil–repaglinide was designed and prepared by solvent-evaporation method. The physicochemical properties of coamorphous system, including thermal properties, potential intermolecular interactions, solubility/dissolution properties and physical stability were investigated.
2. Materials and methods
2.1. Materials
Tadalafil (Mw = 389.4 g mol−1) was gifted by Jinan Liancheng Pharmaceutical Co., Ltd. (Jinan, China). Repaglinide (Mw = 452.6 g mol−1) was obtained from Zhejiang Hisoar Pharmaceutical Co., Ltd. (Taizhou, China). Methanol and acetonitrile of HPLC grade was purchased from E. Merck (Darmstadt, Germany). All other chemical reagents were obtained from Sinopharm Chemical Reagent Co., Ltd. (Shanghai, China).2.2. Preparation of the amorphous materials
Tadalafil and repaglinide were converted into their amorphous states by a solvent evaporation method. Briefly, 200 mg of tadalafil was dissolved in a solvent mixture comprising of 20 mL of methanol, 25 mL of acetonitrile and 25 mL of dichloromethane, followed by rotary vacuum evaporation at 40–45 °C in a water bath.35 Amorphous repaglinide was obtained by rotary evaporation of repaglinide acetone solution (∼10 mg mL−1) under 55 °C.36 The solid residue in the flask was collected and vacuum-dried for 24 h at room temperature to remove the residual solvents.Coamorphous tadalafil–repaglinide in molar ratio of 1![[thin space (1/6-em)]](https://www.rsc.org/images/entities/char_2009.gif) :
:![[thin space (1/6-em)]](https://www.rsc.org/images/entities/char_2009.gif) 1 was prepared using the same method as amorphous repaglinide. The obtained amorphous tadalafil, amorphous repaglinide and coamorphous system were sieved through a 100 mesh (∼150 μm) screen individually and stored in a vacuum desiccator over anhydrous calcium chloride at 4 °C for further study.
1 was prepared using the same method as amorphous repaglinide. The obtained amorphous tadalafil, amorphous repaglinide and coamorphous system were sieved through a 100 mesh (∼150 μm) screen individually and stored in a vacuum desiccator over anhydrous calcium chloride at 4 °C for further study.
2.3. Miscibility prediction of tadalafil with repaglinide
 | (1) |
 | (2) |
 | (3) |
The total solubility parameter (δt) can be calculated as follows (eqn (4)):
| δt = (δd2 + δp2 + δh2)0.5 | (4) |
2.4. Physicochemical characterizations
The theoretical value of Tg were calculated using the Gordon–Taylor equation (eqn (5)):9,42
 | (5) |
 | (6) |
2.5. Solubility and dissolution studies
![[thin space (1/6-em)]](https://www.rsc.org/images/entities/char_2009.gif) :
:![[thin space (1/6-em)]](https://www.rsc.org/images/entities/char_2009.gif) 1), or coamorphous system) were determined at 37 °C. An excess amount of each sample was placed in a glass vial with 5 mL of various media (0.01 M HCl, phosphate buffer solutions with pH 4.5 (PBS 4.5) and pH 6.8 (PBS 6.8), and pure water), followed by stirring with a magnetic bar for up to 24 h, and then filtered through a 0.22 μm nylon filter (Millipore, Bedford, MA). The concentrations of tadalafil and repaglinide in the obtained filtrates were determined by a validated HPLC/UV method after appropriate dilution. All solubility experiments were conducted in triplicate. Tadalafil and repaglinide were simultaneously baseline separated with retention times of 7.5 min and 4.0 min, respectively, via an Ultimate Lp-C8 (150 mm × 4.6 mm, 5 μm) column on an Agilent 1260 Infinity HPLC system (Agilent Technologies Inc., Santa Clara, CA, USA). The mobile phase, which consisted of 60% acetonitrile and 40% water (containing 0.01% trifluoroacetic acid), was run at 1.0 mL min−1 with a detection wavelength of 285 nm, and the column temperature was set to 30 °C. Within the concentration ranges of 0.5–25 μg mL−1 and 10–250 μg mL−1 for tadalafil and repaglinide, respectively, good linearities (r2 > 0.999 for both drugs) were achieved. The relative standard deviation (RSD) of the intra-day and inter-day precision for each analyte was below 2.5%, and the accuracy was within the range of 95–105%.
1), or coamorphous system) were determined at 37 °C. An excess amount of each sample was placed in a glass vial with 5 mL of various media (0.01 M HCl, phosphate buffer solutions with pH 4.5 (PBS 4.5) and pH 6.8 (PBS 6.8), and pure water), followed by stirring with a magnetic bar for up to 24 h, and then filtered through a 0.22 μm nylon filter (Millipore, Bedford, MA). The concentrations of tadalafil and repaglinide in the obtained filtrates were determined by a validated HPLC/UV method after appropriate dilution. All solubility experiments were conducted in triplicate. Tadalafil and repaglinide were simultaneously baseline separated with retention times of 7.5 min and 4.0 min, respectively, via an Ultimate Lp-C8 (150 mm × 4.6 mm, 5 μm) column on an Agilent 1260 Infinity HPLC system (Agilent Technologies Inc., Santa Clara, CA, USA). The mobile phase, which consisted of 60% acetonitrile and 40% water (containing 0.01% trifluoroacetic acid), was run at 1.0 mL min−1 with a detection wavelength of 285 nm, and the column temperature was set to 30 °C. Within the concentration ranges of 0.5–25 μg mL−1 and 10–250 μg mL−1 for tadalafil and repaglinide, respectively, good linearities (r2 > 0.999 for both drugs) were achieved. The relative standard deviation (RSD) of the intra-day and inter-day precision for each analyte was below 2.5%, and the accuracy was within the range of 95–105%.A USP II dissolution apparatus was applied in the study of intrinsic dissolution. Dissolution tests (six replicates) were performed in 900 mL of water at 37 °C with a paddle rotation speed of 50 rpm. The IDR disc sank to the bottom of the dissolution vessel with upward direction for the tablet. Three milliliter of samples were withdrawn at predetermined time points (5, 10, 15, 20, 30, 45, 60 and 90 min), followed by adding the same amount of fresh medium immediately. After filtration and appropriate dilution, the concentration of tadalafil and repaglinide were measured by the HPLC/UV method described above. To calculate the intrinsic dissolution rates (IDR) of tadalafil and repaglinide, the cumulative amount dissolved per surface area of the tablet was plotted against time. The slope of the linear region (r2 ≥ 0.95) was regarded to be the IDR value.
2.6. Stability study
2.7. Statistical analysis
Principal component analysis (PCA) was performed on the FTIR spectra using SPSS (version 24, SPSS Inc., Chicago, IL, USA). PCA is a multivariate projection method which extracts and displays the variation in the data set.43 For extracting the main characteristic components of the FTIR spectra, the highly correlated original variables of FTIR spectra are transformed into a set of uncorrelated variables by an orthogonal decomposition of the data matrix. The uncorrelated variables are called principal components (PCs) and are plotted using the eigenvalues of the principal component. All statistical data analyses were conducted using one-way ANOVA analysis with a probability level of p < 0.05 as the criterion of significance.3. Results and discussion
3.1. Theoretical miscibility of the components
The Flory–Huggins interaction parameter was originally applied to predict the thermodynamic miscibility of polymer mixtures in a binary system.44,45 In recent years, it has also been successfully used to predict the compatibility and phase stability of small molecule binary mixtures.45 According to the Flory–Huggins theory, two components are considered to be miscible when χ ≤ 0.45,46 The interaction parameter χ between tadalafil and repaglinide was calculated to be −1.27, indicating good miscibility of these two components.Similar to the application of the Flory–Huggins theory, the HSPs was also originally used to predict the miscibility of polymer mixings. The concept was expanded to the fields of nano-structures materials,47,48 pharmaceutical co-crystals and small molecule binary mixtures.40 The Flory–Huggins theory is based on the lattice model, where molecules are arranged on a regular lattice or arranged irregularly in the lattice are all considered, while the HSPs predict the miscibility by using group contribution methods that involve the summation of individual functional group contributions to the solubility parameter.45 Usually, if the HSP difference between two components is less than 7 MPa0.5, these components are considered to be miscible.40,49 For tadalafil and repaglinide, HSP values were calculated to be 26.01 MPa0.5 and 22.36 MPa0.5 (Tables S1 and S2 in ESI†), respectively, suggesting good miscibility between tadalafil and repaglinide.
3.2. Formation of amorphous tadalafil, amorphous repaglinide and coamorphous system
PXRD patterns of crystalline tadalafil, crystalline repaglinide, physical mixture, amorphous tadalafil, amorphous repaglinide, and coamorphous system are shown in Fig. 2. Crystalline tadalafil and crystalline repaglinide (Fig. 2a and b) displayed their characteristic diffraction peaks ((7.34°, 10.70°, 14.60°, 21.74°, 24.24°), and (7.58°, 10.06°, 13.75°, 20.24°, 30.81°), respectively) as previous reported.19,50 Overlapped diffraction peaks of tadalafil and repaglinide were observed in their physical mixture (Fig. 2c). After separate solvent evaporation of tadalafil and repaglinide in different solvent systems, characteristic peaks of crystalline tadalafil and repaglinide disappeared in PXRD patterns with only halos observed, suggesting the formation of amorphous tadalafil and amorphous repaglinide (Fig. 2d and e).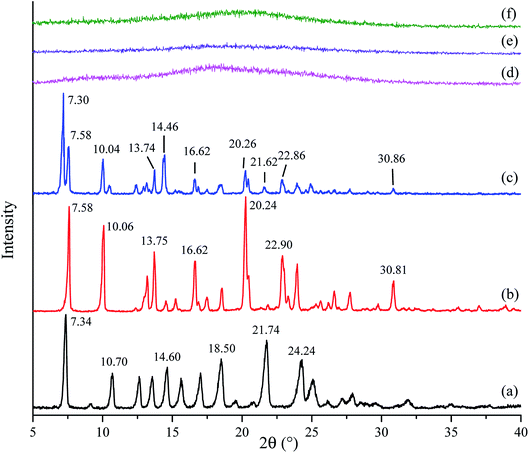 | ||
Fig. 2 PXRD patterns of crystalline tadalafil (a), crystalline repaglinide (b), physical mixture (1![[thin space (1/6-em)]](https://www.rsc.org/images/entities/char_2009.gif) : :![[thin space (1/6-em)]](https://www.rsc.org/images/entities/char_2009.gif) 1) (c), amorphous tadalafil (d), amorphous repaglinide (e), and coamorphous system (f). 1) (c), amorphous tadalafil (d), amorphous repaglinide (e), and coamorphous system (f). | ||
In addition, the coevaporation product of tadalafil and repaglinide in molar ratio of 1![[thin space (1/6-em)]](https://www.rsc.org/images/entities/char_2009.gif) :
:![[thin space (1/6-em)]](https://www.rsc.org/images/entities/char_2009.gif) 1 (Fig. 2f) also exhibited a typical halo pattern owing to the absence of crystallinity. Actually, evaporation method using acetone as solvent was also attempted to prepare amorphous tadalafil under the same evaporation condition as coamorphous system, but still crystalline tadalafil was obtained. This also suggested that the precipitate of tadalafil and repaglinide at the molar ratio of 1
1 (Fig. 2f) also exhibited a typical halo pattern owing to the absence of crystallinity. Actually, evaporation method using acetone as solvent was also attempted to prepare amorphous tadalafil under the same evaporation condition as coamorphous system, but still crystalline tadalafil was obtained. This also suggested that the precipitate of tadalafil and repaglinide at the molar ratio of 1![[thin space (1/6-em)]](https://www.rsc.org/images/entities/char_2009.gif) :
:![[thin space (1/6-em)]](https://www.rsc.org/images/entities/char_2009.gif) 1 was a coamorphous system instead of a simple physical mixture of amorphous tadalafil and amorphous repaglinide.
1 was a coamorphous system instead of a simple physical mixture of amorphous tadalafil and amorphous repaglinide.
3.3. Thermal behaviors of amorphous and coamorphous systems
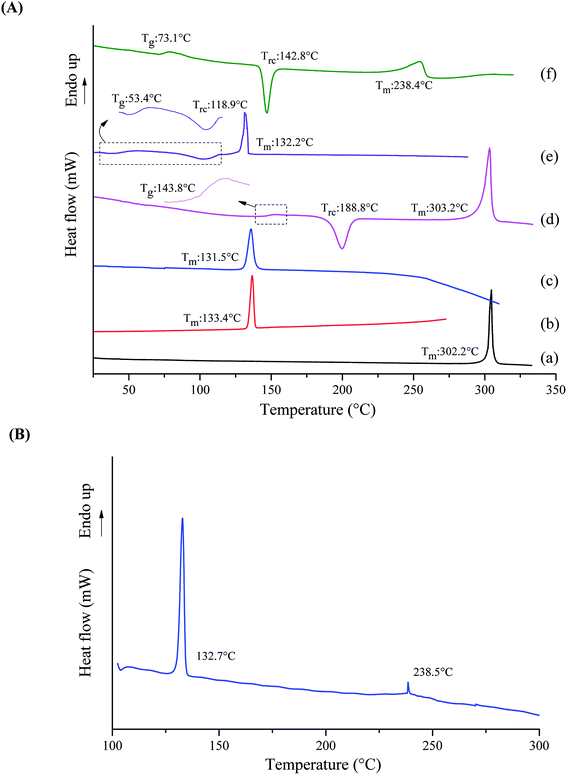
The DSC curves of crystalline tadalafil, crystalline repaglinide, physical mixture, amorphous tadalafil, amorphous repaglinide and coamorphous system are shown in Fig. 3. Crystalline systems can be characterized by their melting points, whereas the characteristic kinetic parameter of an amorphous material is the glass transition temperature (Tg). The glass transition, recrystallization (Trc), and melting temperature (Tm) of the studied materials were measured and marked in Fig. 3.Crystalline tadalafil and crystalline repaglinide exhibited their corresponding endothermic melting peaks at 302.2 °C and 133.4 °C (Fig. 3A(a and b)), respectively, which were consistent with previously reported values.19,51 The physical mixture showed only one single melting point at 131.5 °C (Fig. 3A(c)) when the heating rate was 10 °C min−1. However, when decreasing the heating rate to 2 °C min−1, the physical mixture exhibited two distinguishing endothermic peaks at 132.7 °C and 238.5 °C, respectively (Fig. 3B). The results indicated that the single melting peak at 131.5 °C (10 °C min−1) was not due to the formation of the single-phase eutectic mixture. Observation on the melting point analyzer showed that tadalafil could partially dissolve in the melt repaglinide solution and completely melt at about 240 °C, which further confirmed the above speculation. Therefore, it is speculated that the melting peak at 132.7 °C (2 °C min−1) belongs to repaglinide and the melting peak at 238.5 °C (2 °C min−1) belongs to tadalafil. Compared with pure crystalline tadalafil, the melting point and enthalpy change of tadalafil in PM decrease significantly, which might be due to the impact of the dope of melting repaglinide molecules on the thermal behavior of crystalline tadalafil in physical mixture. Such phenomenon was also observed for physical mixture of lurasidone hydrochloride and saccharin.52
In contrast to the two crystalline solids (Fig. 3A(a and b)), amorphous tadalafil and amorphous repaglinide (Fig. 3A(d and e)) underwent glass transition events at 143.8 °C and 53.4 °C, respectively, and exhibited recrystallization exothermic peaks at 188.8 °C and 118.9 °C, respectively. The endothermic peaks at 303.2 °C and 132.2 °C were attributed to the melting peak of the recrystallized tadalafil and repaglinide, which agreed with their reported values.19,50 Similarly, only a single value of Tg at 73.1 °C was observed for coamorphous system (Fig. 3A(f)), together with its PXRD halo (Fig. 2f) indicating the formation of a single phase coamorphous system of tadalafil and repaglinide. The calculation result of theoretical Tg of coamorphous system using the Gordon–Taylor equation is similar to the experimental Tg (72.7 °C vs. 73.1 °C), suggesting no intermolecular interaction existing between tadalafil and repaglinide in the coamorphous system. This indication would be further proven by FTIR characterization with PCA analyses, Raman spectroscopy and solid-state 13C NMR.
3.4. Fourier-transform infrared spectroscopy
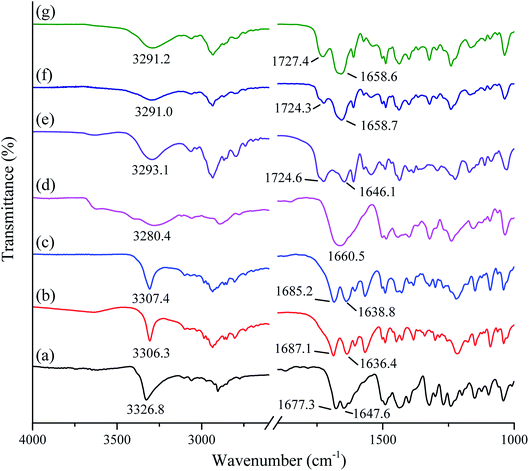
The FTIR spectra of studied samples (crystalline tadalafil, crystalline repaglinide, physical mixture, amorphous tadalafil, amorphous repaglinide, and coamorphous system) are shown in Fig. 4. Tadalafil showed typical stretching vibrations of the secondary amide group (N–H) at 3326.8 cm−1 and lactam group at 1677.3 (C![[double bond, length as m-dash]](https://www.rsc.org/images/entities/char_e001.gif) O) and 1647.6 cm−1 (C
O) and 1647.6 cm−1 (C![[double bond, length as m-dash]](https://www.rsc.org/images/entities/char_e001.gif) O), respectively (Fig. 4a). In comparison to the vibrational spectrum of crystalline tadalafil, amorphous tadalafil (Fig. 4d) exhibited significant broadenings and shifts in its characteristic absorption peaks from 3326.8 cm−1 to 3280.4 cm−1 (secondary amide N–H vibrations). Meanwhile, the two sharp peaks of lactam group at 1677.3 (C
O), respectively (Fig. 4a). In comparison to the vibrational spectrum of crystalline tadalafil, amorphous tadalafil (Fig. 4d) exhibited significant broadenings and shifts in its characteristic absorption peaks from 3326.8 cm−1 to 3280.4 cm−1 (secondary amide N–H vibrations). Meanwhile, the two sharp peaks of lactam group at 1677.3 (C![[double bond, length as m-dash]](https://www.rsc.org/images/entities/char_e001.gif) O) and 1647.6 cm−1 (C
O) and 1647.6 cm−1 (C![[double bond, length as m-dash]](https://www.rsc.org/images/entities/char_e001.gif) O) turned into a blunt peak (1660.5 cm−1), which agreed with those in previous reports.51 The crystalline arrangement of tadalafil molecules is that adjacent tadalafil molecules are hydrogen-bonded via N–H⋯O
O) turned into a blunt peak (1660.5 cm−1), which agreed with those in previous reports.51 The crystalline arrangement of tadalafil molecules is that adjacent tadalafil molecules are hydrogen-bonded via N–H⋯O![[double bond, length as m-dash]](https://www.rsc.org/images/entities/char_e001.gif) C interactions between the indole group of one molecule and the lactam carbonyl group of a neighbouring molecule.53 In a single amorphous component, the molecules are often arranged in a short-range molecular order. It is reflected in molecular interactions between similar molecules, such as the formation of homodimers in amorphous indomethacin or naproxen.14,54 In the present study, the significant bathochromic shifts and broadenings in peaks of the N–H group and C
C interactions between the indole group of one molecule and the lactam carbonyl group of a neighbouring molecule.53 In a single amorphous component, the molecules are often arranged in a short-range molecular order. It is reflected in molecular interactions between similar molecules, such as the formation of homodimers in amorphous indomethacin or naproxen.14,54 In the present study, the significant bathochromic shifts and broadenings in peaks of the N–H group and C![[double bond, length as m-dash]](https://www.rsc.org/images/entities/char_e001.gif) O of tadalafil molecules indicated the formation of homodimer in amorphous tadalafil. Comparing with crystalline repaglinide (Fig. 4b), the IR spectrum of amorphous repaglinide (Fig. 4e) also showed significant broadenings and peak shifts from 1636.4 to 1646.1 cm−1 (amide C
O of tadalafil molecules indicated the formation of homodimer in amorphous tadalafil. Comparing with crystalline repaglinide (Fig. 4b), the IR spectrum of amorphous repaglinide (Fig. 4e) also showed significant broadenings and peak shifts from 1636.4 to 1646.1 cm−1 (amide C![[double bond, length as m-dash]](https://www.rsc.org/images/entities/char_e001.gif) O vibrations), 1687.1 to 1724.6 cm−1 (C
O vibrations), 1687.1 to 1724.6 cm−1 (C![[double bond, length as m-dash]](https://www.rsc.org/images/entities/char_e001.gif) O vibrations of carboxylic acid groups) and 3306.3 to 3293.1 cm−1 (amide N–H stretching vibrations), which agreed with those in literature.55 Such changes in the peak position and shape after amorphization of repaglinide may be due to disruption of the structured crystal lattice into the amorphous state with a lack of long-range order and rearrangement of repaglinide molecules conformations.56
O vibrations of carboxylic acid groups) and 3306.3 to 3293.1 cm−1 (amide N–H stretching vibrations), which agreed with those in literature.55 Such changes in the peak position and shape after amorphization of repaglinide may be due to disruption of the structured crystal lattice into the amorphous state with a lack of long-range order and rearrangement of repaglinide molecules conformations.56
The FTIR spectra of the prepared physical mixture and amorphous physical mixture (by mixing amorphous tadalafil and amorphous repaglinide in molar ratio of 1![[thin space (1/6-em)]](https://www.rsc.org/images/entities/char_2009.gif) :
:![[thin space (1/6-em)]](https://www.rsc.org/images/entities/char_2009.gif) 1) are compared with coamorphous system shown in Fig. 4c, f and g. The absorption peaks of physical mixture and amorphous physical mixture are the superposition of tadalafil and repaglinide in their corresponding states. In comparison to amorphous physical mixture, the stretching vibrations of the most characteristic functional groups in coamorphous system show no significant shifts, including those most likely to participate in the hydrogen bonding between the two amorphous drugs (i.e., C
1) are compared with coamorphous system shown in Fig. 4c, f and g. The absorption peaks of physical mixture and amorphous physical mixture are the superposition of tadalafil and repaglinide in their corresponding states. In comparison to amorphous physical mixture, the stretching vibrations of the most characteristic functional groups in coamorphous system show no significant shifts, including those most likely to participate in the hydrogen bonding between the two amorphous drugs (i.e., C![[double bond, length as m-dash]](https://www.rsc.org/images/entities/char_e001.gif) O (1660.5 cm−1) in tadalafil, N–H (3293.1 cm−1) and C
O (1660.5 cm−1) in tadalafil, N–H (3293.1 cm−1) and C![[double bond, length as m-dash]](https://www.rsc.org/images/entities/char_e001.gif) O (1724.6 cm−1) in repaglinide).
O (1724.6 cm−1) in repaglinide).
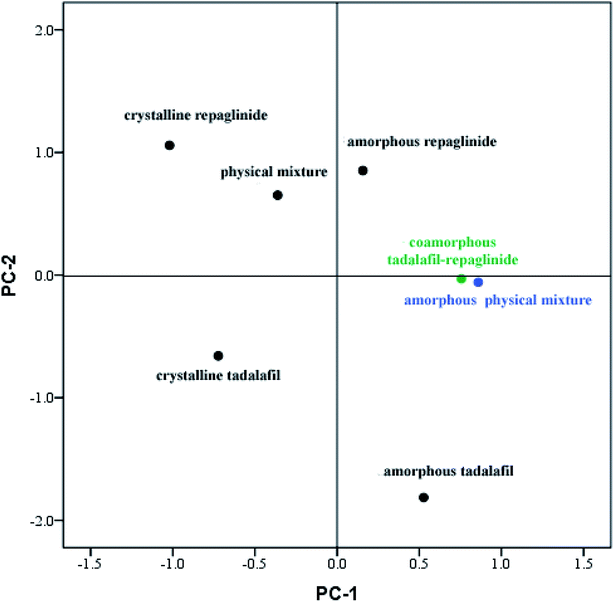
Although FTIR spectra can be used to identify changes caused by interactions between molecules, the interpretation of such results is often difficult owing to the complexity of the FTIR spectra and minor changes between amorphous physical mixture and coamorphous system in their FTIR spectra. Therefore, PCA analysis for the spectral data was applied to analyze the results of visual inspection of the FTIR spectra.57 As discussed above, only minor changes in FTIR spectra were observed between coamorphous system and amorphous physical mixture, whereas significant differences in peak width and position were detected between coamorphous system and physical mixture. It was anticipated that two factors would be responsible for changes in the FTIR spectra: changes in composition and changes in the chemical environments of the individual drugs.58 The score plot of the PCA analysis is shown in Fig. 5. From the score plot, it can be seen that there are two principal components (PC). The PC-1 arises from the difference between crystalline and amorphous states, while PC-2 explains the difference compositions with a cumulative contribution ratio that reaches more than 95%. It can be seen that the PC-1 differentiates between crystalline and amorphous systems. Crystalline tadalafil and crystalline repaglinide are obviously separated from their amorphous states in the score plot. PC-2 explains the difference in chemical composition, because crystalline tadalafil and repaglinide (or amorphous tadalafil and repaglinide) displayed quite different PC-2 scores in two separate quadrants. By comparing the scores of the samples, it can be seen that the distance between crystalline tadalafil and amorphous tadalafil is obviously much greater than that between crystalline repaglinide and amorphous repaglinide in the score plot. The result was consistent with the changes (such as shifts and broadenings of peaks, in particular the two peaks of lactam group at 1677.3 and 1647.6 cm−1) in the FTIR spectrum of tadalafil after amorphization (Fig. 4a, b, d and e). In the score plot, amorphous physical mixture and coamorphous system were closely gathered and clearly separated from PM, which suggested that the coamorphous system is similar to amorphous physical mixture.
3.5. Raman spectroscopy
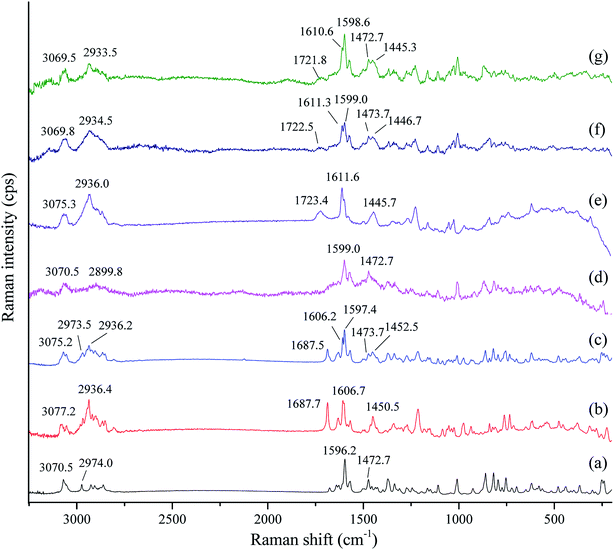
Infrared spectroscopy and Raman spectroscopy are two complementary spectral tools for the analysis of structural information of compounds. Infrared spectroscopy is suitable for the analysis of the asymmetric vibrations of polar groups, while Raman spectroscopy is applicable to study the symmetric vibrations of non-polar groups and the molecular skeleton. The two spectral techniques have always been combined to study complex structural information. In order to further investigate possible changes in the vibrations of nonpolar groups and the molecular skeleton of tadalafil and repaglinide after coamorphization, Raman spectra of samples (i.e. crystalline tadalafil, crystalline repaglinide, physical mixture, amorphous tadalafil, amorphous repaglinide, amorphous physical mixture and coamorphous system) were recorded, as shown in Fig. 6.For crystalline tadalafil, the stretching vibrations of C–H and C![[double bond, length as m-dash]](https://www.rsc.org/images/entities/char_e001.gif) C in phenyl groups in Raman spectrum were observed at 3070.5 and 1596.2 cm−1, respectively. The vibrations at 2974.0 and 1472.7 cm−1 were assigned to the stretching vibration and the asymmetrical vibration of C–H in methyl group, respectively (Fig. 6a). Crystalline repaglinide showed typical stretching vibrations of C–H at 3077.2 cm−1 and C
C in phenyl groups in Raman spectrum were observed at 3070.5 and 1596.2 cm−1, respectively. The vibrations at 2974.0 and 1472.7 cm−1 were assigned to the stretching vibration and the asymmetrical vibration of C–H in methyl group, respectively (Fig. 6a). Crystalline repaglinide showed typical stretching vibrations of C–H at 3077.2 cm−1 and C![[double bond, length as m-dash]](https://www.rsc.org/images/entities/char_e001.gif) C at 1606.7 cm−1 in phenyl groups, respectively. The stretching vibrations and the asymmetrical vibrations of C–H in methyl groups appeared at 2936.4 cm−1 and 1450.5 cm−1, respectively. The stretching vibrations at 1687.7 cm−1 belonged to the C
C at 1606.7 cm−1 in phenyl groups, respectively. The stretching vibrations and the asymmetrical vibrations of C–H in methyl groups appeared at 2936.4 cm−1 and 1450.5 cm−1, respectively. The stretching vibrations at 1687.7 cm−1 belonged to the C![[double bond, length as m-dash]](https://www.rsc.org/images/entities/char_e001.gif) O in carboxylic acid group (Fig. 6b). Raman spectrum of the physical mixture showed a simple superposition of crystalline tadalafil and repaglinide (Fig. 6c).
O in carboxylic acid group (Fig. 6b). Raman spectrum of the physical mixture showed a simple superposition of crystalline tadalafil and repaglinide (Fig. 6c).
After amorphization, similar to FTIR spectrum, Raman spectrum of amorphous tadalafil and repaglinide also showed decreased peak intensities with broadening bands and changes in frequencies of some vibrations compared with their crystalline form. For example, the stretching vibrations of C![[double bond, length as m-dash]](https://www.rsc.org/images/entities/char_e001.gif) C in phenyl group changed from 1596.2 cm−1 to 1599.0 cm−1 was observed in Raman spectrum of amorphous tadalafil (Fig. 6d). Changes in vibration frequencies of C–H and C
C in phenyl group changed from 1596.2 cm−1 to 1599.0 cm−1 was observed in Raman spectrum of amorphous tadalafil (Fig. 6d). Changes in vibration frequencies of C–H and C![[double bond, length as m-dash]](https://www.rsc.org/images/entities/char_e001.gif) C in phenyl groups (C–H: 3077.2 cm−1 → 3075.3 cm−1, C
C in phenyl groups (C–H: 3077.2 cm−1 → 3075.3 cm−1, C![[double bond, length as m-dash]](https://www.rsc.org/images/entities/char_e001.gif) C: 1606.7 cm−1 → 1611.6 cm−1) were also observed in the spectrum of amorphous repaglinide (Fig. 6e). The spectrum of amorphous physical mixture was also the overlapping of amorphous tadalafil and repaglinide (Fig. 6f). In comparison to amorphous physical mixture, coamorphous system exhibited almost the same peak positions with only slight changes in intensity (Fig. 6g). The results of Raman spectra further indicated no evidence of intermolecular interactions between tadalafil and repaglinide in the coamorphous system.
C: 1606.7 cm−1 → 1611.6 cm−1) were also observed in the spectrum of amorphous repaglinide (Fig. 6e). The spectrum of amorphous physical mixture was also the overlapping of amorphous tadalafil and repaglinide (Fig. 6f). In comparison to amorphous physical mixture, coamorphous system exhibited almost the same peak positions with only slight changes in intensity (Fig. 6g). The results of Raman spectra further indicated no evidence of intermolecular interactions between tadalafil and repaglinide in the coamorphous system.
3.6. Solid-state 13C nuclear magnetic resonance spectroscopy (Ss 13C NMR)
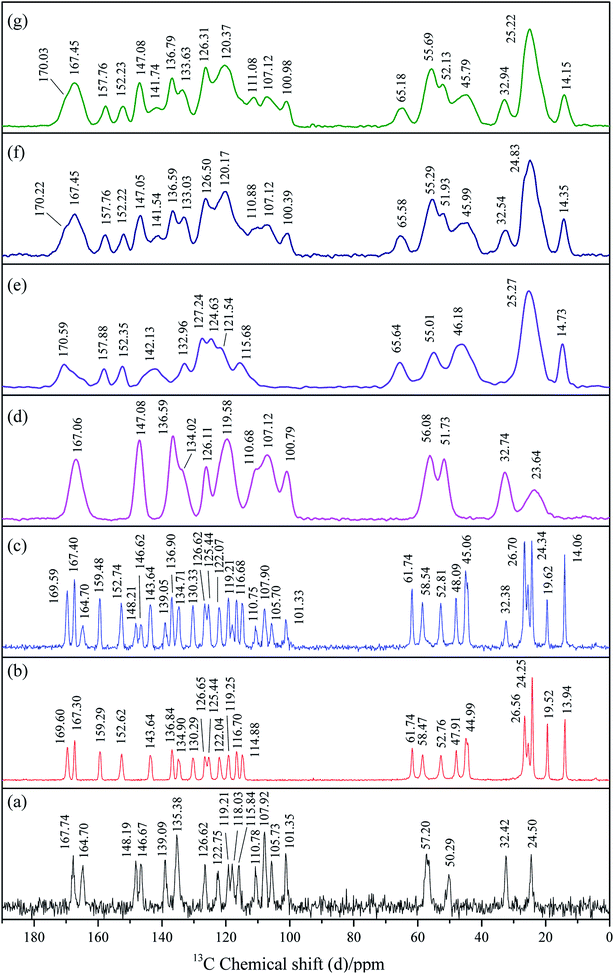
Solid-state 13C NMR has now become a routine technique for providing information on local molecular structure for a wide range of industrial applications or research purposes.59 It is not dependent on long-range order for determinations of structure and is an excellent method for detailed studies of amorphous materials. NMR is sensitive to the short-range changes of crystal structure and the varieties in the environment of the atoms in a molecule would result in the chemical shifts in its NMR spectrum. It is commonly used to investigate the molecular-level interactions.60The Ss 13C NMR spectra of crystalline tadalafil, crystalline repaglinide, physical mixture (1![[thin space (1/6-em)]](https://www.rsc.org/images/entities/char_2009.gif) :
:![[thin space (1/6-em)]](https://www.rsc.org/images/entities/char_2009.gif) 1), amorphous tadalafil, amorphous repaglinide, amorphous physical mixture (1
1), amorphous tadalafil, amorphous repaglinide, amorphous physical mixture (1![[thin space (1/6-em)]](https://www.rsc.org/images/entities/char_2009.gif) :
:![[thin space (1/6-em)]](https://www.rsc.org/images/entities/char_2009.gif) 1) and coamorphous system (1
1) and coamorphous system (1![[thin space (1/6-em)]](https://www.rsc.org/images/entities/char_2009.gif) :
:![[thin space (1/6-em)]](https://www.rsc.org/images/entities/char_2009.gif) 1), are shown in Fig. 7. Resonance assignments were presented in Tables S3 and S4 in ESI.†
1), are shown in Fig. 7. Resonance assignments were presented in Tables S3 and S4 in ESI.†
In the NMR spectrum of crystalline tadalafil, the resonances detected at 167.74 ppm and 164.70 ppm was assigned to the signal of C27 and C29 in the carbonyl groups, respectively. The single resonance at 139.09 ppm corresponded to signal of C15 and C17 in the secondary amide group (Fig. 7a), which agreed with those in literature.61 For crystalline repaglinide, the resonances at 169.60 ppm and 167.30 ppm in the NMR spectrum were assigned to C15 in the secondary amide group and C31 in the carboxyl group, respectively (Fig. 7b).62 In comparison to crystalline form, the 13C NMR spectra of amorphous tadalafil and repaglinide showed slight changes in chemical shifts with significantly broadening lines and resonances merging due to the conformational distribution after amorphization (Fig. 7d and e). The crystalline and amorphous physical mixture exhibited overlapping carbon signals of tadalafil and repaglinide in their corresponding states (Fig. 7c and f). In comparison to amorphous physical mixture, coamorphous system exhibited almost overlapped spectrum (Fig. 7g), suggesting a very similar molecular environment without molecular interaction between the two components. The above results implied that no significant intermolecular interaction existed between tadalafil and repaglinide in the coamorphous systems, which was consistent with Gordon–Taylor prediction.
Repaglinide could also be coamorphized with saccharin.36 Different to coamorphous tadalafil–repaglinide without evidence of intermolecular interaction according to FTIR, Raman and Ss 13C NMR characterizations, hydrogen bonding between secondary amino group of repaglinide and carbonyl group of saccharin was found in coamorphous repaglinide–saccharin system. Although tadalafil has proton acceptor (i.e. carbonyl group) and donor (i.e. secondary amino group) in chemical structure, the benzodioxole group might generate space steric hindrance and restrain the formation of hydrogen bonds with repaglinide or weakening the strength of such hydrogen bonds.63
3.7. Solubility determination
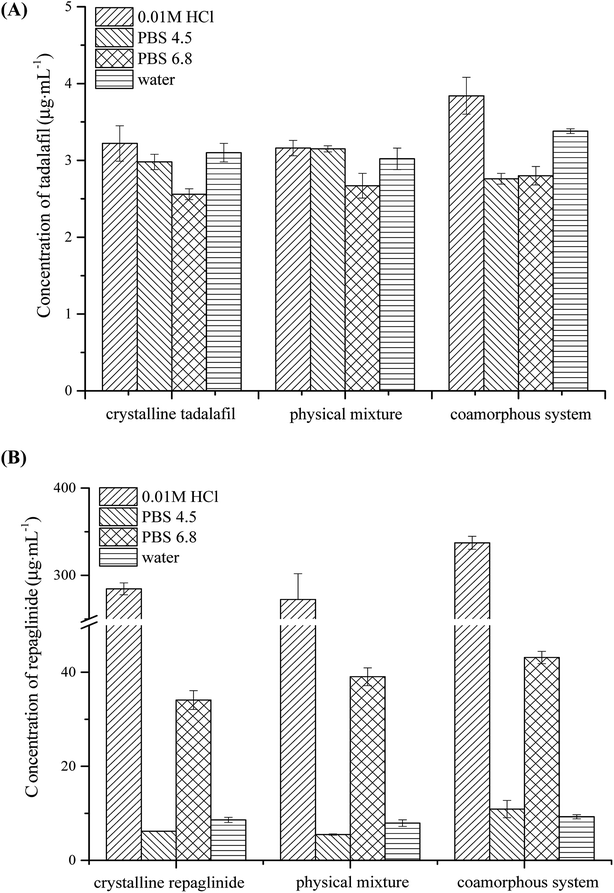
The equilibrium solubilities of crystalline tadalafil, crystalline repaglinide, physical mixture, and coamorphous system in four aqueous media (0.01 M HCl, PBS 4.5, PBS 6.8 and purified water) are presented in Fig. 8. Crystalline tadalafil had a low aqueous solubility (∼3 μg mL−1) in four media with pH-independence, which might be due to its non-ionizable property over physiological pH range.64 Crystalline repaglinide displayed pH-dependent solubility behavior with minimum solubility in PBS 4.5 owing to the zwitterionic structure of repaglinide with a carboxylic acid group and a tertiary amine group.19,65 The physical mixture shared the similar equilibrium solubilities behavior with crystalline tadalafil and repaglinide alone in four media, suggesting no enhancement/decrease in solubility in presence of the other drug. After coamorphization, tadalafil and repaglinide in coamorphous system displayed slightly higher solubilities than those in crystalline form in 0.01 M HCl, no significantly enhancement in solubilities was observed in the other three aqueous media. In all, coamorphous system exhibited similar equilibrium solubility behavior with crystalline drugs, suggesting that the coamorphous system undergo the recrystallization process in the aqueous media, which was confirmed by PLM (Fig. S1 in ESI†).3.8. Intrinsic dissolution profiles
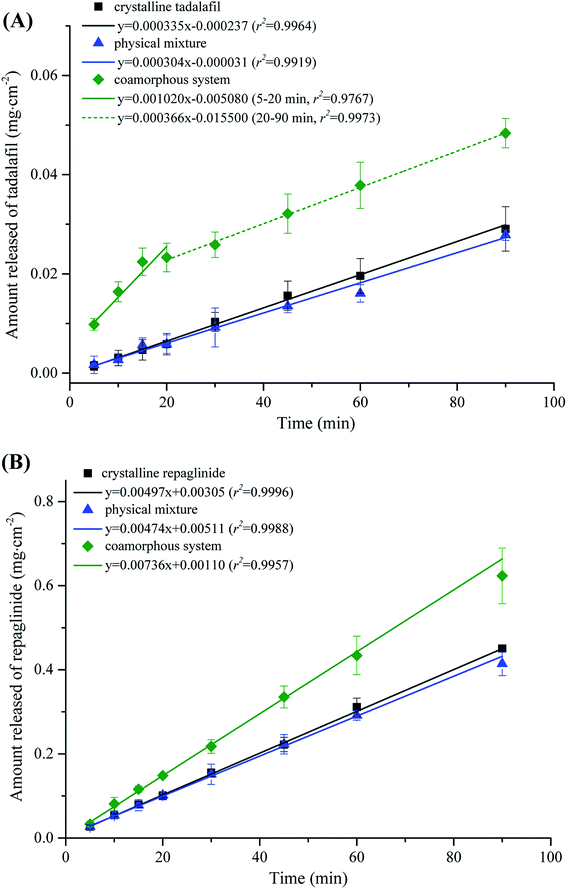
The intrinsic dissolution profiles of tadalafil and repaglinide in coamorphous in comparison with those of crystalline tadalafil, crystalline repaglinide and physical mixture are shown in Fig. 9. Crystalline tadalafil exhibited a linear release profile with an IDR of 3.35 × 10⁻⁴ mg cm−2 min−1. The dissolution profile of tadalafil in physical mixture was similar to crystalline tadalafil alone with an IDR of 3.04 × 10⁻⁴ mg cm−2 min−1. Tadalafil in coamorphous underwent a biphasic dissolution profile with two IDRs of 10.20 × 10⁻⁴ mg cm−2 min−1 (initial 20 min) and 3.66 × 10⁻⁴ mg cm−2 min−1 (during 20–90 min) (Fig. 9A). Crystalline repaglinide also displayed a single linear release profile with an IDR of 4.97 × 10⁻³ mg cm−2 min−1. The IDR for repaglinide in physical mixture was determined to be 4.74 × 10⁻³ mg cm−2 min−1. Differently, repaglinide in coamorphous system exhibited a IDR of 7.36 × 10⁻³ mg cm−2 min−1, which is 1.48-fold higher than that of crystalline repaglinide (Fig. 9B).Another set of intrinsic dissolution test was performed. At 20 min and 90 min (the end of intrinsic dissolution test), the discs were taken out of the dissolution medium and immediately put onto a tissue paper in order to remove water on the surface. Then, the surficial powder of IDR tablet were gently scraped and analyzed by PXRD (Fig. S2 in ESI†). At both sampling points, characteristic diffraction peaks belong to tadalafil (blue dashed line) but not repaglinide (red dashed line) were observed in the scraped samples from IDR tablet surface, suggesting that tadalafil in coamorphous system would quickly recrystallize while repaglinide still keep in amorphous state for at least 90 min during the IDR dissolution process. Such phenomenon agreed with the biphasic dissolution profile for tadalafil while linear dissolution profile for repaglinide. The initial rapid dissolution of tadalafil could be ascribed to its lack of long-range molecular order and higher Gibbs free energy than crystalline tadalafil,66 while the following significant reduction of IDR was owing to its recrystallization during dissolution process.67
3.9. Concentration–time profiles under supersaturated conditions
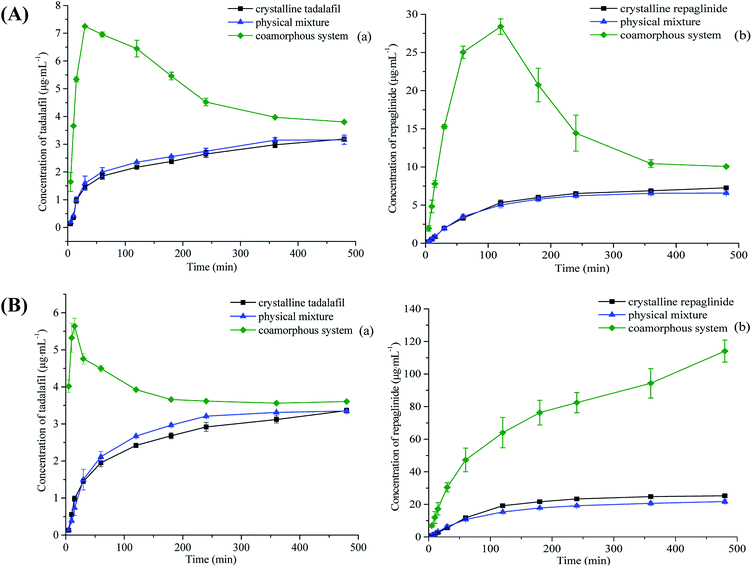
The supersaturated dissolution curves of crystalline tadalafil, crystalline repaglinide, physical mixture and coamorphous system in water and 0.2 M 6.8 PBS are shown in Fig. 10. Both tadalafil and repaglinide in pure crystalline and in physical mixture exhibited very slow dissolution and achieved their equilibrium until 6 h in two dissolution media. In addition, the dissolution profiles of tadalafil and repaglinide in physical mixture are almost overlapped with those of individual crystalline drugs.For coamorphous system, in the dissolution medium of purified water, tadalafil and repaglinide in coamorphous displayed much higher dissolution during the first 0.5 hour and 2 hours of the dissolution, respectively, followed by a slow decline to approach the dissolution profiles of the crystalline form, which was due to the precipitation of a more stable but much less soluble crystalline form from the solution by supersaturation mediated phase transformation (Fig. S3 in ESI†).68 Tadalafil in coamorphous still showed distinctive supersaturated dissolution profile in the 0.2 M 6.8 PBS media. Its peak dissolution amount was attained during the first 0.25 hour of dissolution, and then sharply declined to approach the dissolution profile of crystalline tadalafil. In contrast to tadalafil, the dissolution profile of repaglinide in coamorphous in 0.2 M 6.8 PBS exhibited a quite different dissolution behavior, with no dissolution decrease during the entire period of supersaturated dissolution over 8 h, which indicates that repaglinide in coamorphous keep in the amorphous state with high dissolution.
Theoretically, the dissolution of poorly soluble drugs may be improved after being converted into amorphous state due to lacking of long-range order molecular packing.69 However, drugs in amorphous state easily transform into crystalline state during their dissolution.70 For fast crystallizers, amorphous phase initially shows peak solubility but quickly drops (within minutes to an hour) to the low solubility of its crystalline form (“spring up” followed by “spring down”), such as amorphous docetaxel.71 For slow crystallizers, after a short period of the “spring up” effect, a gradually decreased kinetic solubility profile would be observed (“parachute” effect),72 which is due to the slow nucleation and crystal growth following the Ostwald's Law of Stages,73 such as amorphous irbesartan.74
In the current study, the concentration–time profiles of coamorphous tadalafil–repaglinide exhibits typical “spring and parachute” characteristic in the dissolution under non-sink conditions (Fig. 10). Such “spring” effect in the initial state of dissolution was due to the lack of lattice in coamorphous system, and also reflected on the significantly improved IDR for both drugs (Fig. 9). As time went on, the supersaturation levels gradually decreased as the amorphous drugs gradually crystallized (Fig. S3†). For example, the maximum concentrations of tadalafil and repaglinide were determined to be 7.25 μg mL−1 and 28.39 μg mL−1, respectively, in water at 30 min and 120 min; while they fell down to 3.80 μg mL−1 and 10.06 μg mL−1 (similar to the level of crystalline tadalafil and repaglinide) at 8 h. For the solubility determination, the coamorphous system has almost recrystallized completely after being stirred for up to 24 h, which was confirmed by PLM (Fig. S1†), thus exhibiting similar solubility to the crystalline forms.
The area under the curve (AUC) of in vitro kinetic solubility concentration–time profile (i.e. supersaturation dissolution profile) can be used to correlate the corresponding trend in absorption enhancement for in vivo studies.75,76 The calculated AUC for tadalafil and repaglinide in crystalline, physical mixture and coamorphous system were shown in Table S5 (ESI†). In comparison to crystalline tadalafil and repaglinide, their physical mixture did not show any increase in AUC of both drugs, while the coamorphous system exhibited a 1.4–2.0-fold and 2.8–3.8-fold enhancement in AUC for tadalafil and repaglinide, respectively. Although the solubility of tadalafil and repaglinide in the coamorphous system was not significantly improved, tadalafil and repaglinide exhibited the accelerated IDR and prolonged supersaturation during the dissolution process which would facilitate the absorption of both BCS class II drugs and consequently benefit their bioavailabilities.71
In our previous study, repaglinide was also successfully coamorphized with saccharin. Different to the “spring and parachute” dissolution profile of repaglinide in coamorphous tadalafil–repaglinide in purified water under non-sink condition, repaglinide in coamorphous repaglinide–saccharin showed no significant decrease even at 24 h.36 Coamorphous lurasidone hydrochloride–saccharin also exhibited similar persistent enhanced supersaturation dissolution. The formed hydrogen bonds in two saccharin-contained coamorphous systems could strengthen the linkage between repaglinide or lurasidone hydrochloride with saccharin and might inhibit the occurrence of nucleation and crystal growth under both storage and dissolution conditions. Löbmann et al. found that the intermolecular hydrogen bonds, formed between the carboxylic groups of indomethacin and naproxen in coamorphous binary drug systems, resulted in the disruption of the dimers of each drug. It might be assumed that both components at the 1![[thin space (1/6-em)]](https://www.rsc.org/images/entities/char_2009.gif) :
:![[thin space (1/6-em)]](https://www.rsc.org/images/entities/char_2009.gif) 1 molar ratio may be regarded as an interconnected state, forming a heterodimer, which can be regarded as an independent heterodimeric compound.77,78
1 molar ratio may be regarded as an interconnected state, forming a heterodimer, which can be regarded as an independent heterodimeric compound.77,78
3.10. Physical stability
The PXRD patterns of amorphous tadalafil, amorphous repaglinide and coamorphous system after storage at 25 °C/60% RH and 40 °C/75% RH are compared in Fig. 11.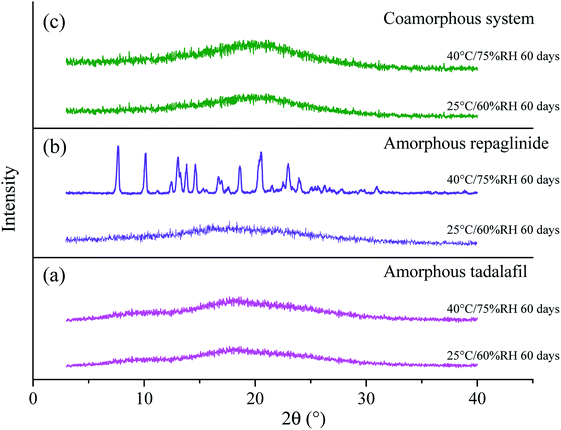 | ||
| Fig. 11 PXRD patterns for amorphous tadalafil (a), amorphous repaglinide (b) and coamorphous system (c) stored at 25 °C/60% RH and 40 °C/75% RH over a specified period. | ||
Under 25 °C/60% RH condition, halo patterns in PXRD were obtained for amorphous tadalafil, amorphous repaglinide and coamorphous system after 60 days' storage. Amorphous tadalafil also displayed good stability at 40 °C and 75% RH, as no crystalline diffraction peaks appeared after 60 days. However, characteristic diffraction peaks of crystalline repaglinide were observed for amorphous repaglinide after storage for 60 days, indicating that amorphous repaglinide undergo the recrystallization process under 40 °C/75% RH condition. For coamorphous system, no characteristic diffraction peaks of crystalline tadalafil or repaglinide were observed after storage for 60 days at 40 °C and 75% RH. Meanwhile, the corresponding DSC curves were almost identical to the fresh prepared samples' after 60 days' storage under both conditions (Fig. 12).
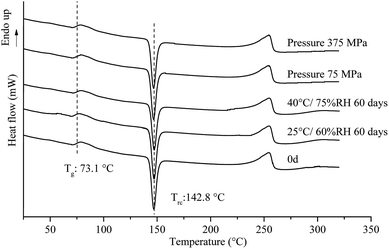 | ||
| Fig. 12 DSC patterns for coamorphous system under different pressure, and stored at 25 °C/60% RH and 40 °C/75% RH over a specified period. | ||
Apart from the influence of temperature and humidity on the stability of amorphous systems, mechanical stress is also an important factor which would induce recrystallization behavior.79 It is necessary to investigate the stability of amorphous materials under different pressure range. Generally, oral tablets are compressed under pressure in the range of 70–370 MPa.80–82 The stability of coamorphous system in current study was investigated in the range of 75–375 MPa. The PLM results for the coamorphous system and amorphous drugs alone after compression are shown in Fig. 13. Amorphous tadalafil exhibited great stability under the pressure condition without observation of birefringence for amorphous tadalafil tablets (Fig. 13A), where as amorphous repaglinide started recrystallization at 225 MPa (Fig. 13B). Coamorphous system still kept in its amorphous state under the pressure at least up to 375 MPa, as no birefringence was observed for coamorphous system tablets (Fig. 13C). Besides, the DSC curves of coamorphous system under the pressure condition are almost coincided with that of the freshly prepared (Fig. 12).
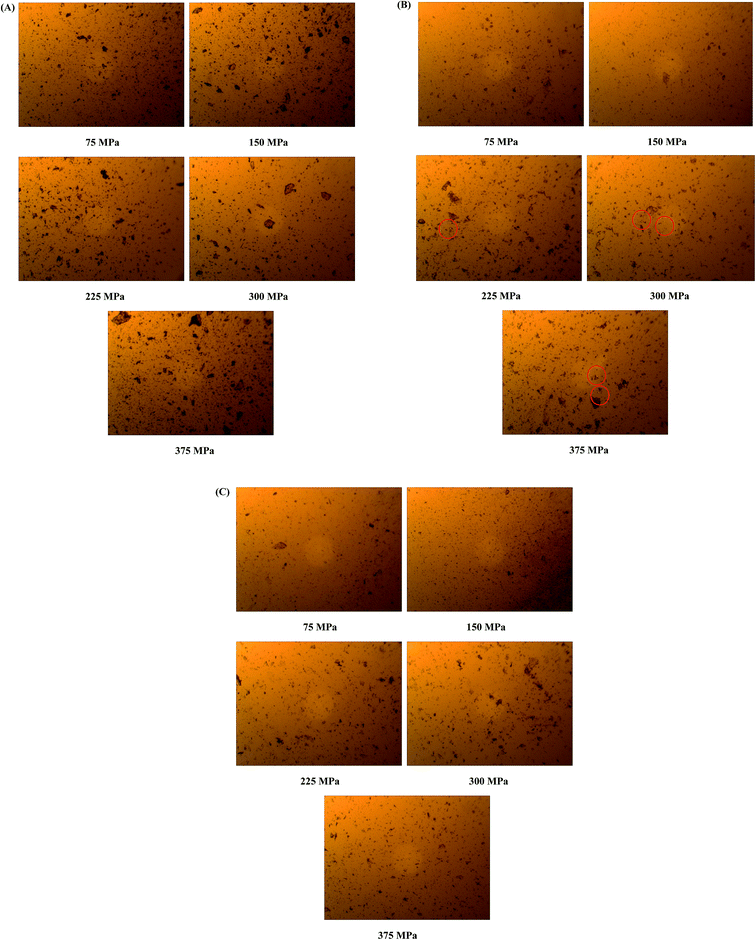 | ||
| Fig. 13 Photomicrographs of surface-scraped species of amorphous tadalafil tablet (A), amorphous repaglinide tablet (B) and coamorphous tablet (C) under different pressure conditions. | ||
In summary, compared to amorphous repaglinide, coamorphous system showed greater physical stability under different conditions. Apart from the relatively high Tg value, the stability advantage might be also due to the intimate mixing of tadalafil and repaglinide at the molecular level with homogeneous steric effects.14
4. Conclusion
In this study, coamorphous tadalafil–repaglinide was prepared and identified. The determined single Tg of coamorphous system was similar to that predicted by Gordon–Taylor equation, indicating absence of intermolecular interaction between the two components, which was further proved by FTIR with PCA analyses in combination with Raman spectroscopy and Ss 13C NMR. Although no increase in equilibrium solubilities for each drug after coamorphization, coamorphous system exhibited significantly enhanced intrinsic dissolution rate and supersaturation dissolution for both components in comparison to their crystalline forms. In addition, coamorphous system showed superior physical stability in comparison to amorphous repaglinide alone under accelerated storage condition as well as compressing condition. In conclusion, this study showed that coamorphous binary system is a promising strategy to improve the dissolution behavior and stabilize amorphous state of poorly soluble drugs.Conflicts of interest
The authors declare no competing financial interest.Acknowledgements
This research was supported by National Natural Science Foundation of China (81703712, 81773675, 81873012), “Double First-Class” University Project (CPU2018GY11, CPU2018GY27), Six Talent Peaks Project in Jiangsu Province, Top-notch Academic Programs Project of Jiangsu Higher Education Institutions (TAPP), Priority Academic Program Development of Jiangsu Higher Education Institutions (PAPD), Jiangsu Province Double Innovation Talent Program (2015), Postgraduate Research & Practice Innovation Program of Jiangsu Province.References
- L. Di, P. V. Fish and T. Mano, Drug Discovery Today, 2012, 17, 486–495 CrossRef CAS PubMed.
- H. D. Williams, N. L. Trevaskis, S. A. Charman, R. M. Shanker, W. N. Charman, C. W. Pouton and C. J. Porter, Pharmacol. Rev., 2013, 65, 315–499 CrossRef PubMed.
- S. B. Murdande, M. J. Pikal, R. M. Shanker and R. H. Bogner, J. Pharm. Sci., 2010, 99, 1254–1264 CrossRef CAS PubMed.
- J. Aaltonen and T. Rades, Dissolution Technol., 2009, 16, 47–54 CrossRef CAS.
- B. C. Hancock and G. Zograf, J. Pharm. Sci., 1997, 86, 1–12 CrossRef CAS PubMed.
- Y. Aso, S. Yoshioka and S. Kojima, J. Pharm. Sci., 2004, 93, 384–391 CrossRef CAS PubMed.
- Y. S. Guo, S. R. Bryn and G. Zografi, J. Pharm. Sci., 2000, 89, 128–143 CrossRef CAS PubMed.
- T. Vasconcelos, S. Marques, J. das Neves and B. Sarmento, Adv. Drug Delivery Rev., 2016, 100, 85–101 CrossRef CAS PubMed.
- F. Qian, J. Huang and M. A. Hussain, J. Pharm. Sci., 2010, 99, 2941–2947 CrossRef CAS PubMed.
- K. Six, G. Verreck, J. Peeters, M. Brewster and G. Van den Mooter, J. Pharm. Sci., 2004, 93, 124–131 CrossRef CAS PubMed.
- W. L. Chiou and S. Riegelman, J. Pharm. Sci., 1971, 60, 1281–1302 CrossRef CAS PubMed.
- P. J. Marsac, H. Konno, A. C. Rumondor and L. S. Taylor, Pharm. Res., 2008, 25, 647–656 CrossRef CAS PubMed.
- M. Mehta, K. Kothari, V. Ragoonanan and R. Suryanarayanan, Mol. Pharm., 2016, 13, 1339–1346 CrossRef CAS PubMed.
- S. J. Dengale, H. Grohganz, T. Rades and K. Lobmann, Adv. Drug Delivery Rev., 2016, 100, 116–125 CrossRef CAS PubMed.
- R. B. Chavan, R. Thipparaboina, D. Kumar and N. R. Shastri, Int. J. Pharm., 2016, 515, 403–415 CrossRef CAS PubMed.
- Q. Shi, S. M. Moinuddin and T. Cai, Acta Pharm. Sin. B, 2019, 9, 19–35 CrossRef PubMed.
- A. Newman, S. M. Reutzel-Edens and G. Zografi, J. Pharm. Sci., 2018, 107, 5–17 CrossRef CAS PubMed.
- K. Löbmann, H. Grohganz, R. Laitinen, C. Strachan and T. Rades, Eur. J. Pharm. Biopharm., 2013, 85, 873–881 CrossRef PubMed.
- S. Qian, Z. Li, W. Heng, S. Liang, D. Ma, Y. Gao, J. Zhang and Y. Wei, RSC Adv., 2016, 6, 106396–106412 RSC.
- A. W. Lim, K. Löbmann, H. Grohganz, T. Rades and N. Chieng, J. Pharm. Pharmacol., 2016, 68, 36–45 CrossRef CAS PubMed.
- S. J. Dengale, O. P. Ranjan, S. S. Hussen, B. S. Krishna, P. B. Musmade, G. G. Shenoy and K. Bhat, Eur. J. Pharm. Sci., 2014, 62, 57–64 CrossRef CAS PubMed.
- M. Alleso, N. Chieng, S. Rehder, J. Rantanen, T. Rades and J. Aaltonen, J. Controlled Release, 2009, 136, 45–53 CrossRef PubMed.
- H. Hamishehkar, M. Khoshbakht, A. Jouyban and S. Ghanbarzadeh, Adv. Pharm. Bull., 2015, 5, 411–417 CrossRef CAS PubMed.
- A. Krupa, O. Cantin, B. Strach, E. Wyska, Z. Tabor, J. Siepmann, A. Wrobel and R. Jachowicz, Int. J. Pharm., 2017, 528, 498–510 CrossRef CAS PubMed.
- L. S. Malavige and J. C. Levy, J. Sex. Med., 2009, 6, 1232–1247 CrossRef PubMed.
- K. Hatzimouratidis and D. Hatzichristou, Curr. Diabetes Rep., 2014, 14, 545–555 CrossRef PubMed.
- S. Popovic, D. Nale, M. Dabetic, D. Matanovic, V. Dimitrijevic-Sreckovic, G. Milic, D. Gostiljac, S. Vujovic, N. Antonijevic, T. Nisic and P. Dordevic, Vojnosanit. Pregl., 2007, 64, 399–404 CrossRef PubMed.
- C. R. Culy and B. Jarvis, Drugs, 2001, 61, 1625–1660 CrossRef CAS PubMed.
- M. Abdollahi, A. Bahreini-Moghadam, B. Emami, F. Fooladian and K. Zafari, Comp. Biochem. Physiol., Part C: Toxicol. Pharmacol., 2003, 135, 331–336 Search PubMed.
- R. Rahimi, S. Nikfar, B. Larijani and M. Abdollahi, Biomed. Pharmacother., 2005, 59, 365–373 CrossRef CAS PubMed.
- Y. Li, P. Wang, X. Li, C. Yu, H. Yang, J. Zhou, W. Xue, J. Tan and F. Zhu, PLoS One, 2016, 11, e0165737 CrossRef PubMed.
- J. Lu, W. Pan, Y. Hu and Y. Wang, PLoS One, 2012, 7, e40262 CrossRef CAS PubMed.
- O. N. Kavanagh, D. M. Croker, G. M. Walker and M. J. Zaworotko, Drug Discovery Today, 2019, 24, 796–804 CrossRef CAS PubMed.
- B. Nicolai, B. Fournier, S. Dahaoui, J. M. Gillet and N. E. Ghermani, Cryst. Growth Des., 2019, 19, 1308–1321 CrossRef CAS.
- Y. Wei, Y. Ling, M. Su, L. Qin, J. Zhang, Y. Gao and S. Qian, Chem. Pharm. Bull., 2018, 66, 1114–1121 CrossRef CAS PubMed.
- Y. Gao, J. Liao, X. Qi and J. Zhang, Int. J. Pharm., 2013, 450, 290–295 CrossRef CAS PubMed.
- C. M. Hansen, J. Paint Technol., 1967, 39, 505–510 CAS.
- C. V. S. Subrahmanyam, K. R. Prakash and P. G. Rao, Pharm. Acta Helv., 1996, 71, 175–183 CrossRef CAS.
- D. W. Van Krevelen and P. Hoftyzer, Properties of Polymers, Their Estimation and Correlation with Chemical Structure, 2nd edn, Elsevier, Amsterdam, 2009 Search PubMed.
- M. A. Mohammad, A. Alhalaweh and S. P. Velaga, Int. J. Pharm., 2011, 407, 63–71 CrossRef CAS PubMed.
- D. J. Greenhalgh, A. C. Williams, P. Timmins and P. York, J. Pharm. Sci., 1999, 88, 1182–1190 CrossRef CAS PubMed.
- A. Forster, J. Hempenstall, I. Tucker and T. Rades, Drug Dev. Ind. Pharm., 2001, 27, 549–560 CrossRef CAS PubMed.
- S. Pieters, Y. V. Heyden, J. M. Roger, M. D'Hondt, L. Hansen, B. Palagos, B. D. Spiegeleer, J. P. Remon, C. Vervaet and T. D. Beer, Eur. J. Pharm. Biopharm., 2013, 85, 263–271 CrossRef CAS PubMed.
- P. J. Marsac, S. L. Shamblin and L. S. Taylor, Pharm. Res., 2006, 23, 2417–2426 CrossRef CAS PubMed.
- K. Pajula, M. Taskinen, V. P. Lehto, J. Ketolainen and O. Korhonen, Mol. Pharm., 2010, 7, 795–804 CrossRef CAS PubMed.
- P. J. Marsac, T. Li and L. S. Taylor, Pharm. Res., 2009, 26, 139–151 CrossRef CAS PubMed.
- S. Wang, J. Liu, C. Pai, C. Chen, P. Chung, A. S. T. Chiang and S. Chang, J. Colloid Interface Sci., 2013, 407, 140–147 CrossRef CAS PubMed.
- S. Gardebjer, M. Andersson, J. Engstrom, P. Restorp, M. Persson and A. Larsson, Polym. Chem., 2016, 7, 1756–1764 RSC.
- D. Walsh, D. R. Serrano, Z. A. Worku, A. M. Madi, P. O'Connell, B. Twamley and A. M. Healy, Int. J. Pharm., 2018, 551, 241–256 CrossRef CAS PubMed.
- K. Wlodarski, W. Sawicki, A. Kozyra and L. Tajber, Eur. J. Pharm. Biopharm., 2015, 96, 237–246 CrossRef CAS PubMed.
- K. Wlodarski, W. Sawicki, K. J. Paluch, L. Tajber, M. Grembecka, L. Hawelek, Z. Wojnarowska, K. Grzybowska, E. Talik and M. Paluch, Eur. J. Pharm. Sci., 2014, 62, 132–140 CrossRef CAS PubMed.
- S. Qian, W. Heng, Y. Wei, J. Zhang and Y. Gao, Cryst. Growth Des., 2015, 15, 2920–2928 CrossRef CAS.
- D. R. Weyna, M. L. Cheney, N. Shan, M. Hanna, L. Wojtas and M. J. Zaworotko, Crystengcomm, 2012, 14, 2377–2380 RSC.
- K. Löbmann, R. Laitinen, H. Grohganz, C. Strachan, T. Rades and K. C. Gordon, Int. J. Pharm., 2013, 453, 80–87 CrossRef PubMed.
- R. Chadha, S. Bhandari, P. Arora and R. Chhikara, Pharm. Dev. Technol., 2013, 18, 504–514 CrossRef CAS PubMed.
- A. Heinz, C. J. Strachan, K. C. Gordon and T. Rades, J. Pharm. Pharmacol., 2009, 61, 971–988 CrossRef CAS PubMed.
- A. Beyer, L. Radi, H. Grohganz, K. Lobmann, T. Rades and C. S. Leopold, Eur. J. Pharm. Biopharm., 2016, 104, 72–81 CrossRef CAS PubMed.
- K. Löbmann, C. Strachan, H. Grohganz, T. Rades, O. Korhonen and R. Laitinen, Eur. J. Pharm. Biopharm., 2012, 81, 159–169 CrossRef PubMed.
- R. T. Berendt, D. M. Sperger, P. K. Isbester and E. J. Munson, TrAC, Trends Anal. Chem., 2006, 25, 977–984 CrossRef CAS.
- S. Schantz, P. Hoppu and A. M. Juppo, J. Pharm. Sci., 2009, 98, 1862–1870 CrossRef CAS PubMed.
- P. Zou, P. L. Hou, M. Y. Low and H. L. Koh, Food Addit. Contam., 2006, 23, 446–451 CrossRef CAS PubMed.
- S. Qian, Z. Li, W. Heng, S. Liang, D. Ma, Y. Gao, J. Zhang and Y. Wei, RSC Adv., 2016, 6, 106396–106412 RSC.
- B. Zhu, J. Li, Y. He, H. Yamane, Y. Kimura, H. Nishida and Y. Inoue, J. Appl. Polym. Sci., 2004, 91, 3565–3573 CrossRef CAS.
- S. Stegemann, F. Leveiller, D. Franchi, H. de Jong and H. Linden, Eur. J. Pharm. Sci., 2007, 31, 249–261 CrossRef CAS PubMed.
- Z. Mandic and V. Gabelica, J. Pharm. Biomed. Anal., 2006, 41, 866–871 CrossRef CAS PubMed.
- M. Savolainen, K. Kogermann, A. Heinz, J. Aaltonen, L. Peltonen, C. Strachan and J. Yliruusi, Eur. J. Pharm. Biopharm., 2009, 71, 71–79 CrossRef CAS PubMed.
- A. A. Elamin, C. Ahlneck, G. Alderborn and C. Nystrom, Int. J. Pharm., 1994, 111, 159–170 CrossRef CAS.
- T. Purvis, M. E. Mattucci, M. T. Crisp, K. P. Johnston and R. O. Williams, AAPS PharmSciTech, 2007, 8, E58 CrossRef PubMed.
- W. Heng, Y. Wei, Y. Xue, H. Cheng, L. Zhang, J. Zhang, Y. Gao and S. Qian, Pharm. Res., 2019, 36, 1–15 CrossRef PubMed.
- S. B. Murdande, M. J. Pikal, R. M. Shanker and R. H. Bogner, J. Pharm. Sci., 2010, 99, 1254–1264 CrossRef CAS PubMed.
- Y. Wei, S. Zhou, T. Hao, J. Zhang, Y. Gao and S. Qian, Eur. J. Pharm. Sci., 2019, 129, 21–30 CrossRef CAS PubMed.
- D. D. Bavishi and C. H. Borkhataria, Prog. Cryst. Growth Charact., 2016, 62, 1–8 CrossRef CAS.
- H. R. Guzman, M. Tawa, Z. Zhang, P. Ratanabanangkoon, P. Shaw, C. R. Gardner, H. Chen, J. P. Moreau, O. Almarsson and J. F. Remenar, J. Pharm. Sci., 2007, 96, 2686–2702 CrossRef CAS PubMed.
- G. Chawla and A. K. Bansal, Eur. J. Pharm. Sci., 2007, 32, 45–57 CrossRef CAS PubMed.
- D. J. D. Sun and P. I. Lee, Mol. Pharmaceutics, 2015, 12, 1203–1215 CrossRef CAS PubMed.
- O. A. Lake, M. Olling and D. M. Barends, Eur. J. Pharm. Biopharm., 1999, 48, 13–19 CrossRef CAS.
- K. Löbmann, R. Laitinen, H. Grohganz, K. C. Gordon, C. Strachan and T. Rades, Mol. Pharmaceutics, 2011, 8, 1919–1928 CrossRef PubMed.
- A. Lesarri, S. Blanco, J. C. Lopez and J. L. Alonso, J. Chem. Phys., 2002, 116, 4116–4123 CrossRef CAS.
- C. Bhugra, R. Shmeis and M. J. Pikal, J. Pharm. Sci., 2008, 97, 4446–4458 CrossRef CAS PubMed.
- R. Heinz, H. Wolf, H. Schuchmann, L. End and K. Kolter, Drug Dev. Ind. Pharm., 2000, 26, 513–521 CrossRef CAS PubMed.
- M. Blanco, R. Cueva-Mestanza and A. Peguero, J. Pharm. Biomed. Anal., 2010, 51, 797–804 CrossRef CAS PubMed.
- M. Blanco, M. Alcala, J. M. Gonzalez and E. Torrasz, J. Pharm. Sci., 2006, 95, 2137–2144 CrossRef CAS PubMed.
Footnotes |
| † Electronic supplementary information (ESI) available. See DOI: 10.1039/c9ra07149k |
| ‡ Authors contributed equally in the experimental works. |
| This journal is © The Royal Society of Chemistry 2020 |

